(osterbart@mpifr-bonn.mpg.de, bloecker@mpifr-bonn.mpg.de, weigelt@mpifr-bonn.mpg.de) 22institutetext: Special Astrophysical Observatory, Nizhnij Arkhyz, Karachaevo–Cherkesia, 357147, Russia (balega@sao.ru) 33institutetext: Stockholm Observatory, 133 36 Saltsjöbaden, Sweden (sasha@astro.su.se)
The dynamical evolution of the fragmented, bipolar dust shell around the carbon star IRC +10 216 ††thanks: based on observations performed with the 6 m telecope at the Special Astrophysical Observatory, Russia
Abstract
We present high–resolution –, –, and –band observations and the first color image of the carbon star IRC +10 216. The images were reconstructed from 6 m telescope speckle interferograms using the bispectrum speckle interferometry method. The and images with resolutions between 70 mas and 92 mas consist of several compact components within a 02 radius and a fainter asymmetric nebula. The brightest four components are denoted with A to D in the order of decreasing brightness in the 1996 image. A comparison of our images from 1995, 1996, 1997, and 1998 gives — almost like a movie of five frames — insight into the dynamical evolution of the inner nebula. For instance, the separation of the two brightest components A and B increased from 191 mas in 1995 to 265 mas in 1998. At the same time, component B is fading and the components C and D become brighter. The X–shaped bipolar structure of the nebula, most prominently present in the –band image, implies an asymmetric mass–loss. Such asymmetries are often present in protoplanetary nebulae but are unexpected for AGB stars. IRC +10 216 is thus likely to be very advanced in its AGB evolution, shortly before turning into a protoplanetary nebula. The cometary shapes of A in the and images and in the 0.79 m and 1.06 m HST images suggest that the core of A is not the central star, but the southern lobe of a bipolar structure. The position of the central star is probably at or near the position of component B, where the color has a value of 4.2. If the star is at or near B, then the components A, C, and D are likely to be located at the inner boundary of the dust shell.
Key Words.:
Techniques: image processing — Stars: carbon — Circumstellar matter — Stars: individual: IRC +10 216 — Stars: mass–loss — Stars: AGB, post–AGB1 Introduction
IRC +10 216 (CW Leo) is the nearest and best–studied carbon star and one of the brightest infrared sources. It experiences a strong mass loss at a rate of Myr-1 (see e.g. Loup et al. LoupForveilleEtAl93 (1993)). The central star of IRC +10 216 is a long–period variable star (LPV) with a period of approximately 649 days (Le Bertre LeBertre92 (1992)). Recent distance estimates of 110 pc to 135 pc (Groenewegen Groenewegen97 (1997)) and 150 pc (Crosas & Menten CrosasMenten97 (1997)) were reported. IRC +10 216’s initial mass can be expected to be close to 4 M⊙ (Guelin et al. GuelinForestiniEtAl95 (1995), Weigelt et al. WeigeltBalegaEtAl98 (1998)). The bipolar appearance of the nebula around this object was already reported by Christou et al. (ChristouRidgwayEtAl90 (1990)) and Kastner & Weintraub (KastnerWeintraub94 (1994)). The non-spherical structure is consistent with the conjecture that IRC +10 216 is in a phase immediately before entering the protoplanetary nebula stage. High–resolution observations of this object and its circumstellar dust shell were reported by McCarthy et al. (McCarthyMcLeodEtAl90 (1990)), Christou et al. (ChristouRidgwayEtAl90 (1990)), Dyck et al. (DyckBensonEtAl91 (1991)), Danchi et al. (DanchiBesterEtAl94 (1994)), Osterbart et al. (OsterbartBalegaEtAl97 (1997)), Weigelt et al. (WeigeltBalegaEtAl97 (1997), WeigeltBalegaEtAl98 (1998) WeigeltBloeckerEtAl99 (1999)), Skinner et al. (SkinnerMeixnerEtAl98 (1998)), and Haniff & Buscher (HaniffBuscher98 (1998)). The results of Dyck et al. (DyckBensonEtAl91 (1991)) and Haniff & Buscher (HaniffBuscher98 (1998)) showed that the structure of the dust shell of IRC +10 216 has been changing for some years. Detailed radiative transfer calculations for IRC +10 216 were recently performed by Ivezić & Elitzur (IvezicElitzur96 (1996)), Crosas & Menten (CrosasMenten97 (1997)), and Groenewegen (Groenewegen97 (1997)) using a large amount of spectroscopic and visibility data. The aim of this paper is to discuss the properties of the inner dust shell of IRC +10 216 on the basis of a series of high–resolution observations. In a second paper (Men’shchikov et al., in prep.) we will present a detailed two–dimensional radiative transfer model for this object.
2 Observational results
| Date | Filter | ||||||
|---|---|---|---|---|---|---|---|
| 8 Oct. 1995 | 2.17/0.02 | 216 | 253 | 100 | 15 | 31.5 | |
| 8 Oct. 1995 | 2.12/0.02 | 251 | 266 | 100 | 15 | 31.5 | |
| 2 Apr. 1996 | 1.24/0.28 | 1196 | 981 | 200 | 12 | 14.6 | |
| 3 Apr. 1996 | 2.17/0.02 | 1112 | 1639 | 100 | 16 | 30.6 | |
| 3 Apr. 1996 | 2.17/0.33 | 1403 | 1363 | 70 | 25 | 14.6 | |
| 23 Jan. 1997 | 1.64/0.31 | 1665 | 2110 | 100 | 15 | 19.8 | |
| 23 Jan. 1997 | 2.19/0.41 | 2165 | 1539 | 50 | 09 | 30.6 | |
| 14 Jun. 1998 | 2.17/0.33 | 800 | 571 | 50 | 16 | 30.6 | |
| 3 Nov. 1998 | 2.20/0.20 | 1087 | 842 | 40 | 13 | 27.2 | |
The IRC +10 216 speckle interferograms were obtained with the 6 m telescope at the Special Astrophysical Observatory in Russia and our Nicmos 3 camera at four epochs and with our Hawaii–array camera at one epoch (Nov. 1998). Table 1 lists the observational parameters.
2.1 -, -, and -band reconstructions
Figs. 1 and 2 show the and images, respectively, of the central region of IRC +10 216 for all epochs. The high–resolution images were reconstructed from the speckle interferograms using the bispectrum speckle interferometry method (Weigelt Weigelt77 (1977), Lohmann et al. LohmannWeigeltEtAl83 (1983), Weigelt Weigelt91 (1991)). The achieved resolution of the images depends slightly on the data quality (seeing and number of recorded interferograms) and is indicated in the figure captions. The object power spectra were determined with the speckle interferometry method (Labeyrie Labeyrie70 (1970)). The speckle transfer functions were derived from speckle interferograms of the unresolved stars mentioned in Table 1.
We denote the resolved components in the center of the nebula as A, B, C, and D (see Figs. 1g and 2b) in the order of decreasing peak intensity (based on the band results from 1996). In addition, Fig. 2b shows three fainter components denoted with E, F, and G. In Fig. 2c, cuts through the centers of components A and B of the and images from 1997 are shown to illustrate the differences in the relative intensities of A and B for different wavelengths.
Fig. 3 shows images of the faint nebula around IRC +10 216, which seems to have a bipolar structure. The resolution of these images was reduced to 149 mas () and 95 mas ( and ) to increase the signal–to–noise ratio in the outer parts of the nebula. The faint granular structure of the images ( of the peak intensity) is partly caused by speckle noise.
Note that the faint extended feature at position angle PA 340° in the image corresponds quite well to a very faint component (denoted with E in Figs. 1g and 2b) visible in all images in Figs. 1 and 2 (assuming that the brightest component in the image is roughly coinciding with component A in the and images). Two other faint features at PA 20° and PA 50° (F and G in Fig. 2b) are only visible in some of the images.
2.2 Polarimetry
Fig. 4 shows the results of polarimetric observations with the HST Nicmos camera at a wavelength of 1.1 m (raw data retrieved from the Hubble Data Archive, STScI). The data were obtained on April 30, 1997 at a photometric phase of . Data for three polarization angles were available (0°, 120°, and 240°). It has been carefully checked that the three images were correctly registered. The images have been obtained without new pointing of the telescope so that no correction was necessary (see Voit Voit97 (1997)). From the data the total intensity (contours in Fig. 4a and b), the polarized intensity (Fig. 4c), the degree and the position angle of the polarization have been derived (see e.g. Voit Voit97 (1997), Fischer et al. FischerHenningEtAl94 (1994)). Fig. 4b shows the derived polarization map superimposed on the contours of the total intensity. In Fig. 4a the two images were superimposed by centering the brightest peaks onto each other. Looking at the southern tails of A and at the northern arms this centering seems to be appropriate. The structure of the 1.1 m HST image at the position of B is affected by the diffraction pattern of A. Nevertheless, the contours indicate that a structure corresponding to B might be present in the 1.1 m image.
2.3 The core structure and the faint nebula
The multi–component structure of the IRC +10 216 –band image (of the innermost 300 mas 300 mas) has already been reported by Weigelt et al. (WeigeltBalegaEtAl98 (1998)) and Haniff & Buscher (HaniffBuscher98 (1998)). This bright inner region is surrounded by a larger faint nebula (with of the peak brightness of A; see Fig. 3b and c). Three arms of the nebula can be seen at position angles of 30° (NE), 340° (NW), and 210° (SW) with respect to component A. At 160° (counterside of the NW-arm) the nebula is much fainter. The direction from component A to component B (PA20°) can be taken as the direction of the main axis (see also Kastner & Weintraub KastnerWeintraub94 (1994)). This direction fits well to the main axis of the H13CN() emission (Dayal & Bieging DayalBieging95 (1995)) which is weakly elongated on a scale of about 10′′. On larger scales asymmetries are not observed (Dayal & Bieging DayalBieging95 (1995), Groenewegen et al. GroenewegenVanDerVeenEtAl97 (1997), Mauron & Huggins MauronHuggins99 (1999)).
2.4 The bipolar structure in and at shorter wavelengths
The –band image (Fig. 3a) and the 0.79 m and 1.06 m HST images (Haniff & Buscher HaniffBuscher98 (1998), Skinner et al. SkinnerMeixnerEtAl98 (1998), see also Fig. 4a for the total intensity of the HST 1.1 m polarization data) show a bipolar shape of the nebula. The southern lobe has a cometary or fan–shaped structure whereas the northern area of the images shows two arms reminiscent to (but weaker than) the northern X–shaped structure of the Red Rectangle (see, e.g., Men’shchikov et al. MenshchikovBalegaEtAl98 (1998)). However, the fact that even in the polarized intensity the nebula is very faint on the southeastern side suggests the main axis to be at PA20° to 30°.
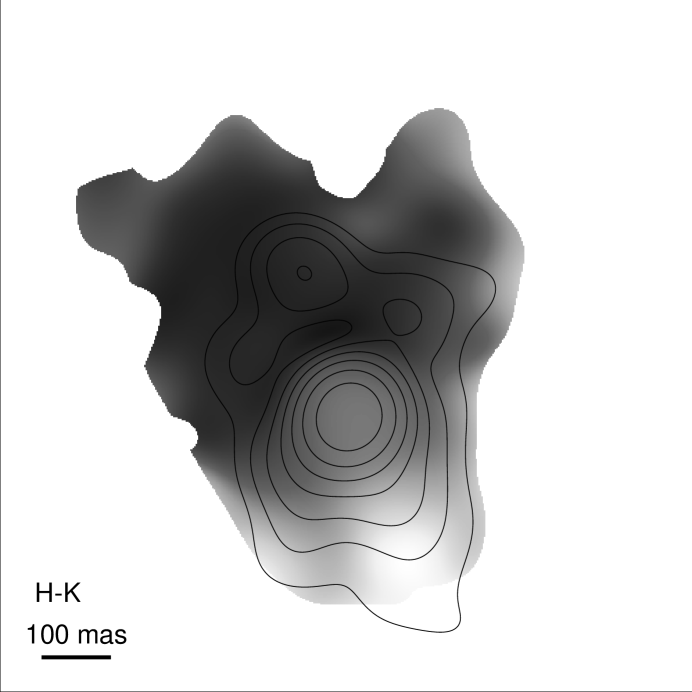
2.5 color image
For the January 1997 data, the integral intensities in the full fields of view of our camera (51 in and 78 in ) were compared to those of the photometric standard stars HIP 71284 (BS 5447) and HD 106965 (cf. Elias et al. EliasFrogelEtAl82 (1982)). The resulting IRC +10 216 magnitudes are and . According to an extrapolation of the fitted light curve of Le Bertre (LeBertre92 (1992)), IRC +10 216 was very close to its light minimum in January 1997. Our magnitudes are in good agreement with this prediction. In a square aperture of 16 the magnitudes can be determined to be and . The integral color in this field is thus . The resolved two–dimensional color image is shown in Fig. 5 together with the contours of the –band image. The and images used for the determination of the color were reconstructed with a common resolution of 95 mas which is also the resolution of the color image. The dependence of the color image on relative shifts between the two images was investigated because it is not a priori known whether the positions of the intensity maxima in and coincide. The relative position of the components A and B is very similar in the and images from 1997 so that a solution could be found where both components A and B are almost coinciding (within a few mas) for the two images. We found that the color image is not very sensitive to relative shifts within the realistic uncertainties of some milli–arcseconds.
2.6 Separation of components A and B
Fig. 6 shows the separation of the components A and B in the –band images for different epochs. Phase 0 in Fig. 6 corresponds to JD=2449430. This date of the photometric maximum was derived from the results of Le Bertre (LeBertre92 (1992)). The separations are: 191 mas, 201 mas, 214 mas, 245 mas, and 265 mas, for the 5 epochs from 1995 to 1998 shown in Fig. 1. The linear regression fit gives a value of 23 mas/yr for the average increase in the apparent separation of the components. Interpreting this increase as a real motion would lead to 14 km/s within the plane of the sky (for a distance of pc).
The apparent relative motion of the nebula components is obviously not simply related to the stellar variability which has a period of approximately 649 days (Le Bertre LeBertre92 (1992)). It may thus be related to either an overall expansion of an inhomogeneous circumstellar dust medium or a variability of the dust shell with a period significantly larger than the stellar pulsation period (cf. Fleischer et al. FleischerGaugerEtAl92 (1992), Winters et al. WintersFleischerEtAl94 (1994), WintersFleischerEtAl95 (1995)).
Table 2 lists the apparent relative velocities within the plane of the sky of the components A to E with respect to either A or B or the center positions defined by A and B or by A, B, C, and D. The values were determined from linear regression fits.
| A | B | center | center | |||||
| AB | ABCD | |||||||
| mas/yr (km/s at pc) | ||||||||
| A | - | 23 | (14) | 11 | (7) | 14 | (9) | |
| B | 23 | (14) | - | 11 | (7) | 10 | (6) | |
| C | 8 | (5) | 7 | (5) | -2 | (-1) | 0 | (0) |
| D | 21 | (13) | 7 | (5) | 9 | (5) | 6 | (4) |
| E | 39 | (24) | 25 | (15) | 31 | (19) | 31 | (19) |
2.7 Structural changes within the nebula.
The images by Haniff & Buscher (HaniffBuscher98 (1998)) taken in 1989 and 1997, as well as the one–dimensional data collected by Dyck et al. (DyckBensonEtAl91 (1991)) covering a larger range of epochs, already show that the structure of the envelope changes on time scales of some years. Our –band observations now allow us to study the changes within approximately 2 stellar pulsation cycles in more detail. Besides the apparent motion of the components, Fig. 1 shows that these components change their shapes and relative fluxes. The brightest component A appears to be rather symmetric in 1995. At the later epochs it approximately keeps its size perpendicular to the axis A–B (20°) but becomes narrower along this axis. The peak–to–peak intensity ratio of B and A is approximately constant from 1995 to 1997. Thereafter the component B started fading. At the same time the other components become brighter and detached from A. Note that the photometric phases of IRC +10 216 in January 1997 and November 1998 are almost identical. In fact, the integral magnitudes were the same (). Again we find that the time scale for the changes seen in our images is significantly different from the period of the stellar pulsation.

3 Discussion
The observations presented in the previous section as well as other high–resolution observations (e.g. Haniff & Buscher HaniffBuscher98 (1998)) provide detailed information on the variable structure in IRC +10 216. The question of where, behind all the dust, the central star is located, is of specific interest to understand the physical properties of the nebula.
At short wavelengths the nebula shows a bipolar structure. A comparison of the observed structure with other bipolar nebulae like the Red Rectangle (Men’shchikov et al. MenshchikovBalegaEtAl98 (1998)) suggests that the X–like arms originate mainly from scattering of stellar light on the surfaces of cavities. The star is then at least partially obscured by an optically thick dust shell or torus. Haniff & Buscher (HaniffBuscher98 (1998)) argued convincingly that the main axis of the object is tilted with its southern side towards the observer.
3.1 Is component A the star?
Motion of the components. From molecular line observations the terminal velocity of the expansion of the circumstellar envelope was found to be to 15 km/s (Dayal & Bieging DayalBieging95 (1995), Gensheimer & Snyder GensheimerSnyder97 (1997)). The velocities of B and D (14 km/s and 13 km/s, resp.) with respect to A can, therefore, only be understood if the direction of motion is approximately within the plane of the sky. However, the structure of the bipolar nebula at short wavelengths shows that we are looking neither pole–on nor edge–on at the nebula but at an intermediate viewing angle (e.g. 50° to 60°). The assumption that A is the star is thus not satisfactorily consistent with our observation.
Polarimetry. The synthetic polarization maps of Fischer et al. (FischerHenningEtAl96 (1996)) show that a significant polarization at the position of the star is only present for nearly edge–on configurations. The high degree of polarization of A () is thus not in agreement with A being the star. At larger separations from A the polarization pattern is centrosymmetric. The center of such a pattern is thought to be at the position of the illuminating source (Fischer et al. FischerHenningEtAl94 (1994), FischerHenningEtAl96 (1996)). The fact that in Fig. 4b this center does not coincide with A but is located significantly north of it, supports our interpretation that A is not the star.
3.2 Is the star at or near the position of B?
In the following (a to d) we will argue that the assumption that the star is at or near the position of B is consistent with the observations.
(a) The cometary shapes of A in the and the images and the 0.79 m and 1.06 m HST images (Haniff & Buscher HaniffBuscher98 (1998)), as well as the polarization data strongly suggest that A is part of a scattering lobe within a bipolar structure. Consistently, A and its southern tails are relatively blue ( ranging from 2 to 3.2 in Fig. 5) compared to the integral color.
(b) The northern components B, C, and D are, on the other hand, rather red () in comparison with the integral color. This suggests that these structures are strongly obscured and reddened by circumstellar dust.
(c) The brightest northern component in the image (Fig. 3a) can hardly be seen in the image and is thus very blue. It has a separation of 500 mas from A at a position angle of 27°. In the –band image from the same epoch (Fig. 1b) component B is at a separation of 200 mas and at a position angle of 21°. This means that B is almost in the center between the northern X–shaped -band component and the southern cometary component A (see Sect. 2.4). This morphology suggests that the latter components are the opposite lobes of a bipolar structure around a central star approximately located at the position of B.
(d) The polarization map (Fig. 4b) fits well with the picture that the star is at B. The region between the two –band lobes is only weakly polarized with polarization null points in the east and northwest. Such null points indicate a transition from an optically thick region with multiple scattering to a region with predominantly single scattering of photons (Piirola et al. PiirolaScaltritiEtAl92 (1994), Fischer et al. FischerHenningEtAl94 (1994), FischerHenningEtAl96 (1996)). The center of the centrosymmetric polarization pattern is located between the two lobes. Because of the scatter in the direction of the polarization vectors it is not possible to determine very precisely if the center coincides with B, but the polarization pattern is consistent with this assumption. We note that at the position of B the polarized intensity (Fig. 4c) may be slightly contaminated by the wings of the HST diffraction pattern associated with the dominant component A. The polarimetry of A itself, however, is not affected. Since the polarimetric features discussed above and in Sec. 3.1 are only slightly influenced by this contamination, the conclusions drawn so far do not change.
Changes in the mass loss rate. The change of the shape of component A and the fading of B can be attributed to an increasing mass loss which is accompanied by a gradual increase of the optical depth of the dust shell. This is most obvious for the later observation epochs, suggesting an enhanced mass loss since 1997. A strongly variable mass loss has, in fact, been predicted by theoretical models treating the dust formation mechanism in the envelopes of long–period variable carbon stars (Fleischer et al. FleischerGaugerEtAl92 (1992), Winters et al. WintersFleischerEtAl94 (1994), WintersFleischerEtAl95 (1995)). Periods of this mechanism may be significantly longer than the stellar pulsation period (Winters et al. WintersFleischerEtAl95 (1995)). An increasing optical depth of the inner dust shell also results in an increasing apparent separation of the dust shell structures. The apparent motion of the components is thus not solely determined by the velocity of the dust particles but also by the changes of the optical properties of the circumstellar dust.
Alternative model: the star between A and B. From the present observational data it is not possible to exclude the possibility that the star may be located between A and B, close to B, or in the center of A, B, C, and D. In particular, the precision of the polarization map is not sufficient to conclude whether the star is at the position of B or only close to it.
Radiative transfer modeling. An answer to the question of where the star is located requires radiative transfer calculations. In a second paper (Men’shchikov et al., in preparation), we will present the results of our two–dimensional radiative transfer modeling showing that the shapes of A and B cannot be reproduced when assuming a position of the star between A and B. On the other hand, it was possible to reproduce these shapes and the intensity ratio of A and B in the case where the star is assumed to be at the position of B. Clear preference is thus given to the latter model.
3.3 Stellar evolution and bipolar structure
IRC +10 216 is without doubt in a very advanced stage of its AGB evolution due to its long pulsational period, high mass-loss rate, and carbon-rich dust-shell chemistry indicating that a significant number of thermal pulses have already taken place. The star’s initial mass can be estimated to be MM⊙ due to the observed isotopic ratios of C, N and O in the dust shell (Guelin et al. GuelinForestiniEtAl95 (1995)) and the luminosity of the central star (Weigelt et al. WeigeltBalegaEtAl98 (1998)). Accordingly, the core mass should be to M⊙ with corresponding thermal-pulse cycle times of yr (Blöcker Bloecker95 (1995)). Introducing the mean observed mass-loss rate to these thermal-pulse periods shows that the present stellar wind leads to a very effective erosion of the envelope per thermal pulse cycle, possibly as high as M⊙/cycle. Consequently, the whole envelope may be lost during the next few thermal pulses leading to the termination of the AGB evolution. Thus, it is not unlikely to assume that IRC +10 216 has entered a phase immediately before moving off the AGB. This is strongly supported by the non-spherical appearence of its dust shell showing even bipolar structures. Unlike AGB stars, post-AGB objects as protoplanetary nebulae often expose prominent features of asphericities, in particular in axisymmetric geometry (e.g. Olofsson Oloff93 (1993), Oloff96 (1996)). Accordingly, IRC +10 216 can be thought to be an object in transition. It is noteworthy that the establishment of bipolar structures, i.e. the metamorphosis into a protoplanetary nebulae, obviously already begins during the (very end of) AGB evolution. The clumpiness within the bipolar shape is probably due to small scale fluctuations of the dust condensation radius which, in turn, might be influenced by, e.g., giant surface convection cells (Schwarzschild Schwarzschild75 (1975)). The formation of giant convection cells can be assumed to be a common phenomenon in red giants.
The shaping of planetary nebulae can successfully be described by interacting stellar wind models (Kwok et al. Kwoketal78 (1978), Kahn & West KahnWest85 (1985)). Within this scenario a fast (spherical) wind from the central star interacts with the slow wind of the preceding AGB evolution. The slow AGB wind is asssumed to be non-spherical (axisymmetric) which leads to the observed morphology of planetary nebulae (Mellema Mel96 (1996)).
The cause of an aspherical AGB mass loss is still a matter of debate. Different mechanisms to provide the required equatorial density enhancements are discussed (cf. Livio Liv93 (1993)). Among these, binarity is one channel including common envelope evolution and spin up of the AGB star due to the interaction with its companion (Morris Mor81 (1981), Bond & Livio BondLiv90 (1990)). Not only stellar companions are found to be able to spin up the AGB star but also substellar ones as brown dwarfs and planets, most effectively by evaporation in the AGB star’s envelope (Harpaz & Soker SokHar92 (1992), Soker Soker97 (1997)). Currently there is no observational evidence for a possible binary nature of IRC +10 216. The fact that the polarization pattern in the southeastern part of the nebula at 1.1 m has a different orientation than in the rest of the nebula might be an indication of a second illuminating source.
Mechanisms inherent to the star include rotation (Dorfi & Höfner DorHoef96 (1996), Garcia-Segura et al. GarBer99 (1999)), non-radial pulsations (Soker & Harpaz SokHar92 (1992)) and magnetic fields (Pacoli et al. Pacetal92 (1992), Garcia-Segura et al. GarBer99 (1999)). Both non-radial -modes and magnetic fields appear to only be important for significant rotation rates. Often spin-up agents due to binarity are assumed. For instance, Groenewegen (Groenewegen96 (1996)) favours non-radial pulsation or an as yet unidentified companion which spun up the central star as the most likely explanation for the non-spherical shape of the dust shell of IRC +10 216.
AGB stars are known to be slow rotators. Stars with initial masses below M⊙ can be expected to lose almost their entire angular momentum during the main sequence phase due to magnetic braking operating in their convective envelopes. Consequently, they are not believed to devolop non-spherical mass-loss due to rotation. Stars with larger initial masses are spun down due to expansion and mass loss in the course of evolution, but may achieve sufficiently high rotation rates at the end of their AGB stage (Garcia-Segura et al. GarBer99 (1999)). Even small rotation rates influence dust-driven winds considerably, yielding a mass loss preferentially driven in the equatorial plane (Dorfi & Höfner DorHoef96 (1996)). Furthermore, for supergiants leaving the Hayashi line, Heger & Langer (HegLan98 (1998)) found that significant spin up of the surface layers may take place. Thus, on second glance, inherent rotation might be able to support axisymmetric mass loss during the transition to the proto-planetary nebula phase for more massive AGB stars as IRC +10 216.
4 Conclusions
We have presented high-resolution –, –, and –band observations of IRC +10 216 with the highest resolution so far at of 70 mas. A series of –band images from five epochs between October 1995 and November 1998 shows that the inner nebula is non-stationary. The separations of the four dominant resolved components increased within the 3 years by up to . For the two brightest components a relative velocity within the plane of the sky of about 23 mas/yr or 14 km/s was found. Within these 3 years the rather faint components C and D became brighter whereas component B faded. The general geometry of the nebula seems to be bipolar.
We find that the most promising model to explain the structures and changes in the inner nebula is to assume that the star is at or near the position of component B. The star is then strongly but not totally obscured at and . Consistently component B is very red in the color while A and the northern –band components are relatively blue. The polarization pattern with strong polarization in the northern arms and also a significant polarization in the peak supports this model. The inner nebula and the apparent motions seem to be rather symmetric around this position and the observed changes are consistent with the assumption of an enhanced mass loss becoming apparent at least in 1997.
IRC +10 216 is without doubt in a very advanced stage of its AGB evolution. The observed bipolarity of its dust shell even reveals that it has possibly entered the phase of transformation into a protoplanetary nebula.
Acknowledgements.
We thank the referee for valuable comments. This research has made use of the SIMBAD database, operated at CDS, Strasbourg, France. The HST images for the polarization analysis have been retrieved from the Hubble Data Archive operated at the STScI, Baltimore, USA.References
- (1) Blöcker T., 1995, A&A 297, 727
- (2) Bond H.E., Livio M., 1990, ApJ 355, 568
- (3) Christou J. C., Ridgway S. T., Buscher D. F., Haniff C. A., McCarthy jr. D. W., 1990, in Elston R., ed., Astrophysics with infrared arrays, No. 14 in ASP conf. series, Astronomical Society of the Pacific, San Francisco, p. 133
- (4) Crosas M., Menten K. M., 1997, ApJ 483, 913
- (5) Danchi W. C., Bester M., Degiacomi C. G., Greenhill L. J., Townes C. H., 1994, AJ 107, 1469
- (6) Dayal A., Bieging J. H., 1995, ApJ 439, 996
- (7) Dorfi E., Höfner S., 1996, A&A 313, 605
- (8) Dyck H. M., Benson J. A., Howell R. R., Joyce R. R., Leinert C., 1991, AJ 102, 200
- (9) Elias J. H., Frogel J. A., Matthews K., Neugebauer G., 1982, AJ 87, 1029
- (10) Fischer O., Henning T., Yorke H. W., 1994, A&A 284, 187
- (11) Fischer O., Henning T., Yorke H. W., 1996, A&A 308, 863
- (12) Fleischer A. J., Gauger A., Sedlmayr E., 1992, A&A 266, 321
- (13) Garcia-Segura G., Langer N., Rozyczka M., Franco J., 1999, ApJ, in press
- (14) Gensheimer P. D., Snyder L. E., 1997, ApJ 490, 819
- (15) Groenewegen M. A. T., 1996, A&A 305, L61
- (16) Groenewegen M. A. T., 1997, A&A 317, 503
- (17) Groenewegen M. A. T., van der Veen W. E. C. J., Lefloch B., Omont A., 1997, A&A 322, L21
- (18) Guelin M., Forestini M., Valiron P. et al., 1995, A&A 297, 183
- (19) Haniff C. A., Buscher D. F., 1998, A&A 334, L5
- (20) Harpaz A., Soker N., 1994, MNRAS 270, 734
- (21) Heger A., Langer N., 1998, A&A 334, 210
- (22) Ivezić Ž., Elitzur M., 1996, MNRAS 279, 1019
- (23) Kahn F.D., West K.A., 1985, MNRAS 212, 837
- (24) Kastner J. H., Weintraub D. A., 1994, ApJ 434, 719
- (25) Kwok S., Purton C.R., Fitzgerald P.M., 1978, ApJ 219, L125
- (26) Labeyrie A., 1970, A&A 6, 85
- (27) Le Bertre T., 1992, A&AS 94, 377
- (28) Livio M., 1993, in Planetary Nebulae, IAU Symp. 155, R. Weinberger, A. Acker (eds.), Kluwer, Dordrecht, p. 279
- (29) Lohmann A. W., Weigelt G., Wirnitzer B., 1983, Appl. Opt. 22, 4028
- (30) Loup C., Forveille T., Omont A., Paul J. F., 1993, A&AS 99, 291
- (31) Mauron N., Huggins P. J., 1999, A&A 349, 203
- (32) McCarthy D. W., McLeod B. A., Barlow D., 1990, in Elston R., ed., Astrophysics with infrared arrays, No. 14 in ASP conf. series, Astronomical Society of the Pacific, San Francisco, p. 139
- (33) Mellema G., 1996, Ap&SS 245, 239
- (34) Men’shchikov A. B., Balega Y. Y., Osterbart R., Weigelt G., 1998, NewAst 3, 601
- (35) Morris M., 1981, ApJ 249, 572
- (36) Olofsson H., 1993, in Mass Loss on the AGB and Beyond, H. Schwarz (ed.), ESO Conf. Proc. 46, p. 330
- (37) Olofsson H., 1996, ApSS 245, 169
- (38) Osterbart R., Balega Y. Y., Weigelt G., Langer N., 1997, in Habing H. J. Lamers H. J. G. L. M., eds., Planetary Nebulae, IAU Symposium 180, Kluwer Academic Press, Dordrecht, p. 362
- (39) Pacoli G, Leclercq J., Poulain B., 1992, PASP 104, 182
- (40) Piirola V., Scaltriti F., Coyne G. V., 1994, Nat 359, 399
- (41) Schwarzschild M., 1975, ApJ 195, 137
- (42) Skinner C. J., Meixner M., Bobrowsky M., 1998, MNRAS 300, L29
- (43) Soker N., 1997, ApJS 112, 487
- (44) Soker N., Harpaz A., 1992, PASP 104, 923
- (45) Voit, M., ed., 1997, HST data handbook V3, Vol. 1, STScI, Baltimore
- (46) Weigelt G., 1977, Optics Commun. 21, 55
- (47) Weigelt G., 1991, in Wolf E., ed., Progress in Optics, Vol. 29, North Holland, Amsterdam, p. 293
- (48) Weigelt G., Balega Y. Y., Hofmann K.-H., Langer N., Osterbart R., 1997, in Paresce F., ed., Science with the VLT Interferometer, Proc. of the ESO Workshop in Garching 1996, Springer, Berlin, p. 206
- (49) Weigelt G., Balega Y. Y., Blöcker T. et al., 1998, A&A 333, L51
- (50) Weigelt G., Blöcker T., Hofmann K.-H. et al., 1999, in Le Bertre T., Lebre A., Waelkens C., eds., AGB stars, IAU symp. 191, ASP Conf. Ser., p. 273
- (51) Winters J. M., Fleischer A. J., Gauger A., Sedlmayr E., 1994, A&A 290, 623
- (52) Winters J. M., Fleischer A. J., Gauger A., Sedlmayr E., 1995, A&A 302, 483