Photometric and kinematic studies of open star clusters.
II. NGC 1960 (M 36) and NGC 2194††thanks: partly based on data observed at the
German-Spanish Astronomical Centre, Calar Alto, operated by the
Max-Planck-Institute for Astronomy, Heidelberg, jointly with the Spanish
National Commission for Astronomy
Abstract
We present CCD photometry and proper motion studies of the two open star clusters NGC 1960 (M 36) and NGC 2194. Fitting isochrones to the colour magnitude diagrams, for NGC 1960 we found an age of Myr and a distance of roughly pc and for NGC 2194 Myr and pc, respectively. We combined membership determination by proper motions and statistical field star subtraction to derive the initial mass function of the clusters and found slopes of for NGC 1960 and for NGC 2194. Compared to other IMF studies of the intermediate mass range, these values indicate shallow mass functions.
Key Words.:
open clusters and associations: individual: NGC 1960 (M 36), NGC 2194 – astrometry – stars: kinematics – Hertzsprung-Russell and C-M diagrams – stars: luminosity function, mass function1 Introduction
The shape of the initial mass function (IMF) is an important parameter to understand the fragmentation of molecular clouds and therefore the formation and development of stellar systems. Besides studies of the Solar neighbourhood (Salpeter salpeter (1955), Tsujimoto et al. tsuji (1997)), work on star clusters plays a major role (Scalo scalo1 (1986)) in this field, as age, metallicity, and distance of all stars of a star cluster can generally be assumed to be equal.
Restricted to certain mass intervals, the IMF can be described by a power law in the form
| (1) |
In this notation the “classical” value found by Salpeter (salpeter (1955)) for the Solar neighbourhood is . Average values for from more recent studies, mostly of star clusters, can be found, e.g., in Scalo (scalo2 (1998)):
| for | |||||
| for | (2) | ||||
| for |
where the “” values refer to a rough range of the slopes derived for the corresponding mass intervals, caused by empirical uncertainties or probable real IMF variations.
Knowledge of membership is essential to derive the IMF especially of open star clusters, where the contamination of the data with field stars presents a major challenge. Two methods for field star subtraction are in use nowadays: separating field and cluster stars by means of membership probabilities from stellar proper motions on one hand, statistical field star subtraction on the other hand. Our work combines these two methods: The proper motions are investigated for the bright stars of the clusters, down to the completeness limit of the photographic plates used, whereas the fainter cluster members are selected with statistical considerations.
From the cleaned data we derive the luminosity and mass functions of the clusters. Including the proper motions, we expect to receive a more reliable IMF, since the small number of bright stars in open clusters would lead to higher uncertainties, if only statistical field star subtraction were applied.
This is the second part of a series of studies of open star clusters, following Sanner et al. (n0581paper (1999)). Here we present data on two clusters of the northern hemisphere, NGC 1960 (M 36) and NGC 2194.
NGC 1960 (M 36) is located at , and has a diameter of according to the Lyngå (lynga (1987)) catalogue. Morphologically, NGC 1960 is dominated by a number of bright () stars, whereas the total stellar density is only marginally enhanced compared to the surrounding field. The cluster has not yet been studied by means of CCD photometry. Photographic photometry was published by Barkhatova et al. (barkhatova (1985)), photoelectric photometry of 50 stars in the region of the cluster by Johnson & Morgan (johnsmorg (1953)). The most recent proper motion studies are from Meurers (meurers (1958)) and Chian & Zhu (chianzhu (1966)). As their epoch differences between first and second epoch plates (36 and 51 years, respectively) are smaller than ours and today’s measuring techniques can be assumed to be more precise we are confident to gain more reliable results.
Tarrab (tarrab (1982)) published an IMF study of 75 open star clusters, among them NGC 1960, and found an exteme value for the slope of (in our notation) for this object. Her work includes only 25 stars in the mass range , so that a more detailed study covering more members and reaching towards smaller masses is necessary.
For NGC 2194 (located at , , diameter ), our work is the first proper motion study according to van Leeuwen (vanleeuwen (1985)). The RGU photographic photometry of del Rio (delrio (1980)) is the most recent publication on NGC 2194 including photometric work.
The cluster is easily detectable as it contains numerous intermediate magnitude () stars, although bright stars are lacking.
In Sect. 2, we present the data used for our studies and the basic steps of data reduction and analysis. Sects. 3 and 4 include the proper motion studies, an analysis of the colour magnitude diagrams (CMDs), and determination of the IMF of the clusters. We conclude with a summary and discussion in Sect. 5.
2 The data and data reduction
2.1 Photometry
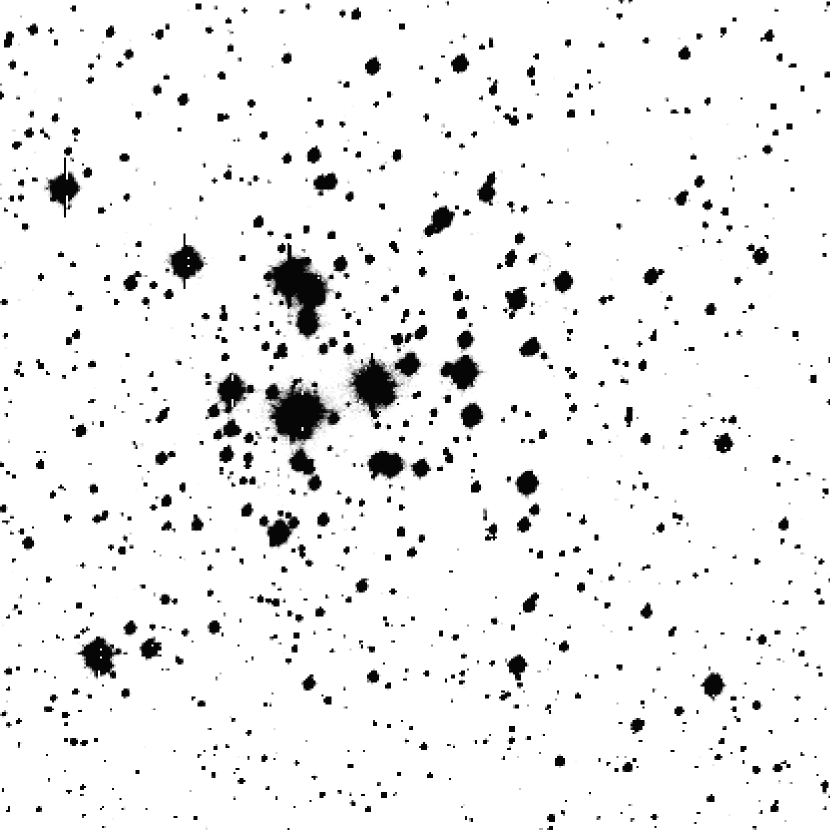
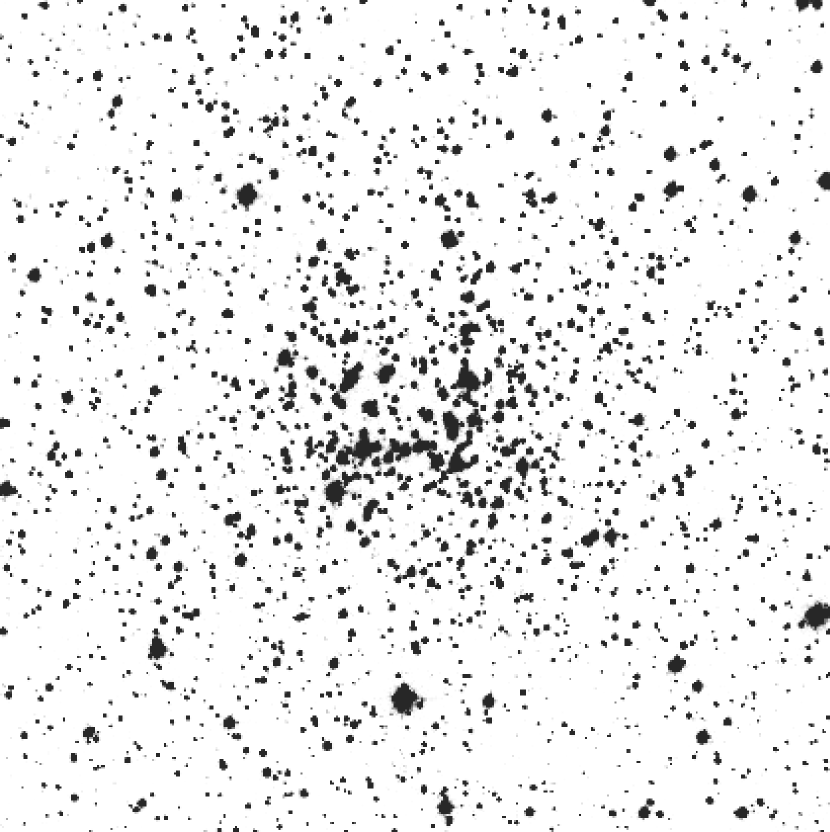
CCD images of both clusters were taken with the 1.23 m telescope at Calar Alto Observatory on October 15, 1998, in photometric conditions. The seeing was of the order of . The telescope was equipped with the pix CCD chip TEK 7_12 with a pixel size of and the WWFPP focal reducing system (Reif et al. wwfpp (1995)). This leads to a resolution of and a field of view of . Both clusters were observed in Johnson and filters, the exposure times were 1 s, 10 s, and 600 s in , and 2 s, 20 s, and 900 s in . Figs. 1 and 2 show CCD images of both clusters.
The data were reduced with the DAOPHOT II software (Stetson daophot (1991)) running under IRAF. From the resulting files, we deleted all objects showing too high photometric errors as well as sharpness and values. The limits were chosen individually for each image, typical values are to for the magnitudes, to for sharpness, and to for .
Resulting photometric errors of the calibrated magnitudes in different ranges valid for both clusters as given by the PSF fitting routine are given in Table 1.
| magnitude | |||
|---|---|---|---|
| range | |||
The data were calibrated using 44 additional observations of a total of 27 Landolt (landolt (1992)) standard stars. After correcting the instrumental magnitudes for atmospheric extinction and to exposure times of 1 s, we used the following equations for transformation from instrumental to apparent magnitudes:
| (3) | |||||
| (4) |
where capital letters represent apparent and lower case letters (corrected as described above) instrumental magnitudes. The extinction coefficients and , zero points and as well as the colour terms and were determined with the IRAF routine fitparams as:
| (5) | |||||
We checked the quality of these parameters by reproducing the apparent magnitudes of the standard stars from the measurements. The standard deviations derived were and .
Johnson & Morgan (johnsmorg (1953)) published photoelectic photometry of 50 stars in the region of NGC 1960. Their results coincide with ours with a standard deviation of approx. in and in , respectively. There is only one exception, star 110 (Boden’s (boden (1951)) star No. 46) for which we found , , which differs by and from the value of Johnson & Morgan (johnsmorg (1953)). In their photographic photometry, Barkhatova et al. (barkhatova (1985)) found values for this star which coincide with ours. We therefore assume the difference most likely to be caused by a mis-identification of this star by Johnson & Morgan (johnsmorg (1953)).
All stars for which and magnitudes could be determined are listed in Tables 2 (NGC 1960, 864 stars) and 3 (NGC 2194, 2120 stars), respectively. We derived the CMDs of the two clusters which are shown in Figs. 3 and 4. A detailed discussion of the diagrams is given in Sects. 3 and 4.

| No. | Boden | ||||
|---|---|---|---|---|---|
| No. | [mag] | [mag] | |||

| No. | del Rio | ||||
|---|---|---|---|---|---|
| No. | [mag] | [mag] | |||
2.2 Actual cluster sizes
Mass segregation might lead to a larger “true” cluster size than stated, e.g., in the Lyngå (lynga (1987)) catalogue: While the high mass stars are concentrated within the inner part of the cluster, the lower mass stars might form a corona which can reach as far out as the tidal radius of the cluster (see, e.g., the recent work of Raboud & Mermilliod raboud2 (1998)). Therefore, the range of the cluster stars had to be checked. We applied star counts in concentric rings around the centre of the clusters.
Star counts in the vicinity of NGC 2194 show no significant variations of the stellar density outside a circle with a diameter of (corresponding to pc at the distance of the object) around the centre of the cluster. For NGC 1960, this point is more difficult to verify, since its total stellar density is much lower than for NGC 2194, so that it is not as easy to see at which point a constant level is reached, and on the other hand, its smaller distance lets us reach fainter absolute magnitudes so that the effect of mass segregation might be more prominent within the reach of our photometry. However, our tests provided evidence, too, that the cluster diameter is no larger than . It must be stressed that these figures can only provide lower limits for the real cluster sizes: Members fainter than the limiting magnitude of our photometry might reach further out from the centres of the clusters.
2.3 Proper motions
For our proper motion studies we used photographic plates which were taken with the Bonn Doppelrefraktor, a 30 cm refractor (, scale: ) which was located in Bonn from 1899 to 1965 and at the Hoher List Observatory of Bonn University thereafter. The 16 cm 16 cm plates cover a region of . They were completely digitized with linear resolution with the Tautenburg Plate Scanner, TPS (Brunzendorf & Meusinger TPS (1998), TPS99 (1999)). The positions of the objects detected on the photographic plates were determined using the software search and profil provided by the Astronomisches Institut Münster (Tucholke aim (1992)).
In addition, we used the 1 s to 20 s Calar Alto exposures to improve data quality and — for NGC 2194 — to extend the maximum epoch difference. Furthermore, a total of 16 CCD frames of NGC 1960 which were taken with the 1 m Cassegrain telescope ( with a focal reducing system) of the Hoher List Observatory were included in the proper motion study. The latter observations cover a circular field of view of in diameter which provides a sufficiently large area for the cluster itself and the surrounding field. The astrometric properties of this telescope/CCD camera system were proven to be suitable for this kind of work in Sanner et al. (holicam (1998)). The stellar positions were extracted from the CCD frames with DAOPHOT II routines (Stetson daophot (1991)). A list of the plates and Hoher List CCD images included in our study can be found in Table 4.
| cluster | plate no. | date | |
| NGC 1960 | R0238 | 30.01.1916 | 20 |
| R0288 | 26.01.1917 | 90 | |
| R0365 | 21.01.1919 | 240 | |
| hl01093 | 15.01.1996 | 1 | |
| hl01095 | 15.01.1996 | 1 | |
| hl01099 | 15.01.1996 | 1 | |
| hl01100 | 15.01.1996 | 1 | |
| hl01104 | 15.01.1996 | 1 | |
| hl01105 | 15.01.1996 | 1 | |
| hl01875 | 08.03.1996 | 1 | |
| hl01876 | 08.03.1996 | 1 | |
| hl01880 | 08.03.1996 | 1 | |
| hl01881 | 08.03.1996 | 1 | |
| hl01885 | 08.03.1996 | 1 | |
| hl01886 | 08.03.1996 | 1 | |
| hl02519 | 12.03.1996 | 1 | |
| hl02520 | 12.03.1996 | 1 | |
| hl02523 | 12.03.1996 | 1 | |
| hl02524 | 12.03.1996 | 1 | |
| R1902 | 15.03.1999 | 60 | |
| R1903 | 15.03.1999 | 60 | |
| R1905 | 17.03.1999 | 60 | |
| NGC 2194 | R0297 | 14.02.1917 | 20 |
| R0333 | 14.02.1918 | 130 | |
| R0334 | 15.02.1918 | 60 | |
| R0336 | 16.02.1918 | 10 | |
| R0337 | 16.02.1918 | 60 | |
| R1125 | 01.11.1972 | 35 | |
| R1142 | 14.02.1974 | 60 | |
| R1144 | 17.02.1974 | 60 |
The fields of the photographic plates contain only a very limited number of HIPPARCOS stars (ESA hipp (1997)), as summarized in Table 5. Therefore, we decided to use the ACT catalogue (Urban et al. act (1998)) as the basis for the transformation of the plate coordinates to celestial coordinates . For NGC 2194 this decision is evident, for NGC 1960 we preferred the ACT data, too, as the brightest HIPPARCOS stars are overexposed on several plates, thus lowering the accuracy of positional measurements: It turned out that only three of the HIPPARCOS stars were measured well enough to properly derive their proper motions from our data. The celestial positions of the stars were computed using an astrometric software package developed by Geffert et al. (geffert97 (1997)). We obtained good results using quadratic polynomials in and for transforming to for the photographic plates and cubic polynomials for the CCD images, respectively.
Initial tests in the fields of both clusters revealed that the proper motions computed for some ten ACT stars disagreed with the ACT catalogue values. We assume that this is caused by the varying accuracy of the Astrographic Catalogue which was used as the first epoch material of the ACT proper motions or by unresolved binary stars (see Wielen et al. wielen (1999)). We eliminated these stars from our input catalogue.
The proper motions were computed iteratively from the individual positions: Starting with the ACT stars to provide a calibration for the absolute proper motions and using the resulting data as the input for the following step, we derived a stable solution after four iterations. Stars with less than two first and second epoch positions each or a too high error in the proper motions ( in or ) were not taken into further account.
| cluster | HIPPARCOS | ACT |
|---|---|---|
| NGC 1960 | 8 | 135 |
| NGC 2194 | 4 | 82 |
To determine the membership probabilities from the proper motions, we selected wide areas around the centres of the clusters. This dimension well exceeds the proposed diameter of both clusters so that we can assume to cover all member stars for which proper motions were determined. Furthermore, this region covers the entire field of view of the photometric data. The membership probabilities were computed on the base of the proper motions using the method of Sanders (sanders (1971)): We fitted a sharp (for the members) and a wider spread (for the field stars) Gaussian distribution to the distribution of the stars in the vector point plot diagram and computed the parameters of the two distributions with a maximum likelihood method. From the values of the distribution at the location of the stars in the diagram we derived the membership probabilities. The positions of the stars did not play any role in the derivation of the membership probabilities. In the following, we assumed stars to be cluster members in case their membership probability is or higher.
2.4 Colour magnitude diagrams
Before analysing the CMDs in detail, we had to distinguish between field and cluster stars to eliminate CMD features which may result from the field star population(s). For the stars down to (NGC 1960) and (NGC 2194) we found after cross-identifying the stars in the photometric and astrometric measurements that our proper motion study is virtually complete. Therefore we used these magnitudes as the limits of our membership determination by proper motions. For the fainter stars we statistically subtracted the field stars:
We assumed a circular region with a diameter of 806 pixels or to contain all cluster member stars. As seen in Sect. 2.2, this exceeds the diameters of the clusters. The additional advantage of this diameter of the “cluster” region is that this circle corresponds to exactly half of the area covered by the CCD images so that it was not necessary to put different weights on the star counts in the inner and outer regions. We compared the CMDs of the circular regions containing the clusters with the diagrams derived from the rest of the images to determine cluster CMDs without field stars. The method is described in more detail in, e.g., Dieball & Grebel (dieball (1998)).
We fitted isochrones based on the models of Bono et al. (isoteramo (1997)) and provided by Cassisi (private communication) to the cleaned CMDs. We assumed a Solar metallicity of and varied the distance modulus, reddening, and ages of the isochrones. Comparison with the isochrones of other groups (Schaller et al. schaller (1992), Bertelli et al. padua (1994)) does not show any significant differences in the resulting parameters.
2.5 Mass function
For the IMF study it is important to correct the data for the incompleteness of our photometry. With artificial star experiments using the DAOPHOT II routine addstar we computed -magnitude depending completeness factors for both clusters. The photometry was favoured for these experiments since its completeness decreases earlier as a consequence of its brighter limiting magnitude. According to Sagar & Richtler (sagricht (1991)), the final completeness of the photometry after combining the and data is well represented by the least complete wavelength band, hence completeness was not studied. The results, which are approximately the same for both NGC 1960 and NGC 2194, are plotted in Fig. 5: The sample is — except for a few stars which likely are missing due to crowding effects — complete down to , and for stars with , we still found more than 60 % of the objects. In general, we found that the completeness in the cluster regions does not differ from the values in the outer parts of the CCD field. We therefore conclude that crowding is not a problem for our star counts, even at the faint magnitudes. However, crowding may lead to an increase in the photometric errors, especially in the region of NGC 2194, in which the stellar density is considerably higher than for NGC 1960.

Several objects remained far red- or bluewards of the lower part of the main sequence after statistical field star subtraction. We assume that this results from the imperfect statistics of the sample. For a formal elimination of these stars we had to define a region of the CMD outside of which all objects can be considered to be non-members. This was achieved by shifting the fitted isochrones by two times the errors listed in Table 1 in and to the lower left and the upper right in the CMD (Since this procedure applies only to stars within the range of the statistical field star subtraction, we used the errors given for the faint stars in our photometry.). To take into account probable double or multiple stars we added another to the shift to the upper right, and for NGC 2194 we allowed another in the same direction as a consequence of the probably higher photometric errors due to crowding in the central part of the cluster. All stars outside the corridor defined in this way are not taken into account for our further considerations. The shifted isochrones are plotted as dotted lines in Figs. 10 and 14, respectively. It may be remarked that according to Iben (iben (1965)) we can exclude objects with a distance of several magnitudes in or a few tenths of magnitudes in from the isochrone to be pre-main sequence members of neither NGC 1960 nor NGC 2194.
We furthermore selected all objects below the turn-off point of the isochrones. For the remaining stars, we calculated their initial masses on the base of their magnitudes. We used the mass-luminosity relation provided with the isochrone data. was preferred for this purpose as the photometric errors are smaller in compared to the corresponding magnitudes. The mass-luminosity relation was approximated using order polynomials
| (6) |
which resulted in an rms error of less than 0.01. Using or lower order polynomials caused higher deviations especially in the low mass range. The values of the parameters are listed in Table 6.
| NGC 1960 | NGC 2194 | |||
|---|---|---|---|---|
Taking into account the incompleteness of the data, we determined the luminosity and initial mass functions of the two clusters. The IMF slope was computed with a maximum likelihood technique. We preferred this method instead of the “traditional” way of a least square fit of the mass function to a histogram, because those histogram fits are not invariant to size and location of the bins: Experiments with shifting the location and size of the bins resulted in differences of the exponent of more than . Fig. 6 shows the results of such an experiment with the NGC 1960 data. The fitted IMFs show an average value of around with individual slopes ranging from down to . This can be explained by the very small number of stars in the higher mass bins which contain only between one and ten stars. In case only one member is mis-interpreted as a non-member or vice versa, the corresponding bin height might be affected by up to in the worst case which will heavily alter the corresponding IMF slope. In addition, all bins of the histogram obtain the same weight in the standard least square fit, no matter how many stars are included. For very populous or older objects (globular or older open star clusters, see, e.g., the IMF of NGC 2194) this effect plays a minor role, because in these cases the number of stars per bin is much higher. On the other hand, the maximum likelihood method does not lose information (as is done by binning), and each star obtains the same weight in the IMF computation.
Nevertheless, for reasons of illustration we sketch the IMF of our two clusters with an underlying histogram in Figs. 12 and 16.

3 NGC 1960
3.1 Proper motion study
With the method described above, we determined the proper motions of 1,190 stars within the entire field of the photographic plates. We found that the limiting magnitude of the second epoch plates is brighter than that of the first epoch plates. This effect is compensated by the addition of the CCD data, so that in the cluster region we reach fainter stars than in the outer region of the field. Therefore, the limiting magnitude of the proper motion study is fainter in the area for which the CCD data were available.
After four iterations of proper motion determination, the comparison of the computed proper motions with ACT led to systematic positional differences of the order of and and for the proper motions of around . The internal dispersion of the proper motions was computed from the deviations of the positions from a linear fit of and as functions of time. We derived mean values of and for individual stars.
We detected a slight, but systematic slope of the proper motions in depending on the magnitude of the stars resulting in a difference of approximately for the proper motions between the brightest and faintest members. As the magnitude range of the ACT catalogue within our field of view is limited to approximately 11 mag, we used the positions provided by the Guide Star Catalog (GSC) Version 1.2 (Röser et al. gsc (1998)), which covers stars over the entire range of our proper motion study, for further analysis. The disadvantage of GSC is the fact that it does not provide proper motions. Therefore, all results obtained with this catalogue are relative proper motions only. Fig. 7 shows the proper motions in and their dependence on the magnitudes derived from this computation for the stars in the inner region of the photographic plates. The diagram shows that only the stars brighter than are influenced by a clear magnitude term leading to deviations of up to with respect to the stars fainter than which do not show any systematic trend. We included a magnitude term into our transformation model, however, since the behaviour is not linear with magnitudes and different from plate to plate we were unable to completely eliminate the effect. Furthermore, taking into account that many of the ACT stars are brighter than , it is clear that this deviation was extrapolated over the entire range of the proper motion study.
Meurers (meurers (1958)), who had used the same first epoch material for his proper motion study, found a similar phenomenon and suggested that the bright and the faint stars in the region of NGC 1960 form independent stellar “aggregates”. In his study the proper motion difference between bright and faint stars is much more prominent. Taking into account his smaller epoch difference of 36 years this could be explained assuming that the effect is caused by (at least some of) the first epoch plates on which the positions of the brighter stars seem to be displaced by an amount of approximately to compared to the fainter objects, whereas both his and our second epoch data are unaffected. This proposition would also explain why we did not detect this inaccuracy during the determination of the positions on the plates, since the uncertainties of single positional measurements are of the same order of magnitude.
The proper motions in proved to be unaffected by this phenomenon.
We found that when using the ACT based proper motions, the membership determination is not affected by this problem, since the magnitude trend in is smoothed over the magnitude range (in comparison with Fig. 7). On the other hand, in the GSC solution, the bright stars have proper motions differing too much from the average so that almost all of them are declared non-members. Therefore we used the results based on the ACT data for the computation of the membership probabilities. Table 7 shows a list of all proper motions determined on the base of the ACT catalogue.

| No. | Boden | ||||
| No. | [hhmmss.sss] | [∘ ] | [mas yr-1] | ||
The vector point plot diagram as determined on the base of ACT for the stars in the central region of the plates is presented in Fig. 8. Membership determination resulted in 178 members and 226 non-members of NGC 1960. The distribution of membership probabilities sketched in Fig. 9 shows a clear separation of members and non-members with only a small number of stars with intermediate membership probabilities. The centre of the proper motion distribution of the cluster members in the vector point plot diagram is determined to be
| (7) | |||||
| (8) |
The width of the Gaussian distribution of the proper motions is around and hence the same as the error of the proper motion of a single object. The field moves very similarly with
| (9) | |||||
| (10) |
The similarity of field and cluster proper motions makes membership determination a difficult task: Several field stars which by chance have the same proper motion as the cluster stars will be taken for members.


These results cannot be used for a determination of the absolute proper motion of the cluster, since the centre of the distribution can be assumed to be displaced upwards in the vector point plot diagram as a consequence of the magnitude dependence of the values. To obtain reliable absolute proper motions, nevertheless, we used the fainter () part of the proper motions computed on the base of GSC 1.2 which are stable with magnitudes and compared their relative proper motions with the values given for the corresponding stars in the ACT. We found a difference of and and centres of the GSC based proper motion distributions of and . As a consequence we determined the absolute proper motions of NGC 1960 to be
| (11) | |||||
| (12) |
As expected, the value of the proper motion in right ascension is — compared to Eq. (7) — unaffected within the errors, whereas is different from the value of Eq. (8) by a value which corresponds to the error of .
3.2 Colour magnitude diagram properties

The CMD of NGC 1960 (Fig. 10) shows a clear and narrow main sequence with an indication of a second main sequence including approximately 15 stars from to (corresponding to masses from to ). These stars might be Be stars (see, e.g., Zorec & Briot zorec (1991)) or unresolved binaries (see, e.g., Abt abt (1979) or the discussion in Sagar & Richtler sagricht (1991)).
Slettebak (slettebak (1985)) reports on two Be stars in NGC 1960. One of them, our star 1374 (Boden’s (boden (1951)) star No. 505, erroneously named No. 504 by Slettebak), clearly fails to fulfil our membership criterion with a proper motion of and . In addition, it is located so far off the centre of the cluster that it is even outside the field of our CCD images. On the other hand, star 4 (Boden’s (boden (1951)) star No. 101, , ) shows a proper motion of and which makes it a very likely cluster member with a membership probability of . In Fig. 10, this object is marked with a circle. A third Be star in the region is mentioned in the WEBDA database (Mermilliod webda (1999)): Boden’s (boden (1951)) star No. 27, or our star 8. We obtained a proper motion of , . From these figures we computed a membership probability of so that this star is a likely cluster member. We marked this object in Fig. 10 with a cross. As there is no evidence for any further Be stars, it is plausible to assume that the other stars forming the second main sequence most likely are unresolved binary stars.
The star at , (star 29 of our sample, marked with a triangle in Fig. 10) does not fit to any isochrone which properly represents the other stars in this magnitude range. It shows a proper motion of and resulting in a membership probability of . This object may be an example for a star which coincidentally shows the same proper motion as the cluster, but being in fact a non-member.
From our isochrone fit, we derived the parameters given in Table 8. Age determination was quite a difficult task for NGC 1960, as there are no significantly evolved (red) stars present in the CMD. We found that the 16 Myr isochrone might be the optimal one, since it represents the brightest stars better than the (in terms of ages) neighbouring isochrones. The comparably large error we adopted reflects this consideration.
| NGC 1960 | ||
|---|---|---|
| distance modulus | = | |
| i.e. distance | = | |
| reddening | = | |
| age | = | |
| i.e. | = | |
| metallicity | = | |
| NGC 2194 | ||
| distance modulus | = | |
| i.e. distance | = | |
| reddening | = | |
| age | = | |
| i.e. | = | |
| metallicity | = | |
3.3 Initial mass function
The determination of the IMF slope from the completeness corrected data obtained from the CMD (Fig. 10) leads to the value of for NGC 1960 in a mass interval from down to (corresponding to to ). This restriction was chosen to guarantee a completeness of the photometry of at least 60 %. To test the stability of the IMF concerning the probable double star nature of several objects, we assumed the stars above the brighter part of the main sequence (a total of 18 objects) to be unresolved binary stars with a mass ratio of 1 and computed the IMF of this modified sample, as well. The slope increased to the value of within the same mass range, representing a slightly shallower IMF. Anyway, the influence of a binary main sequence is negligible within the errors. We also experimented with leaving out the magnitude range critical for membership determination (see Sect. 3.1 and Fig. 7), i.e. the stars brighter than (), and derived — a result which coincides well within the errors with the above ones. This shows once more that the membership determination — and therefore the IMF — was almost not affected by the magnitude term of our proper motion study. Fig. 12 sketches the IMF of NGC 1960.


4 NGC 2194
4.1 Proper motion study
For stars brighter than , some of the plates of NGC 2194 showed a systematic shift of the computed positions with respect to the ACT values. We therefore excluded all those stars from our input catalogue. However, this effect — which is different from the one described before for NGC 1960, since it perceptibly affects the positions — does not influence our membership determination as the region of NGC 2194 does not cover any stars of this brightness (see also Table 3).
Proper motions of 2,233 stars could be computed from the plates of NGC 2194. This figure is significantly higher than for NGC 1960, since this time the second epoch plates are of much higher quality, so that we reach fainter stars over the entire field. After four iterations of our proper motion determination, the systematic difference between ACT and our results were for the positions and for the proper motions. The standard deviation of the proper motions were and . The vector point plot diagram (Fig. 13) of the stars in the region of NGC 2194 shows that the stars are not as highly concentrated in the centre of the distribution of the cluster stars as for NGC 1960. This also explains the less distinct peak for high membership probabilities in the histogram shown in Fig. 9.
Although one finds more stars on the whole plates, in the inner region the proper motions of fewer objects were detected. This is caused by the lower number of sufficiently bright stars in and around the cluster (see Figs. 2 and 4). On the other hand, the low part of the main sequence is much more densely populated. We will see in Sect. 4.2 that the total number of members detected is higher for NGC 2194 than for NGC 1960.
We classified 149 members and 81 non-members. For this cluster, the separation between members and non-members was even more difficult as can be seen from the membership probability histogram plotted in Fig. 9: Approximately 50 stars show intermediate membership probabilities between 0.2 and 0.8. The result for the absolute proper motion of the cluster is
| (13) | |||||
| (14) |
and for the field
| (15) | |||||
| (16) |
The measured standard deviation of the cluster proper motion distribution again is the same as was determined for one individual object.
Table 9 shows a list of all proper motions computed.
| No. | del Rio | ||||
|---|---|---|---|---|---|
| No. | [hhmmss.sss] | [ ] | [mas yr-1] | ||

4.2 Colour magnitude diagram properties
According to the field star subtracted CMD, presented as Fig. 14, NGC 2194 shows a prominent main sequence with a turn-off point near and a sparsely populated red giant branch. For this cluster, the proper motion study is not of great value for the isochrone fitting process: As the main sequence turn-off is located around , it is clear that the bright blue stars either do not belong to the cluster or do not help in finding the best isochrone fit because of their non-standard evolution like blue stragglers (see, e.g., Stryker stryker (1993)). We assume that the presence of the blue bright stars is mainly caused by the coincidence of the field and cluster proper motion centres which causes a certain number of fields stars to be mis-identified as cluster members. As expected in Sect. 4.1, this effect is more dramatic here than in the case of NGC 1960. From the comarison of the isochrones we derived the parameters for NGC 2194 given in Table 8.


Star No. 38 of our sample was first mentioned by del Rio (delrio (1980), star 160 therein) who considers this object a field star as a consequence of its location in the CMD. For the same reason, but with the opposite conclusion, Ahumada & Lapasset (bluestrag (1995)) mention this object as a cluster member in their “Catalogue of blue stragglers in open star clusters”. We find for this star a proper motion of and leading to a membership probability of 0.34. Therefore, we agree with del Rio and assume star 38 to be a field star, too. So far, no further information is known about the bright blue stars in Fig. 14, so that we cannot give any definite statement about the nature of these objects.
4.3 Initial mass function
The age of NGC 2194 of Myr — together with its distance of almost kpc — implies that the range of the observable main sequence is very limited. We therefore could compute the IMF only over the mass interval from (corresponding to ) to (or ). The slope determined is . The comparably higher error is a consequence of the smaller mass interval.
Comparing the resulting IMF with a histogram (see Fig. 16), one finds good agreement for three of the four bins (The bin width is the same as for NGC 1960). As the completeness drops rapidly within the leftmost bin, it has — in total — a high uncertainty. However, only stars with masses of (corresponding to a completeness of higher than 60%) were taken into consideration for the IMF computation, which is indicated by the limits of the IMF line in Fig. 16.
Note that as a consequence of the age of NGC 2194, the cluster may have encountered dynamical evolution during its lifetime, which has to be kept in mind when using the term “initial mass function”. However, we follow Scalo’s (scalo1 (1986)) nomenclature, who uses the expression for intermediate age clusters, to discriminate between a mass function based on the initial and the present day stellar masses.

5 Summary and discussion
With our work we found NGC 1960 to be a young open star cluster with an age of 16 Myr. It is located at a distance of 1300 pc from the Sun. These results confirm the findings of Barkhatova et al. (barkhatova (1985)) obtained with photographic photometry.
We derived proper motions of 404 stars in the region of the cluster down to . 178 of those can be considered members of NGC 1960. Despite the problems with our proper motion determination (see Sect. 3.1), we are able to state that our results do not support the values given as the absolute proper motion of NGC 1960 by Glushkova et al. (glush (1997)) on the base of the “Four Million Star Catalog” (Gulyaev & Nesterov 4M (1992)): They found which is in agreement with our study, but which differs from our result by more than .
Our study of the IMF of NGC 1960 led to a power law with a slope of . This value is very high (i.e. the IMF is shallow) compared to other studies, however, it still matches the interval for suggested by Scalo (scalo2 (1998)) for intermediate mass stars ().
Although we should stress that we cannot say anything about the shape of the IMF in the very low mass range (), we do not see any evidence for a flattening of the IMF of NGC 1960 below .
NGC 2194 — with an age of 550 Myr — belongs to the intermediate age galactic open star clusters. Our findings from the photometric study are in good agreement with the photographic photometry published by del Rio (delrio (1980)).
As the cluster is located at a distance of almost 3 kpc we could only cover its mass spectrum down to . Nevertheless, we were able to determine the IMF on the base of 623 main sequence stars which led to a slope of , almost Salpeter’s (salpeter (1955)) value, but still close to the shallow end of the interval given by Scalo (scalo2 (1998)).
In our previous paper (Sanner et al. n0581paper (1999)), we studied the open star cluster NGC 581 (M 103) for which we found the same age of Myr as for NGC 1960, but a much steeper IMF slope of . We therefore can state that our method of IMF determination does not systematically lead to steep or shallow mass functions.
With our yet very small sample, it is not possible to find evidence for the dependence of the IMF of open star clusters on any parameter of the cluster. Therefore, we will have to investigate further clusters and also compare our results with other studies.
Acknowledgements.
The authors thank Wilhelm Seggewiss for allocating observing time at the telescopes of Hoher List Observatory, Santi Cassisi for providing the isochrones necessary for our study and Andrea Dieball and Klaas S. de Boer for carefully reading the manuscript. J.S. thanks Georg Drenkhahn for his valuable hints concerning the maximum likelihood analysis software. M.A. and J.B. acknowledge financial support from the Deutsche Forschungsgemeinschaft under grants Bo 779/21 and ME 1350/3-2, respectively. This research has made use of NASA’s Astrophysics Data System Bibliographic Services, the CDS data archive in Strasbourg, France, and J.-C. Mermilliod’s WEBDA database of open star clusters.References
- (1) Abt H.A., 1979, AJ 84, 1591
- (2) Ahumada J., Lapasset E., 1995, A&AS 109, 375
- (3) Barkhatova K.A., Zakharova P.E., Shashkina L.P., Orekhova L.K., 1985, AZh 62, 854
- (4) Bertelli G., Bressan A., Chiosi C., Fagotto F., Nasi E., 1994, A&AS 106, 275
- (5) Boden E., 1951, Uppsala Ann. 3, 1
- (6) Bono G., Caputo F., Cassisi S., Castellani V, Marconi M., 1997, ApJ 479, 279
- (7) Brunzendorf J., Meusinger H., 1998, Astrometric properties of the Tautenburg Plate Scanner. In: Brosche P., Dick W.R., Schwarz O. et al. (eds.) The Message of the Angles — Astrometry from 1798 to 1998. Verlag Harri Deutsch, Thun, Frankfurt a.M., p. 148
- (8) Brunzendorf J., Meusinger H., 1999, A&AS 139,141
- (9) Chian B., Zhu G., 1966, Ann. Shesan Sect. of Shanghai Obs. 26, 63
- (10) del Rio G., 1980, A&AS 42, 189
- (11) Dieball A., Grebel E.K., 1998, A&A 339, 773
- (12) ESA, 1997, The HIPPARCOS and Tycho Catalogues, ESA SP–1200
- (13) Geffert M., Klemola A.R., Hiesgen M., Schmoll J., 1997, A&AS 124, 157
- (14) Glushkova E.V., Zabolotskikh M.V., Rastorguev A.S., Uglova I.M., Fedorova A.A., 1997, PAZh 23, 90
- (15) Gulyaev A.P., Nesterov V.V., 1992, On the four-million star catalog, Izd. Mos. Gos. Univ.
- (16) Iben I., 1965, ApJ 141, 993
- (17) Johnson H.L., Morgan W.W., 1953, ApJ 117, 313
- (18) Landolt A.U., 1992, AJ 104, 340
- (19) Lyngå G., 1987, Catalog of open cluster data, edition
- (20) Meurers J., 1958 , Z. Astrophys. 44, 203
- (21) Mermilliod J.-C., 1999, WEBDA: Access to the Open Cluster Database. In: R. Rebolo (ed.) Very Low-Mass Stars and Brown Dwarfs. Cambridge Univ. Press, Cambridge (in press)
- (22) Raboud D., Mermilliod J.-C., 1998, A&A 333, 897
- (23) Reif K., de Boer K.S., Mebold U. et al., 1995, AG Abstr. Ser. 11, 42
- (24) Röser S., Morrison J., Bucciarelli B., Lasker B., McLean B., 1998, Contents, Test Results, and Data Availability for GSC 1.2. In: McLean B., Golombek D.A., Hayes J.J.E., Payne H.E. (eds.) Proc. IAU Symp. 179, New Horizons from Multi-Wavelength Sky Surveys. Kluver, Dordrecht, p. 420
- (25) Sagar R., Richtler T., 1991, A&A 250, 324
- (26) Salpeter E.E., 1955, ApJ 121, 161
- (27) Sanders W.L., 1971, A&A 14, 226
- (28) Sanner J., Dieball A., Schmoll J., Reif K., Geffert M., 1998, HoLiCam — A new device for astrometry. In: López García A., Yagudin L., Martínez Usó M. et al. (eds.) IV International Workshop on Positional Astronomy and Celestial Mechanics. Observatorio Astronómico de la Universitat de Valéncia, Valéncia, p. 373
- (29) Sanner J., Geffert M., Brunzendorf J., Schmoll J., 1999, A&A 349, 448
- (30) Scalo J.M., 1986, Fund. Cosm. Phys. 11, 1
- (31) Scalo J.M., 1998, The IMF revisited — A case for variations. In: Gilmore G., Howell D. (eds.) ASP Conf. Series 142. ASP, San Francisco, p. 201
- (32) Schaller G., Schaerer D., Meynet G., Maeder A., 1992, A&AS 96, 269
- (33) Slettebak A., 1985, ApJS 59, 769
- (34) Stetson P.B., 1991, Initial experiments with DAOPHOT II and WFC images. In: Grosbøl P.J., Warmels R.H. (eds.) ESO/ST-ECF Garching Data Analysis Workshop. ESO, Garching , p. 187
- (35) Stryker L.L., 1993, PASP 105, 1081
- (36) Tarrab I., 1982, A&A 109, 285
- (37) Tsujimoto T., Yoshii Y., Nomoto K. et al., 1997, ApJ 483, 228
- (38) Tucholke H.-J., 1992, A&AS 93, 293
- (39) Urban S.E., Corbin T.E., Wycoff G.L., 1998, AJ 115, 2161
- (40) van Leeuwen F., 1985, Proper Motion Studies of Stars in and Around Open Clusters. In: Goodman J., Hut P. (eds.) Proc. IAU Symp. 113, Dynamics of star clusters. Reidel, Dordrecht, p. 579
- (41) Wielen R., Dettbarn C., Jahreiß H., Lenhardt H., Schwan, H., 1999, A&A 346, 675
- (42) Zorec J., Briot D., 1991, A&A 245, 150