Fourier power spectra at high frequencies: a way to distinguish a neutron star from a black hole
Abstract
We analyzed the power density spectra of a sample of 9 neutron star and 9 black hole binaries in the low/hard spectral state. In the power density spectra of accreting neutron stars with a weak magnetic field a significant power is contained at frequencies close to one kHz. At the same time, most Galactic accreting black holes demonstrate a strong decline in the power spectra at the frequencies higher than 10–50 Hz. We propose to use this empirical fact as a method to distinguish the accreting neutron stars from black holes in X-ray transients. The X-ray transients that demonstrate significant noise in their X-ray flux at frequencies above Hz should be considered neutron stars. We propose to explain the observed difference as a result of the existence of a radiation dominated spreading layer on the neutron star surface (Inogamov& Sunyaev 1999). The possible very high frequency variabilities of this layer are discussed.
Key Words.:
Accretion, accretion disks – Instabilities – Stars:binaries:general – Stars:fundamental parameters – Stars:neutron – X-rays: general – X-rays: stars1 Introduction
Among the Galactic X-ray sources black holes (BH) distinguish themselves by the shape of their X-ray spectrum (see e.g. Tananbaum et al. (1972), Sunyaev & Truemper (1979), White, Kaluziensky & Swank (1984), Tanaka & Shibazaki (1996)). In the low spectral state BHs emit a significant part of their luminosity at energies of hundreds keV (see e.g. Sunyaev et al. (1991)), while neutron stars (NS) radiate much smaller part of their total luminosity in this energy range (see e.g. Barret et al. (2000)). A soft component that is present in the spectra of BH binaries in the high(soft) state has a characteristic temperature which can be significantly lower than that in the spectra of NS binaries with similar luminosity. Besides, the BH binaries in this soft spectral state demonstrate a hard power law tail (likely without a high energy cutoff up to 500-600 keV, see e.g. Sunyaev et al. 1988, 1992; Kroeger et al. (1996)), whereas bright accreting NSs have never yet shown such spectra (e.g. Tanaka & Shibazaki (1996)). These spectral properties were frequently used as a criterion to determine the nature of the compact object. We will not discuss here the widely accepted methods of establishing neutron star systems through the presence of pulsations or X-ray bursts. The detection of coherent pulsations indicates the presence of the strong magnetic field and rotation of the NS. X-ray bursts (type I) demonstrate that nuclear explosions occur in the matter that was collected at the surface of the NS during the accretion. However there is a significant number of sources, mostly transients, for which neither X-ray pulsations nor X-ray bursts have been observed. Below we propose another method of determining the nature of the compact object based on its power density spectrum (PDS) at the high frequencies f10–100 Hz.
2 Observations and data analysis
| Source | Proposal | Dates | Ref. |
|---|---|---|---|
| Neutron Stars | |||
| GX 354-0∗ | P10073 | Feb. 22- Mar.1, 1996 | |
| /low state/ | |||
| GX 354-0∗ | P10073 | Feb.15, 1996 | |
| /high state/ | |||
| 4U0614+091 | P30056 | Mar. 13-20, 1998 | 1 |
| 4U1608-522 | P30062 | Mar.31-Apr.2, 1998 | |
| /low state/ | |||
| 4U1608-522 | P30062 | Mar.24-27, 1998 | |
| /high state/ | |||
| SAX J1808.4–3658 | P30411 | Apr., 1998 | 2 |
| 1E1724–3045/Ter2∗ | P10090 | Nov.5-8, 1996 | 3 |
| GS 1826–24 | P30054 | Feb.-June 1998 | |
| 4U1705–44 | P20073 | Apr.1, 1997 | |
| SLX 1735–269 | P20170 | Feb.- | 4 |
| P20089 | -Oct. 1997 | ||
| KS 1731–260 | P30061 | 2-6 Oct. 1998 | 5 |
| Cyg X-2 | P30418 | 2-6 July 1998 | |
| Black Holes | |||
| Cyg X-1∗ | P30157 | Dec.1997-Feb.1998 | |
| GX 339-4 | P20183 | 1997 | 6 |
| GS 1354–644 | P20431 | Nov.19-22 | 7 |
| GRS 1915+105 | P20402 | Feb.9, 1997 | 8 |
| GRO J1655–40 | P20402 | Aug.14, 1997 | 9 |
| 4U1630-47 | P30172 | May-Jun.1998 | 10 |
| XTE J1748–288 | July 1998 | 11 | |
| GRS 1758-258 | P10231 | 1996- | 12 |
| P10232 | -1998 | ||
| P20166 | |||
| P30149 | |||
| 1E1740.7-2942 | P10231 | 1996- | 12 |
| P10232 | -1998 | ||
| P20166 | |||
| P30149 | |||
-
∗
– the data from these observations were also used for analysis of the radiation spectra
-
– [1] –Ford et al. (1997), [2] – Wijnands& van der Klis (1998), [3] – Olive et al. (1999), [4] – Wijnands& van der Klis 1999a , [5] – Muno et al. (2000), [6] – Nowak, Wilms & Dove (1999), [7] – Revnivtsev et al. (2000), [8] – Trudolyubov, Churazov& Gilfanov (1999), [9] – Remillard et al. (1999), [10] – Tomsick & Kaaret (2000), [11] – Revnivtsev, Trudolyubov & Borozdin 2000b , [12] – Main et al. (1999)

.
We used the publicly available data of the Proportional Counter Array (PCA) aboard the Rossi X-ray Timing Explorer (RXTE) obtained in 1996–1998. We chose the observations of X-ray binaries in the low/hard spectral state with , where is the critical Eddington luminosity, made in 1996-1998. We only used the data when all 5 Proportional Counter Units (PCUs) were operational. The count rates for the sources vary from a few hundreds counts/sec/PCA to several thousands counts/sec/PCA for both NS and BH sources. Our sample of NS and BH binaries is presented in Table 1.
We constructed the power density spectra of the X-ray sources using 244 sec ( sec) time resolution light curves divided into parts containing 8192 bins. The obtained PDSs were normalized to the square of fractional variability (e.g. Miyamoto et al. (1991)) and the ideal Poissonian noise component () was subtracted from them. Then the obtained PDSs were averaged. Fractional rms normalization is very useful for our purposes because it has counting statistics noise component, with a deviation from the ideal Poisson level () which is fairly independent of a source count rate (see Eq. [1]). To subtract the real (not ideal) noise component due to the counting statistics from our PDSs we used the stationary Poissonian noise component level, modified by the deadtime effects described in the papers of Vikhlinin, Churazov & Gilfanov (1994), Zhang et al. (1995), Zhang et al. (1996) and successfully tested in e.g. Morgan, Greiner & Remillard (1997), Nowak et al. (1999) and Jernigan, Klein & Arons (2000).
The explicit form of the used frequency dependent counting statistics noise component, modified by deadtime effects appears as follows:
| (1) | |||||
here – the frequency; – total (in our case – for 5 PCUs) count rate of the source in the energy band of our interest; – count rate of the source in one PCU in energy band of our interest, in our case ; – count rate of Very Large Events (VLE) in one PCU; – deadtime value for any detected event, 9–10 (e.g. Jahoda et al. (1996), Jahoda et al. (1997)); – VLE preset window, (level 1) or (level 2) (see Giles (1995)); – time binning in our light curves (); – is the number of bins in the single light curve segment ( in our case); – is the dimensionless parameter (very close to 1.0) that was introduced to roughly take into account that the deadtime corrections for each PCU can be not strictly identical and the model assumption of stationary Poissonian process for the observed light curve is not exactly valid. But in reality value is very close, within a few %, to 1.0. The closeness of to 1.0 can be the indication that all used model parameters like and are close to the real ones.
Following the conservative approach adopted in Jernigan, Klein & Arons (2000) we fitted our PDSs at the highest frequencies ( Hz for NSs and Hz for BHs) with the model for the white noise component (Eq. [1] without the first term, which was already subtracted) and the model for the source itself, leaving the deadtime model normalization parameters and free. We used the simplest power law model for the intrinsic variability of the sources. The deduced white noise parameters and were always consistent with the anticipated ones: (within a few %) and cnts/s/PCU. In the cases when the (VLE count rate) parameter was very poorly constrained (has large statistical errors) we have it frozen at the values determined from Standard_1 mode data. This conservative approach helps us to subtract most of the PDS components that are not real components of the observed target. However, if the power spectrum of the observed source has weak and very flat noise at frequencies of 500–2000 Hz it might be treated as a noise component and will not be detected. In general, the used approach for the deadtime modeling still has some uncertainties such as the exact value of the deadtime for the photons , the stability of the VLE window and so on. Therefore we believe that our PDSs still suffer from a small systematic uncertainty of the order of few (a few percent of ) in units of squared rms.
Since we were mainly interested in the high frequency continuum of the PDSs we paid special attention to all the known timing features of the PCA instrument (see e.g. PCA Group Internet Homepage http://lheawww.gsfc.nasa.gov/docs/xray/xte/pca). Apart from carefully estimating the deadtime modification of the Poissonian level in our PDSs, we ignored PCA channels 0–7 in all the analyzed data to avoid background events variability (PCA Group Internet Homepage; E. Morgan, private communication; see also Jernigan, Klein & Arons (2000)) that is especially important for a weak NS sources like SLX 1735–269 and for black holes because of their low intrinsic variability at high frequencies.
To complete our power spectra with the low frequency part ( Hz) we used Standard_1 mode data (0.125 sec time resolution). After the above procedure the power density spectra were renormalized to units of squared relative rms multiplied by frequency. This helps to better visualize the distribution of the power over the Fourier frequencies (e.g. Belloni et al. (1997)).
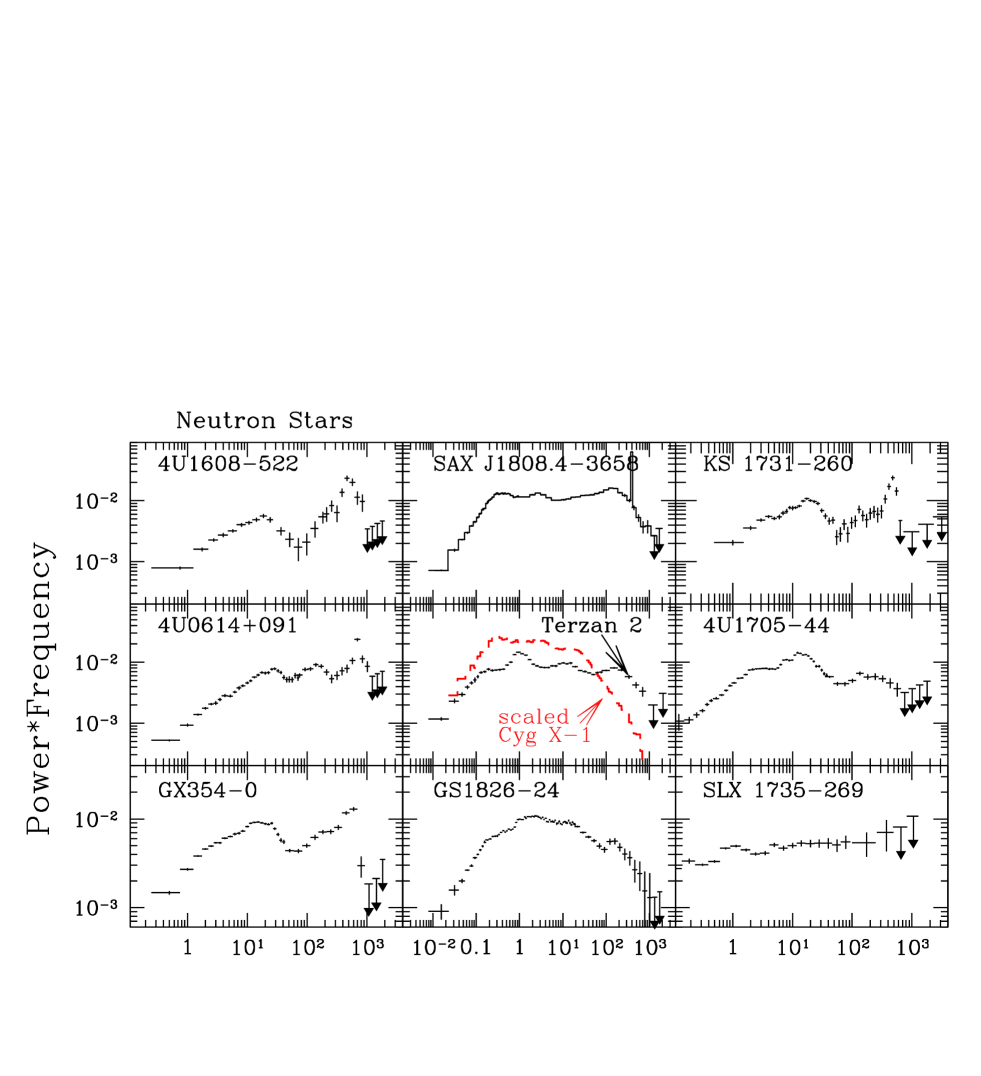
In Fig. 1 we present the power density spectra of 18 sources with subtracted frequency dependent white noise level obtained with the described procedure.
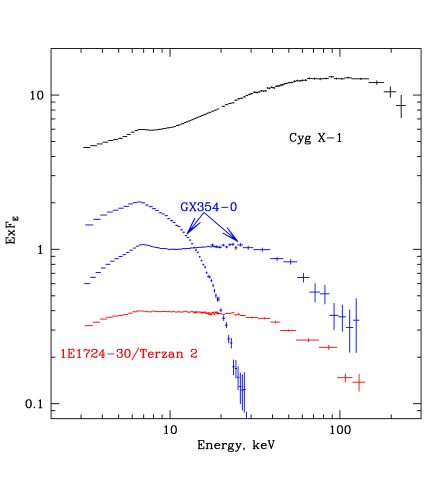
We will present below a comparison of the radiation spectra of Cyg X-1 and two NSs (Terzan2/1E1724-3045 and GX354-0). To get them we used the same RXTE data as for the timing analysis (see Table 1). The reduction of RXTE/PCA and RXTE/HEXTE data was done using standard FTOOLS 4.2 tasks and the methods recommended by RXTE Guest Observer Facility.
3 Results
In Fig. 1 (upper part of plots) we present the obtained power density spectra of nine X-ray bursters in the low/hard spectral state. For all of these sources the nature of the compact object is known – a NS with a weak magnetic field. In the lower part of Fig. 1 we present the power density spectra for nine BH candidates. For two of them (namely Cyg X-1, e.g. Gies & Bolton (1986) and GRO J1655-40, e.g. Shahbaz et al. (1999)) we have the mass determinations which indicate that these sources can not be NSs. The other sources are believed to be black hole binaries based on their spectral properties.
One can see the striking similarity between the PDSs of the NS binaries and BH candidates in the low spectral state up to 10 Hz, which was already stated in the literature (see e.g. Wijnands& van der Klis 1999b , Psaltis, Belloni & van der Klis (1999), Barret et al. (2000)). However, when we look at the high frequency part of the power spectra (10–100 Hz) we notice that even in the absence of kHz quasiperiodic oscillations (QPOs) there is a dramatic difference between these two samples. The PDSs of NS binaries have significant broad noise components at the frequencies 500-1000 Hz, sometimes together with well known kHz QPOs. The power density spectra of the BH binaries in the low spectral state (the typical state for Cyg X-1) rapidly decrease at frequencies above 10 Hz and become by one–two orders of magnitude lower than those of the NSs in the same frequency band. The low frequency parts of the PDSs probably scale with the compact object mass (see e.g. Wijnands& van der Klis 1999b or Fig. 1). However, it is likely that the high frequency part of the PDSs of neutron stars demonstrates the additional noise component, see Fig. 1).
The observed empirical fact described above allows us to propose a new method for establishing the nature of the compact object in bright transient X-ray sources which appear a few times a year in the X-ray sky. We propose to classify sources whose PDS extends up to several hundred Hz without a strong decline (in coordinates “ vs. ”) as NSs with a weak magnetic field even if the kHz QPO components are not detected in the PDS.
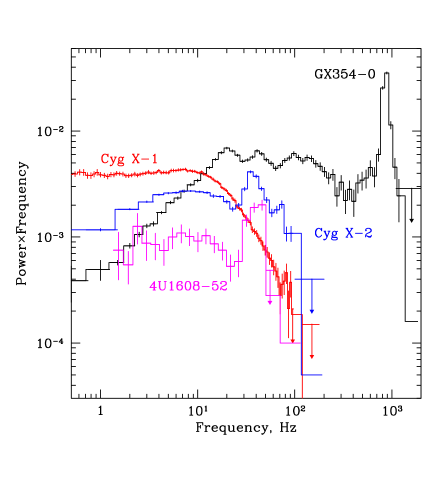
We understand that the sample of sources used in our analysis is not overwhelming. Moreover, the same X-ray sources in the high spectral state usually demonstrate power spectra, that may significantly differ (see Fig. 2) from each other and from the low state PDS shown in Fig.1. In other words, the NS systems in the high/soft spectral state could demonstrate the absence of significant variability at high frequencies. Therefore the absence of high frequency variability can not be the reason to state that the source is a black hole candidate. However, we propose that any source that does demonstrate significant variability (continuum or QPO) at frequencies close to 1 kHz should be considered NS. Note that for four of the nine X-ray bursters represented in Fig. 1, kHz QPOs have not yet been observed.
4 On the nature of the difference in PDS
The fate of accreting matter is very different in the case of accretion onto a BH and NS with a small magnetic field. In the case of an accreting black hole all the observed radiation forms in an accretion disk, its corona or in an advection flow. In the case of a neutron star with a weak magnetic field a significant part of the total gravitational energy should be released in the boundary layer (e.g. Shakura&Sunyaev (1988), Popham & Sunyaev (2000)) or in a layer of spreading matter on the surface of the NS (Inogamov&Sunyaev (1999)). Approximately 2/3 of the total energy releases close to the star surface in the case of Schwarzschild geometry, see Sunyaev&Shakura (1986). Only about 1/3 of the total energy is released in the extended accretion disk. If the neutron star rotates rapidly these values change somewhat and the accretion disk contribution increases (see e.g. Sibgatullin&Sunyaev (1998)). The surface of the NS is an additional source of soft photons for Comptonization. This might be the reason why the spectra of black holes in the low/hard spectral state are generally harder than the spectra of NSs (e.g. Sunyaev&Titarchuk (1989), Sunyaev et al. (1991), Churazov et al. (1997), see also Fig. 3).
4.1 The instabilities originated in the accretion disk
In the standard accretion disk, the region of the main energy release is a resonator for acoustic and other instabilities with maximal frequencies close to , here – the height of the accretion disk, – is the speed of sound, – Keplerian frequency. In the case of accretion on the BH with slow rotation the region of the main energy release extends from to , here . For the heights and there should be a maximal frequency Hz. Secular (Lightman & Eardley 1974) and thermal (Shakura& Sunyaev 1976) instabilities may develop in the standard accretion disk but only in the region where the radiation pressure exceeds that of matter. The characteristic time scales of these instabilities are considerably longer (, where 0.01-1 is the viscosity parameter, see Shakura&Sunyaev (1973)) than the sound oscillation time scales mentioned above. One can anticipate that the Velikhov-Chandrasekhar magnetorotational instability (Balbus & Hawley (1991)) could also result in the accretion disk variations on the time scales exceeding the orbital time. An analysis of the disk turbulence (e.g. Nowak& Wagoner (1995)) showed that a strong rollover above 100 Hz should present in the power spectra of an accretion disk. The phenomenological shot noise model (see e.g. Terrel (1972), Lochner, Swank & Szymkowiak (1991)) and the model of coronal energy release variations (e.g. Poutanen & Fabian (1999)) consider the similar absence of strong variability at frequencies higher than 100 Hz. The advection dominated accretion flow (e.g. Ichimaru (1977), Narayan & Yi (1994)) are not subject to the thermal instability mentioned above. In spite of the absence of detailed studies of different instabilities for the advection flows it seems quite reasonable to assume that a limit of the order of may be valid in this case as well. Rapid BH rotation can lead to increased frequency values, but in this case the rotation parameter should be pretty close to the critical value 1. If the influence of the black hole rotation is small.
All instabilities existing in the accretion disk modulate the flow of matter onto the NS surface. Therefore, we could expect that the majority of the types of variabilities we observe in accreting BHs must manifest themselves in accreting NSs with characteristic times proportional to the mass of the accreting object (see e.g. Shakura&Sunyaev (1976), Wijnands& van der Klis 1999b , Inogamov&Sunyaev (2000)). However, in the BH systems the innermost regions of the accretion disk can generate the variability at its Keplerian frequencies (close to 100–200 Hz), but their contribution to the observed PDS can be small because of the decrease of the energy release close to the last stable orbit (e.g. Shakura&Sunyaev (1973)). In the NS case, where the boundary layer can possess all accretion disk frequencies, this variability could be more pronounced.
The simplest assumption is that the characteristics frequencies in the power spectra of the sources scale as . This scaling law is valid for e.g. Keplerian frequency in the vicinity of the last stable orbit, thermal and secular instabilities of the accretion disk in the region of main energy release, Balbus–Hawley instability. However, this assumption is not enough to account for the observed difference in the high frequency variability of the NSs and the BHs. To demonstrate this we compared the PDS of the neutron star system Terzan2/1E1724–3045 () with times scaled PDS of black hole system Cyg X-1 () (Fig. 1 and 4). It is obvious that such a scaling is important but insufficient to explain the high frequency variability of Terzan2. It is most likely that there is an additional component coming from the neutron star surface or boundary layer in its vicinity.

4.2 The spreading layer and the highest possible frequencies in the PDS of NSs
The inner boundaries of accretion disks around BHs and neutron stars lie at similar radii measured in the values of the gravitational radii of the central object. However, we expect a small energy release from the region with the radius smaller than the inner boundary of the accretion disk around a BH. In the case of NS accretion there is a solid surface and the matter should finally join this surface. We know this because of the existence of X-ray bursters. In accretion disks matter rotates with Keplerian velocity. The velocity of the surface of the NS is 6–3 times lower (see e.g. Strohmayer (1999) or van der Klis (2000) for reviews). Therefore matter must decelerate and release its kinetic energy in the narrow spreading layer on the surface of the NS. In the case of very low luminosities, less than 0.01 (where if the critical Eddington luminosity) all deceleration occurs in the narrow boundary layer between the innermost region of the accretion disk and the surface of the NS. We could consider this layer an atmosphere in which accreting matter is losing its kinetic energy and radiating it away (see e.g. Shakura&Sunyaev (1988)). At luminosities above 0.01 the radiation pressure does not permit such a simple picture. Matter rotates around a NS and slowly spirals up the meridian toward higher latitudes. In this flow the centrifugal force and the radiation pressure force balance gravitation with very high precision. Effective gravity (the difference between the gravitational force, centrifugal force and radiation pressure force) becomes hundreds of times smaller than the gravitational force. The turbulent friction with underlying denser layers rotating with the surface velocity of the star leads to the deceleration of the flow and energy release which is radiated away. This approach predicts the existence of two broad bright belts equidistant from the star equator. These belts are fed partially with the advection of thermal energy from the regions closer to the equator (Inogamov&Sunyaev (1999)). The luminosity of these bright belts exceeds the luminosity of the accretion disk.
The spreading layer may be considered a thin broad box. The flow along the latitude has Keplerian velocity in the vicinity of the equator and slowly decelerates to higher latitudes. This velocity is close to a hundred thousand kilometers per second. The sound velocity within the radiation dominated box is of the order of 20 000 km/sec. The highest sound frequencies inside the box are of the order of and might reach even 40 kHz in the case of low luminosities and 6-7 kHz in the case of luminosity close to the (Inogamov&Sunyaev (2000)), here is the thickness of the spreading layer. Simple consideration shows that we could expect a lot of turbulence generated sound, resonant sound waves and plasma instabilities with characteristic frequencies that do not end at the Keplerian frequencies, but can reach several kilohertz. The sound waves of much lower frequencies might also exist in the bright belts: one can estimate the characteristic frequencies Hz for the waves propagating along the latitude and a few kHz (where – is the angular width of the bright belts) for the waves propagating along the meridian within the belts.
As well as we expect the Keplerian frequency on the last stable orbit (Hz for ) to be the maximal possible frequency for the BH variability in X-rays, 40 kHz and 7 kHz mentioned above might be the the maximal frequencies for the NSs PDS. In both cases (for BHs and NSs) the power spectra should drop sufficiently towards these frequencies, but might be high below them.
In the spreading layer we have very strong shear in the flows along the longitude. Under such circumstances the long living whirls like those of thyphoons, Jupiter red spot or “cats eyes” due to Kelvin-Helmholtz instability might regularly appear. The evolution of the chaotic magnetic field structure inflowing into the spreading layer through the neck of the accretion disk (region with ) may produce bright spots in the spreading layer. The accretion disk screens from us half of the star, making it completely unobservable. Part of the star surface is not visible due to eclipses by the star itself at any inclination angle except close to 0. The rotation of the bright spots leads to their regular eclipses. The duration of these eclipses is close to half of the period of the matter rotation in the spreading layer. The quasi regular eclipses (the velocity of the bright spot can slowly change) can also give rise to the additional variability (noise) of X-rays from the NS at frequencies of hundreds of Hz.
There are many different mechanisms of instabilities in the narrow (with heights from 400 m up to 1.5 km depending on the accretion rate or luminosity), thin spreading layer. Unfortunately, at the present level of sensitivity of RXTE we can not see a significant variability of the sources at the frequencies above 2–4 kHz. It is likely, that future missions with higher collecting area of the detectors can shed light on the very high frequency ( kHz) variability phenomena.
Acknowledgements.
Authors thank Nail Inogamov, Marat Gilfanov, Eugene Churazov and Sergei Sazonov for helpful discussions. Also authors thank the referee, Michiel van der Klis, whose comments helped us to improve the paper. This research has made use of data obtained through the High Energy Astrophysics Science Archive Research Center Online Service, provided by the NASA/Goddard Space Flight Center. The work has been supported in part by RFBR grants RFFI 97-02-16264 and RFFI 00-15-96649.References
- Balbus & Hawley (1991) Balbus S., Hawley J. 1991, ApJ 376, 214
- Barret et al. (2000) Barret D., Olive J.F., Boirin L. et al. 2000, ApJ accepted, see astro-ph/9911042
- Belloni et al. (1997) Belloni T., van der Klis M., Lewin W.H.G. et al. 1997, ApJ 322, 857
- Ford et al. (1997) Ford E., Kaaret, P., Tavani, M. et al. 1997, ApJ 475, L123
- Churazov et al. (1997) Churazov E., Gilfanov M. Sunyaev R. et al. 1997, Ad.Sp.R. 19, 55
- Gies & Bolton (1986) Gies D., Bolton C. 1986, ApJ 304, 371
- Giles (1995) Giles B. 1995, PCA Housekeeping (Sec.15) http:// lheawww.gsfc.nasa.gov/docs/xray/xte/pca/document.html
- Gilfanov et al. (1998) Gilfanov M., Revnivtsev M., Sunyaev R., Churazov E. 1998, A&A 338, L83
- Ichimaru (1977) Ichimaru S. 1977, ApJ 214, 840
- Inogamov&Sunyaev (1999) Inogamov N., Sunyaev R. 1999, Astr. Lett. 25, 269, see also astro-ph/9904333
- Inogamov&Sunyaev (2000) Inogamov N., Sunyaev R. 2000, Astr.Lett. (in press)
- Jahoda et al. (1996) Jahoda K., Swank J., Giles A. et al. 1996, in Proc. SPIE 2808, 59
- Jahoda et al. (1997) Jahoda K., Stark M., Strohmayer T. et al. 1997, in Proc. of the Symposium ”The Active X-ray Sky”, astro-ph/9712340
- Jernigan, Klein & Arons (2000) Jernigan J.G., Klein R., Arons J. 2000, ApJ 530, 875
- Kroeger et al. (1996) Kroeger R., Strickman M., Grove J. et al. 1996, A&AS 120, 117
- Lochner, Swank & Szymkowiak (1991) Lochner J., Swank J., Szymkowiak A. 1991, ApJ 376, 295
- Lightman&Eardley (1974) Lightman A., Eardley D. 1974, ApJ 187, L1
- Main et al. (1999) Main D., Smith D., Heindl W. et al. 1999, ApJ 525, 901
- Miyamoto et al. (1991) Miyamoto S., Kimura K, Kitamoto S, Dotani T., Ebisawa K. 1991, ApJ 383, 784
- Morgan, Greiner & Remillard (1997) Morgan E., Remillard R., Greiner J. 1997, ApJ 482, 293
- Muno et al. (2000) Muno M., Fox D., Morgan E., Bildsten L. 2000, submitted to ApJ, astro-ph/0003229
- Narayan & Yi (1994) Narayan R., Yi I. 1994, ApJ 428, L13
- Nowak& Wagoner (1995) Nowak M., Wagoner R. 1995, MNRAS 274, 37
- Nowak et al. (1999) Nowak M., Vaughan B., Wilms J., Dove J., Begelman M. 1999, ApJ 510, 874
- Nowak, Wilms & Dove (1999) Nowak M., Wilms J., Dove J. 1999, ApJ 517, 355
- Olive et al. (1999) Olive, J.F., Barret, D., Boirin, L. et al. 1998, A&A 333, 942
- Popham & Sunyaev (2000) Popham R., Sunyaev R. 2000 ApJ submitted
- Poutanen & Fabian (1999) Poutanen J., Fabian A. 1999, MNRAS 306, 31L
- Psaltis, Belloni & van der Klis (1999) Psaltis D., Belloni T., van der Klis M. 1999, ApJ 520, 763
- Remillard et al. (1999) Remillard R., Morgan E., McClintock J., Bailyn C., Orosz J. 1999, ApJ 552, 397
- Revnivtsev et al. (2000) Revnivtsev M., Borozdin K., Priedhorsky W., Vikhlinin A. 2000, ApJ 530, 955
- (32) Revnivtsev M., Trudolyubov S., Borozdin K. 2000, MNRAS 312, 151
- Shahbaz et al. (1999) Shahbaz T., van der Hooft F., Casares J., Charles P., van Paradijs J. 1999, MNRAS 306, 89
- Shakura&Sunyaev (1973) Shakura N., Sunyaev R. 1973, A&A 24, 337
- Shakura&Sunyaev (1976) Shakura N., Sunyaev R. 1976, MNRAS 175, 613
- Shakura&Sunyaev (1988) Shakura N., Sunyaev R. 1988, Adv.Sp.Res. 8, 135
- Sibgatullin&Sunyaev (1998) Sibgatullin N., Sunyaev R. 1998, Astr. Lett. 1999, 24, 774, see also astro-ph/9811028
- Strohmayer (1999) Strohmayer T. 1999, in Proc. of “ X-ray Astronomy ’99, Stellar Endpoints, AGN and the Diffuse X-ray Background”, Bologna, Italy
- Sunyaev&Shakura (1986) Sunyaev R., Shakura N. 1986, Sv.Astr.Lett. 12, 117
- Sunyaev & Truemper (1979) Sunyaev R., Truemper J. 1979, Nat. 279, 506
- Sunyaev&Titarchuk (1989) Sunyaev R., Titarchuk L. 1989, in the Proceedings of 23rd ESLAB symposium, v.1, 627
- Sunyaev et al. (1988) Sunyaev R., Lapshov I., Grebenev S. et al. 1988, Sv.Astr.Lett. 14, 327
- Sunyaev et al. (1991) Sunyaev R., Churazov E., Gilfanov M. et al. 1991, A&A 247, L29
- Sunyaev et al. (1992) Sunyaev R., Churazov E., Gilfanov M., et al. 1992, ApJ 389, L75
- Tanaka & Shibazaki (1996) Tanaka Y., Shibazaki N. 1996, ARA&A 34, 607
- Tananbaum et al. (1972) Tananbaum H., Gursky H., Kellogg E., Giacconi R., Jones C. 1972, ApJ 177, L5
- Terrel (1972) Terrel N. 1972, ApJ 174, L35
- Tomsick & Kaaret (2000) Tomsick J., Kaaret P., ApJ 2000 accepted, astro-ph/0002084
- Trudolyubov, Churazov& Gilfanov (1999) Trudolyubov S., Churazov E., Gilfanov M. 1999, Astr. Lett. 25, 718
- van der Klis (2000) van der Klis M. 2000, ARA&A in press, see also astro-ph/0001167
- Vikhlinin, Churazov & Gilfanov (1994) Vikhlinin A., Churazov E., Gilfanov M. 1994, A&A 287, 73
- White, Kaluziensky & Swank (1984) White N., Kaluziensky L., Swank J. 1984, in High Energy Transients in Astrophysics, Santa Cruz, 31
- Wijnands& van der Klis (1998) Wijnands R., van der Klis M. 1998, ApJ 507, L63
- (54) Wijnands R., van der Klis M. 1999a, A&A 345, L35
- (55) Wijnands R., van der Klis M. 1999b, ApJ 514, 939
- Zhang et al. (1995) Zhang W., Jahoda K., Swank J., Morgan E., Giles A. 1995, ApJ 449, 930
- Zhang et al. (1996) Zhang W., Morgan E., Jahoda K. et al. 1996, ApJ 469, L29