2Institut d’Astrophysique de Paris – CNRS, 98bis Boulevard Arago, F-75014 Paris, France
3UA CNRS 173 – DAEC, Observatoire de Paris-Meudon, F-92195 Meudon Cedex, France
Physical conditions in broad and associated narrow absorption-line systems toward APM 08279+5255 ††thanks: Based on observations collected at the W.M. Keck Observatory, which is operated as a scientific partnership among the California Institute of Technology, the University of California and the National Aeronautics and Space Administration. The Observatory was made possible by the generous financial support of the W.M. Keck Foundation.
Abstract
Results of a careful analysis of the absorption systems with seen toward the bright, 3.91, gravitationally lensed quasar APM 08279+5255 are presented.
Two of the narrow-line systems, at = 3.8931 and = 3.9135, show absorptions from singly ionized species with weak or no N v and O vi absorptions at the same redshift. Absorption due to fine structure transitions of C ii and Si ii (excitation energies corresponding to, respectively, 156m and 34m) are detected at = 3.8931. Excitation by IR radiation is favored as the column density ratios are consistent with the shape of APM 08279+5255 IR spectrum. The low-ionization state of the system favors a picture where the cloud is closer to the IR source than to the UV source, supporting the idea that the extension of the IR source is larger than 200 pc. The absence of fine structure lines at = 3.9135 suggests that the gas responsible for this system is farther away from the IR source. Abundances are 0.01 and 1 at = 3.913 and 3.8931 and aluminum could be over-abundant with respect to silicon and carbon by at least a factor of two and five. All this suggests that whereas the = 3.8931 system is probably located within 200 pc from the QSO and ejected at a velocity larger than 1000 km s-1, the = 3.9135 system is farther away and part of the host-galaxy.
Several narrow-line systems have strong absorption lines due to C iv, O vi and N v and very low neutral hydrogen optical depths. This probably implies metallicities although firm conclusion cannot be drawn as the exact value depends strongly on the shape of the ionizing spectrum.
The C iv broad absorption has a complex structure with mini-BALs (width km s-1) and narrow components superposed on a continuous absorption of smaller optical depth. The continuous absorption is much stronger in O vi indicating that the corresponding gas-component is of higher ionization than the other components in the flow and that absorption structures in the BAL-flow are mainly due to density inhomogeneities. There is a tendency for mini-BALs to have different covering factors for different species. It is shown that a few of the absorbing clouds do not cover all the three QSO images, especially we conclude that the = 3.712 system covers only image C.
Finally we identify narrow components within the BAL-flow with velocity separations within 5 km s-1 of the O vi, N v and Si iv doublet splittings suggesting that line driven radiative acceleration is an important process to explain the out-flow.
Key Words.:
Galaxies: ISM, quasars:absorption lines, quasars: individual: APM 08279+5255, Galaxies: halo1 Introduction
The gravitationally lensed high-redshift Broad Absorption Line (BAL) QSO APM 08279+5255 has been given tremendous interest since its discovery by Irwin et al. (1998) as it is one of the most luminous objects in the universe even after correction for gravitational amplification. Based on the position of the emission lines, Irwin et al. (1998) derived a redshift = 3.87. A probably better estimate of the systematic redshift comes from the detection of CO(4–3) emission at = 3.91140.0003 by Downes et al. (1999).
Imaging of the field reveals two main components (Irwin et al. 1998, Ledoux et al. 1999) separated by 0.3780.001 arcsec as measured on HST/NICMOS data (Ibata et al. 1999) and of relative brightness = 0.7730.007. The HST images reveal the presence of a third object C with = 0.1750.008, located in between A and B and almost aligned with them. The PSF fits on the three objects are consistent with the three components being point-sources and the colors are similar within the uncertainties suggesting that C is a third image of the quasar (Ibata et al. 1999, Egami et al. 1999). A high-resolution high signal-to-noise ratio spectrum of APM 08279+5255, covering the wavelength range 4400–10000Å was obtained using the Keck telescope and made available to the Astronomy community for analysis (Ellison et al. 1999a,b). This spectrum, though complicated by the combination of light traveling along three different sight lines, is a unique laboratory for studying the intervening and associated absorption systems.
It is well known that the origin of associated systems (systems with ) cannot be inferred directly from their position in the spectrum. Indeed, absorption can arise from (i) gas ejected by the central engine at velocity as high as 60000 km s-1 and nonetheless physically located very close to the source of ionizing photons (e.g. the = 2.24 ”mini-BAL” towards Q 2343+125 at = 2.515; Hamann, Barlow & Junkkarinen 1997a) or from (ii) gas associated with the host-galaxy or with members of a galaxy cluster surrounding the quasar. The distinction can be made in terms of physical properties. The systems belonging to the first class are characterized by high metal enrichment, high-ionization parameters, broader line profiles, partial coverage and time variability (Barlow et al. 1992, Petitjean et al. 1994, Savaglio et al. 1994, Hamann 1997, Hamann et al. 1997b, Barlow & Sargent 1997, Ganguly et al. 1999, Papovich et al. 1999). The second class of absorber is characterized by classical properties of intervening systems such as low metallicities (typically 0.01 to 0.1 of solar) and undisturbed kinematics.
In this study we investigate the nature and physical properties of systems toward APM 08279+5255. In Section 2, we describe the data and the grids of photoionization models we use to infer ionizing conditions in the absorbing gas. We analyse a probably intervening metal line system very close to the emission redshift in Section 3. The nature of narrow-line systems with low-ionization conditions are investigated in Section 4. Section 5 describes the high-ionization narrow-line systems. In Section 6, we analyse the nature of the BAL outflow and in Section 7 we suggest the presence of ”line-locking” among narrow components in the BAL flow. A summary is given in Section 8.
2 Data and photoionization models
A spectrum of the = 3.91 quasar APM 08279+5255 was obtained with the HIRES echelle spectrograph at the 10m Keck-I telescope (Ellison et al. 1999a,b). This data was made public together with a low-resolution spectrum of the quasar and a high-resolution spectrum of a standard star. We have corrected the high-resolution spectrum of APM 08279+5255 for small discontinuities in the continuum, which are probably due to the inappropriate merging of different orders. These discontinuities have been recognized by comparing the high and low-resolution spectra. The latter has also been used for normalization of the high-resolution data. Atmospheric absorption features were identified from the standard star spectrum. We have measured the final spectral resolution by fitting the narrow atmospheric absorption lines which are free of blending. We find 8 km s-1 ( 4.8 km s-1) at 6900 Å, = 37500, and use this value throughout the paper.
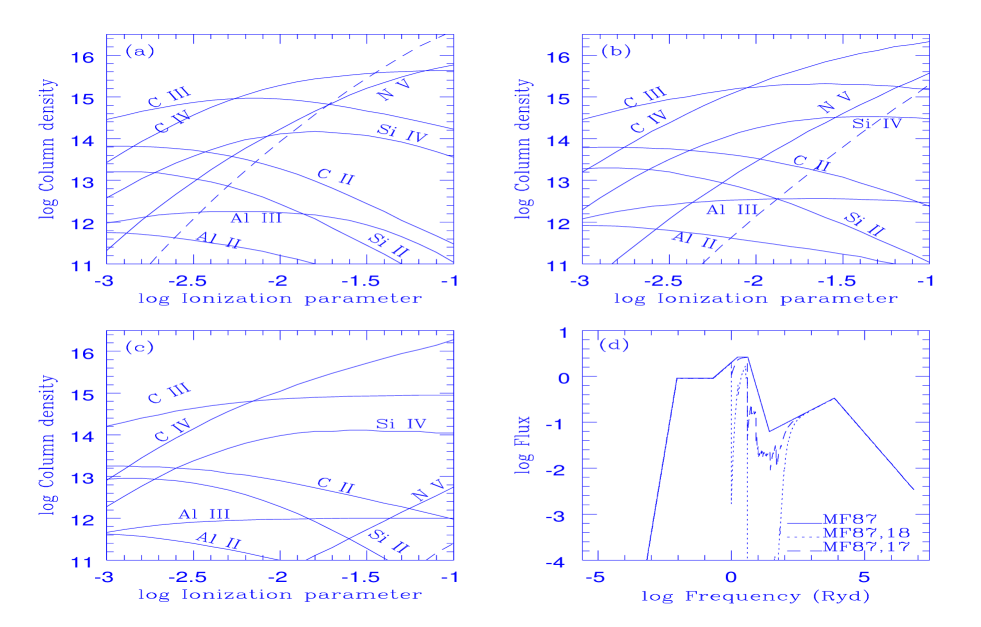
Grids of photoionization models using the code Cloudy (Ferland 1996) have been constructed. The cloud is a plane parallel slab of uniform density, solar chemical composition and neutral hydrogen column densities (H i) = cm-2 (see below) photo-ionized by the QSO radiation. The spectral energy distribution of APM08279+5255 is not known in the UV/X-ray energy range. We use the standard AGN spectrum provided by Mathews & Ferland (1987) and also consider the effect of screening the ionizing spectrum by optically thick clouds to take into account the fact that BALs are X-ray quiet (Green & Mathur 1996). The resulting column densities of various species, for different ionizing spectra, along a line-of-sight perpendicular to the slab are given in Fig. 1.
3 The intervening system at = 3.8576
This system is revealed by strong C iv and hydrogen Lyman series lines. It is at higher redshift than the main component of the BAL out-flowing gas. Moderately saturated C iii977 and C iv absorptions are seen whereas Si iii1206 and Si iv, although present, are weak (see Fig. 2). Both C iv and C iii977 profiles suggest the presence of 5 distinct components. Only the highest velocity component shows absorption due to higher hydrogen Lyman series transitions. The expected positions of O vi is in the wavelength range of the very strong O vi BAL.
Column densities estimated from Voigt profile fitting are given in Table LABEL:tab385 for different species. Note that the C iv doublet ratio is consistent with complete coverage of the background source (see below). The neutral hydrogen column density at = 3.8574 is well defined by higher Lyman series absorption lines. If we assume the QSO is the ionizing source we derive log from the C iii and C iv column densities and the absence of singly ionized species. Models with solar metallicities produce C iii and C iv column densities two orders of magnitude larger than what is observed (see Fig. 1). This clearly suggests that metallicities are of the order of [C/H] 0.01 [C/H]⊙, similar to what is usually derived for intervening systems. It is likely that this system does not belong to the QSO environment.
| Species | (cm-2) | (km s-1) | |
|---|---|---|---|
| H i | 3.8574 | 1.32 | 17.411.13 |
| C iii | 3.8557 | 3.13 | 20.851.81 |
| 3.8564 | 7.95 | 12.430.36 | |
| 3.8568 | 2.08 | 10.670.13 | |
| 3.8571 | 2.41 | 7.250.70 | |
| 3.8574 | 1.16 | 12.570.72 | |
| C iv | 3.8557 | 3.34 | 20.851.81 |
| 3.8564 | 1.09 | 12.430.36 | |
| 3.8568 | 3.76 | 10.670.13 | |
| 3.8571 | 2.67 | 7.250.70 | |
| 3.8574 | 6.39 | 12.570.72 | |
| Si iv | 3.8567 | 1.27 | 9.730.67 |
| 3.8574 | 6.69 | 5.440.63 |
4 Intrinsic systems with narrow and low-ionization lines
4.1 The = 3.8931 complex


Absorption profiles of some of the important transitions from this complex are given in Fig. 3. In what follows, we concentrate on the component at 0 km s-1, which shows absorption due to low ionization lines: Al ii, Al iii, Si ii, Si ii*, C ii and C ii*. In addition, there are strong absorption lines at the expected positions of N iii989 and C iii977 with profiles similar to that of C iv and Si iv. It is however very difficult to rule out contamination by intervening Lyman- systems. There is a feature at the expected position of O vi1031. However, as O vi1037 is heavily blended, it is difficult to establish the presence of O vi in this system. N v absorption is present and weak (see Fig. 3).
4.1.1 Partial covering factor
The flat bottom and the presence of other Lyman series lines show that the Lyman- line is saturated. However, it is apparent on Fig. 3 that there is some residual flux in the core of the Lyman- line. Similar residuals are seen at the bottom of Siiv1393 and Civ1548. Residual flux is expected in case one of the three lines of sight is not intercepted by the absorbing cloud. However the relative brightnesses of the components are 0.773 and 0.175 (Ibata et al. 1999). Therefore, under the above assumption, at least 10% residual flux is expected, much larger than the 3% observed. This clearly suggests instead that the absorbing gas is located outside the BLR and that it covers only 97% of the background source (BLR+continuum+scattered light). We use the C iv, Si iv and Al iii doublets to estimate the covering factor of these species applying the method described in Srianand & Sankaranarayanan, 1999. The results are shown in Fig. 4. The covering factor of the C iv and Si iv component at 0 km s-1 is about 0.95 whereas the corresponding value for Al iii is 0.80.
For simplicity and because the residual is small, we assume complete coverage while estimating the column density of H i. We find log (H i) = 15.9, suggesting that the partial Lyman limit detected in the rest frame of the QSO (Irwin et al. 1998) is most certainly not due to this system.
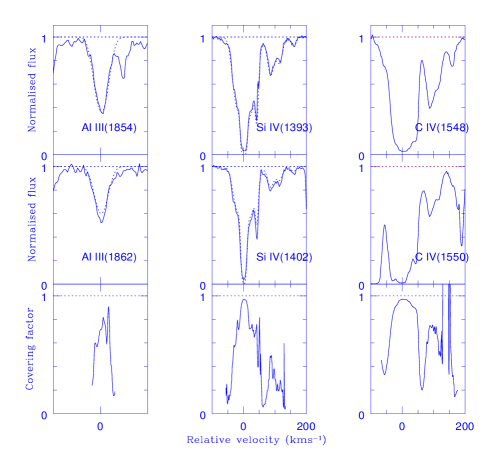

The covering factor of the singly ionized phase can be estimated using the numerous Si ii lines. In particular, the Si ii1260 and Si ii1304 absorption lines are redshifted beyond the QSO Lyman- emission line. The Si ii1260 line is blended with C iv1548 at = 2.9833 and we use C iv1550 to remove the contamination. In the lower panel of Fig. 5, the best Si ii1260 fit, after removal of the C iv contribution, is plotted together with the Si ii1304 profile appropriately scaled to Si ii1260 for a covering factor of . This covering factor is consistent with the value derived from the Al iii doublet. In the top panel of Fig. 5 the Si ii*1309 profile is plotted together with the scaled profile of Si ii*1264 for two values of the covering factor. The best value is , however as the Si ii* is weak, a value of 0.8 is well within the 1 error. Thus, the data is consistent with both Si ii and Si ii* absorptions having similar covering factors .
The column densities given in the fourth column of Table LABEL:tab389 are obtained by integrating the optical depth over the velocity range covered by the absorptions after taking into account the covering factors derived above. Note that the C iv column density is unreliable due to blending with other lines as well as contamination of C iv1550 by C iv1548 at = 3.901. Results from single component Voigt-profile fits are given in the second column of the Table LABEL:tab389.
| Ion | (cm-2) | (km s-1) | (cm-2) |
|---|---|---|---|
| H i | 8.39 | 15.910.57 | …. |
| C ii | 1.64 | 8.030.20 | 2.09 |
| C ii* | 2.49 | 8.030.20 | 3.38 |
| C iv | 3.58 | 8.030.20 | 2.58 |
| Si ii | 7.49 | 7.090.40 | 9.12 |
| Si ii* | 2.16 | 7.090.40 | 2.69 |
| Si iv | 1.20 | 7.090.40 | 7.76 |
| N v | 3.28 | 7.090.40 | …. |
| Al ii | 6.25 | 6.470.19 | 7.76 |
| Al iii | 6.23 | 9.070.24 | 1.04 |
4.1.2 Excitation of the fine-structure levels
The presence of several absorption lines from excited fine-structure levels of Si ii and C ii is a unique opportunity to study the physical properties of the absorbing gas. Two main excitation processes are at play: radiative excitation by an IR radiation field and collisional excitation mainly by electrons.
Let us first consider radiative excitation. In that case,
| (1) |
where is either C ii or Si ii and is given by
| (2) |
where , in , is the flux of energy density integrated over all directions. From the available IRAS fluxes and the sub-millimeter observations by Lewis et al. (1999), the flux at the excitation energy of Si ii (0.036 eV) in the rest frame of the absorber is 0.1 Jy. Assuming the IR emitting region to be a point, = 3.910, = 75 km s-1 Mpc-1 and = 0.5, we obtain,
| (3) |
where is the distance of the cloud from the ionizing source and is the magnification factor due to gravitational lensing. From Eqs. (1) and (2) we derive,
| (4) |
The IR flux at the excitation energy of C ii (0.008 eV) is 0.016 Jy so that
| (5) |
Therefore if radiative excitation is at play, we should observe,
| (6) |
As (Si ii)/(Si ii*) 3.5, the radiative excitation predicts (C ii)/(C ii*) 0.67 when the observed ratio is 0.66. This strongly suggests that indeed excitation by IR radiation is important. For , we obtain an upper limit on the distance of the cloud from the IR source, 150 pc. If the magnification factor is as high as 90, as suggested by the probable presence of the third image (Ibata et al. 1999, Egami et al. 1999), the distance could be as small as 15 pc.
Let us consider now the case of pure collisional excitation. Note that excitation by hydrogen atoms is unimportant in the case of optically thin clouds. Deexcitation is due to spontaneous emission as well as particle collisions. The necessary relationships to estimate the population ratios as a function of temperature and density are taken from Bahcall & Wolf (1968). For Si ii the collisional excitation rate is, cm3s-1, the collisional deexcitation rate is, cm3s-1 and the spontaneous radiative deexcitation rate is s-1. For C ii the above rates are respectively, cm3s-1, cm3s-1 and s-1. Here, is the temperature expressed in units of K.
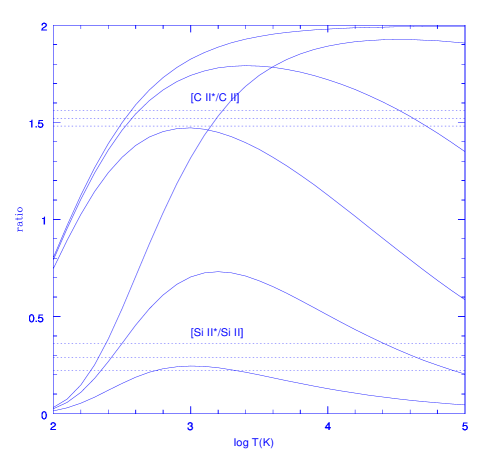
In Fig. 6, are plotted the ratios (Si ii*)/(Si ii) and (C ii*)/(C ii), of excited to ground state column densities as a function of temperature for three different values of the electronic density. In order to reproduce the observed ratios (indicated by horizontal dashed lines in Fig. 6), the electron density has to be larger than 100 cm-3 and the temperature greater than 320 K. As can be seen from Fig. 6, there is no stringent constraint on the electron density when the electron temperature of the gas is low. Note that although it would be surprising to find such a small temperature in an optically thin cloud located in the vicinity of the quasar, this is possible if the metallicity of the gas is well above solar (e.g. Petitjean et al. 1994). In case the gas is warm, from the width of the absorption lines, we derive an upper limit on the temperature of 4.6 K which gives an upper limit on the density of 500 cm-3.
Is there any way to choose between the two processes discussed above? The small distance inferred in case of pure radiative excitation together with the low-ionization state of the gas may be at odd with the proximity of a very powerful source of ionizing radiation. From the low spectral resolution spectrum, we estimate the flux at the Lyman limit in the rest frame of the absorber to be 3 erg s-1cm-2Å-1. This corresponds to a luminosity at the Lyman limit of erg Hz-1s-1. Assuming a flat spectrum and integrating over the energy range 1 to 20 Ryd, we estimate the number of ionizing photons per unit time emitted by the quasar, = 210, where is the magnification factor. Thus, the distance between the cloud and the quasar is
| (7) |
where is the particle density in units of cm-3, and is the dimensionless ionization parameter in units of . The latter is the ratio of the density of ionizing photons to the hydrogen density. The H i, Si ii and C ii column densities derived in this system are consistent with log 2 (see Table LABEL:tab389 and Fig. 1). Even for metallicities larger than 10 , log 1. As 5 and 90, we conclude that 350 pc. This lower limit can be reconciled with the distance inferred from the IR excitation if (i) contrary to the UV source, the IR source is not lensed which does not seem to be the case (see Downes et al. 1999) or (ii) the cloud is closer to the IR source than to the UV source. Indeed Downes et al. (1999) have shown that the molecular gas and the dust are located in a nuclear disk of radius 90 to 270 pc. The absorption system could be at 350 pc from the central UV source and still very close to the IR emitting disk.
Let us now assume that the cloud is at a large distance from the quasar and that the excitation is purely collisional. In that case, the electronic density must be larger than 100 cm-3. Rapid variations of the density on very small scales could imply variations of the Si ii/Si ii∗ ratio from one line-of-sight to the other. If we apply a typical ionization correction, H i/H+ = 410-3, to the H i column density derived above (see Table LABEL:tab389), we obtain (H) 21018 cm-2 and assuming 100 cm-3, we infer a dimension of the cloud along the line-of-sight of 0.006 pc. Reverberation studies of the nearby AGN NGC 5548 suggest that the size of the BLR could be in the range 10 to 20 lt days (e.g. Krolik & Done 1995, Korista et al. 1995). It is also known that the size of the BLR scales with luminosity as, . From the UV and optical spectra we estimate that APM 0827+5255 is at least 500/ times brighter than NGC 5548. If we apply the luminosity scaling then the radius of the BLR of APM 0827+5255 is of the order of 0.3/ pc. Thus in order to cover 97% of the background source, the transverse dimension of the cloud should be 50/ times larger than the dimension along the line-of-sight. As could be as large as 100, the two dimensions could be of the same order of magnitude. The cloud is therefore very small.
4.1.3 Photoionization model
In this Section, we discuss the ionization state of the gas in more detail. Fig. 1 shows the results of models with solar metallicity assuming different ionizing spectra, either an unattenuated Mathews & Ferland (1987) spectrum or the same spectrum attenuated by an ionized hydrogen and helium slab with log = –1 and H i column density of 1017-18 cm-2. The resultant spectra are given in panel (d) of Fig. 1. It is apparent that the absorption is most important at the He ii edge. This mimics the presence of the BAL outflow along the line-of-sight. As an illustration, the number of ionizing photons is reduced by a factor 6 due to the presence of a screen with log (H i) = 18.
In models with unattenuated ionizing radiation, the observed (Al iii)/(Al ii), (Si iv)/(Si ii) and (C iv)/(C ii) ratios suggest consistently log , and and [Al/H] = 3.2 [Al/H]⊙, [C/H] = 0.5 [C/H]⊙ and [Si/H] = 1.6 [Si/H]⊙. Models with ionizing radiation attenuated by a screen with (H i) = cm-2 give log , and [Al/H] = 1.7 [Al/H]⊙, [C/H] = 0.5 [C/H]⊙ and [Si/H] = 0.9 [Si/H]⊙.
The most important effect of attenuation is that the N v column density decreases with increasing attenuation due to the paucity of photons of energy larger than the N iv ionization potential. In the case of unattenuated ionizing spectrum and assuming solar abundances, the model predicts log (N v) which is at least a factor of 3 larger than the observed value. Attenuation by a slab with neutral column density as large as log (H i) = 18 is ruled out, however, as in that case log (N v) = 11 instead of 12.7 observed.
In conclusion, if the shape of the ionizing radiation from the QSO is similar to the Mathews & Ferland (1987) spectrum, then the data is consistent with attenuation of the ionizing flux by a screen with log (H i) 17. Absolute metallicity is probably very close to solar which is typical of associated absorption systems (e.g. Hamann & Ferland 1993; Petitjean et al. 1994; Petitjean & Srianand 1999, Hamann & Ferland 1999 for a recent review). However there is an indication that Carbon is under-abundant and Aluminum over-abundant compared to Silicon.
4.2 The = 3.9135 complex
| Species | z | (cm-2) | (km/s) |
|---|---|---|---|
| H i | 3.9135 | 1.04 | 18.570.77 |
| C ii | 3.9135 | 1.28 | 12.510.27 |
| C ii* | 3.9135 | …. | |
| C iv | 3.9133 | 8.13 | 11.670.47 |
| 3.9135 | 4.83 | 16.490.49 | |
| 3.9138 | 1.53 | 16.713.07 | |
| Si ii | 3.9135 | 1.35 | 11.500.70 |
| Si ii* | 3.9135 | …. | |
| Si iv | 3.9133 | 3.69 | 9.480.26 |
| 3.9135 | 2.04 | 12.700.21 | |
| 3.9138 | 4.53 | 10.030.49 | |
| N v | 3.9135 | ||
| Al ii | 3.9135 | 8.64 | 12.210.55 |
| Al iii | 3.9135 | 2.15 | 12.680.45 |
The redshift of this system is very close to the CO emission redshift, = 3.9114 (Downes et al. 1999); the difference is only 130 km s-1 whereas the width of the CO line is 480 km s-1 and the total width of the saturated part of the associated Lyman- line is 300 km s-1. Three distinct sub-systems are seen in Si iv and C iv. The strongest component in this complex has associated absorption from C ii, C iv, Si ii, Si iv, Al ii, Al iii and Lyman- (see Fig. 7). Unlike what is observed at = 3.8931, the Lyman- line goes to zero indicating complete coverage. This is confirmed by the Si iv and Al iii doublets. Using the Lyman series, we estimate the neutral hydrogen column density, log (H i) = 17.00.14 (see Table LABEL:tab391). This is consistent with this system being responsible for the partial Lyman limit absorption seen in the low-resolution spectrum of APM 08279+5255. The Si iv and C iv doublets are well fitted by a model with three components; all the absorption lines due to singly ionized species are fitted with a single component. N v and O vi are clearly absent. There is no absorption from Si ii* down to a 2 upper limit of log (Si ii*) 11.9. The C ii* line is redshifted at the same position as C iv1548 at = 3.2388. We estimate a 2 upper limit on (C ii*) after subtraction of the C iv profile, log (C ii*) 12.7. The ratio of C ii* to C ii in this system is at least a factor 4 smaller than in the = 3.8931 system discussed previously. This suggests that this cloud has to be farther away from the IR source than the = 3.8931 cloud. For electron temperatures less than 3 K the observed limit also suggests that the electronic density is less than 20 cm-3.
The (Al ii)/(Al iii) column density ratio in the two systems at = 3.8931 and 3.9135 can be used to compare their ionization states. (Al ii)/(Al iii) = 0.40 at = 3.9135 while the allowed range at = 3.8931 is 0.06–0.10 (after taking into account covering factor effects). Note that the (C ii)/(C iv) ratio is also larger at = 3.9135. From Fig. 7 of Petitjean et al. (1994) it is clear that when (H i) 1017 cm-2, (Al ii)/(Al iii) is approximately independent of the neutral hydrogen column density (for a given ionizing spectrum) and depends only on the ionization parameter. Therefore, the ionization parameter of the = 3.9135 system is slightly smaller than that of the = 3.8931 system.
To discuss this system in more detail, we can use the models of Fig. 1b, scaling the column densities with abundances. The (Al iii)/(Al ii), (C ii)/(C iv) and (Si iii)/(Si iv) ratios suggest, log and respectively. The range of ionization parameters reflects the uncertainties. If we use the mean ionization parameter, log , the model suggests [C/H] = 0.02 [C/H]⊙, [Si/H] = 0.01 [Si/H]⊙ and [Al/H] = 0.23 [Al/H]⊙. Though the average abundance in this system is similar to intervening systems at large redshift, it seems that Aluminum is largely enhanced compared to Carbon and Silicon. Such peculiar abundance pattern has already been noted by Ganguly et al. (1999).
All this suggests that whereas the = 3.8931 system must be located within 200 pc from the QSO and ejected at a velocity larger than 1000 km s-1, the = 3.9135 system must be farther away and part of the host-galaxy.
5 High-ionization narrow-line systems
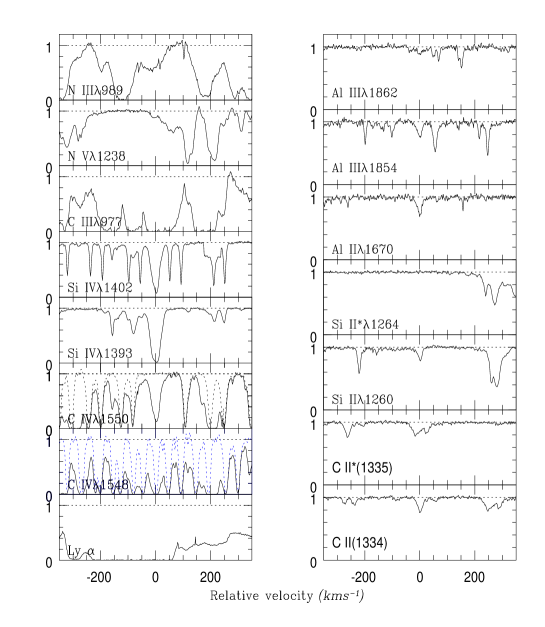
In this section we study the high-ionization narrow-line associated systems, defined as well detached systems with Lyman- apparent optical depths much smaller than that of O vi and N v (see Fig. 8). There are two main complexes at 3.90 and 3.917. We concentrate on well defined strong components.
5.1 = 3.8997
Column densities are estimated using the apparent optical depth method (Savage & Sembach 1991). The results are given in Table LABEL:tabhigh together with the velocity intervals over which the column density is estimated. The residual intensities in both components of the N v doublet and the O vi1031 line are consistent with complete coverage. Unlike O vi, N v lines are not heavily saturated. As can be seen from Fig. 8, the C iv1550 component is heavily affected by atmospheric absorption. We estimate a lower limit on the C iv column density using the C iv1548 profile and assuming complete coverage. There is a strong absorption feature at the expected position of C iii977 , the profile of which is very similar to that of C iv. As we cannot rule out contamination by intervening Lyman- absorption, the C iii column density should be considered as an upper limit. As can be seen from Fig. 8, the associated Lyman- absorption is very weak in this component. In addition, this line falls in the wavelength range over which N v BAL absorption is present and coincides with the expected position of the N v1242 absorption from a complex at = 3.795, which has ubiquitous absorption due to C iv and Si iv (see also next Section). Therefore the H i column density given in Table LABEL:tabhigh is most certainly an upper limit.
5.2 = 3.9010
This component shows strong O vi absorption with profiles consistent with complete coverage. The Lyman- line coincides with the expected position of the N v1242 absorption from the complex at = 3.795. Thus, the H i column density given in Table LABEL:tabhigh is an upper limit. From Fig. 8, it can be seen that N v1242 from this system coincides with N v1238 at = 3.9170. Thus we estimate the N v column density using the N v1238 line only. As noted before, C iv1550 is heavily affected by atmospheric absorption; C iv1548 coincides with C iv1550 at = 3.9135 (see Figs. 7,8) preventing us to estimate the C iv column density in this system. There is a strong line at the expected position of C iii977. We estimate an upper limit of the C iii column density assuming complete coverage.
5.3 = 3.9170
The saturated O vi lines have no residual flux so the absorbing cloud completely covers the background source. The O vi1037 line is blended with a strong line most probably due to an intervening cloud. The lower limit on the O vi column density is estimated using the O vi1031 line only. As discussed before the N v1238 line is blended with the N v1242 line at = 3.9010 and the N v1242 line is blended with Mg ii2796 at = 1.18. It is therefore difficult to estimate the N v column density accurately. We obtain an upper limit using the N v1238 profile. Though the C iv absorption is quite strong, both lines of the doublet are badly blended with atmospheric features.

| Species | (cm-2) | (km s-1) | |
|---|---|---|---|
| 3.8997 | H i | -20,18 | |
| N v | 2.85 | ….. | |
| C iv | ….. | ||
| C iii | ….. | ||
| O vi | ….. | ||
| 3.9010 | H i | -14,18 | |
| N v | 6.91 | ….. | |
| C iii | ….. | ||
| O vi | ….. | ||
| 3.9170 | H i | 2.60 | -50,18 |
| N v | ….. | ||
| O vi | ….. |
5.4 Modeling
The column densities derived in the three systems are given in Table LABEL:tabhigh. The observed column densities of H i, C iv, N v and O vi are typical of associated absorption systems (Petitjean et al. 1994, Hamann 1997, Petitjean & Srianand 1999).
We run photoionization models using the ”Optimize” command available in ”Cloudy” to derive the best values for the ionization parameter and heavy element abundances. For the Mathews & Ferland (1987) ionizing spectrum we obtain log and for the = 3.8997 system and log and (O,N) = 14 for the = 3.9010 system.
However, it is known that BALQSOs are X-ray quiet with optical to X-ray spectral index (Green & Mathur, 1996) while the Mathews & Ferland spectrum has . If we assume the spectra seen by the absorbing clouds to be steeper than the Mathews & Ferland spectrum then we obtain = 5, 1.4, 0.5, 0.4 and = 0.3, 0.7, 1.2, 1.3 for = 1.5, 1.7, 1.9 and 2.1 respectively for the = 3.8997 system. The reason for this is that the number of photons available for ionization of C iv, N v and O vi decreases when increases. Therefore, it would be of first interest to measure for this quasar.
6 The BAL flow
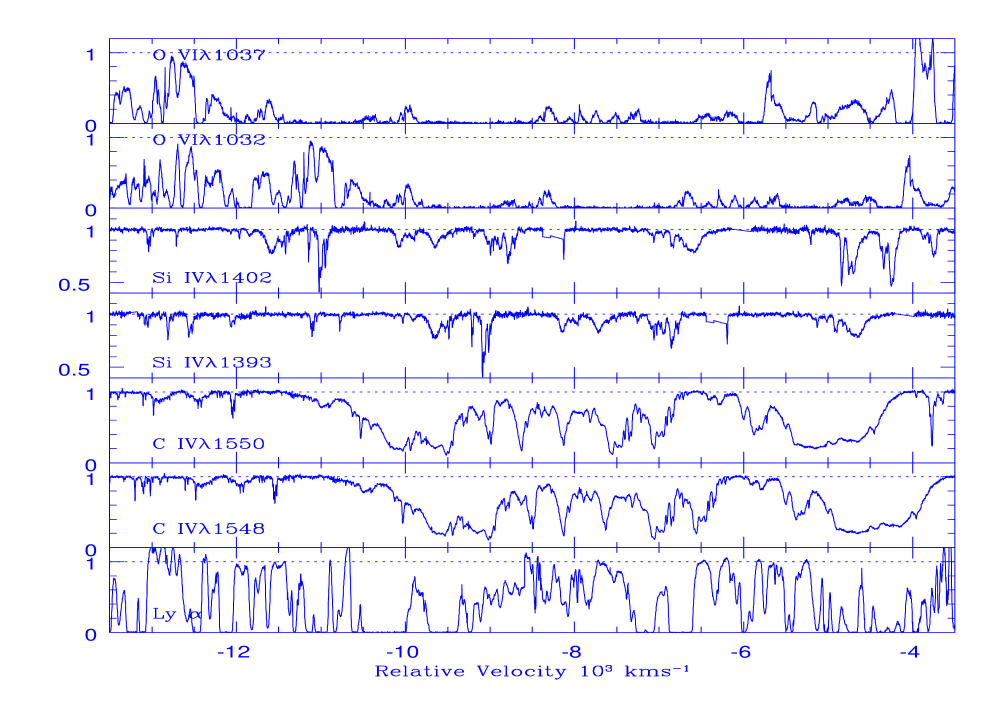
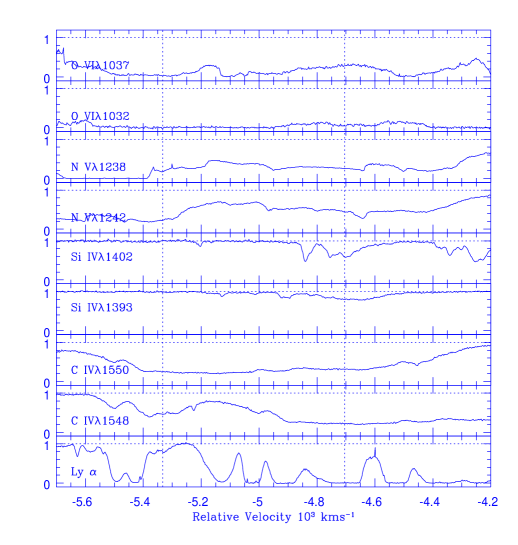
The maximum observed ejection velocity of the C iv absorption is km s-1 relative to the systemic redshift = 3.911. The BAL is of high-ionization: the O vi absorption is much stronger than the C iv one; N v is also conspicuous; weak Si iv absorption is seen in only a few components (especially those responsible for the strong C iv troughs at km s-1 and 4670 km s-1). The structure of the absorption profiles due to the out-flowing gas is complex as it breaks into components of different widths, depths and covering factors (see Fig. 9).
Weymann et al. (1991) have shown that the mean spectrum of BALQSOs shows two distinct and localized minima separated by about the velocity splitting of N v and Lyman- (i.e. km s-1) located near velocities 4700 and 10500 km s-1 relative to the emission redshift. Korista et al. (1993) have found that 22% of BALQSOs do show double troughs. These features suggest that radiative acceleration is important to generate the flows and the observed profiles are due to line-locking (Arav 1996 and references therein).
In APM 08279+5255, the two strongest troughs in the C iv profile are separated by km s-1(see Figs. 9 and 9), smaller than the Lyman-–N v velocity splitting. In between these two absorption troughs there are weak C iv absorption lines (resolved even in the low-resolution spectrum). From the shape of the red wing of the C iv emission line it is also apparent that the flux in the blue wing of the C iv emission line at Å is very close to the expected unabsorbed value (see Fig. 10). This suggests that the two strong troughs are well detached. It is very difficult to produce such a profile in models of out-flowing gas where the double structures are created by radiative processes which produce clustering in the velocity space keeping all absorbing atoms at the same physical location (see the fits to double troughs in Fig. 11 of Arav 1996). We thus believe that the two strong troughs are due to physically distinct absorbing components which are similar to mini-BAL systems seen in a few QSOs (e.g. Petitjean & Srianand 1999).
In what follows we consider smaller velocity intervals and investigate the profiles of different absorptions in more detail. The velocity are taken with respect to = 3.911.

6.1 The broad C iv absorption at km s-1
The two broad features at 7295 Å and 7305 Å correspond mostly to the two lines of a C iv doublet at 3.712 ( km s-1 in Fig. 9). The profiles do not match exactly however. It is clear from Fig. 11 that there is an extra absorption in the C iv1550 profile at km s-1 from the center of the line. This absorption is tentatively identified as C iv1548 at 3.717, the corresponding broad, albeit weak, C iv1550 line is blended with the narrower Fe ii2600 complex from a Mg ii system at = 1.81. Most of the narrow absorption features seen in the C iv1548 and C iv1550 profiles are due to atmospheric absorptions.
We believe, this absorption structure is real because of the good match between the profiles of the C iv lines in the red wings (see Fig. 11), and because the lines are located very near the centre of an echelle order and thus cannot be an artifact of imperfect order merging. This system is well detached from the rest of the BAL and therefore the continuum can be fitted accurately. The C iv absorption is most probably saturated as the residual intensities in both lines are similar. However they are equal to 0.87 which clearly indicates that the covering factor is surprisingly small, . The C iv profiles, in the velocity range not affected by the narrow atmospheric absorption lines between 100 km s-1 and 100 km s-1, can be fitted with a covering factor of 0.12 (see top panel in Fig. 11). The typical error in the covering factor is 0.02 (as the rms in the normalised continuum over this wavelength range is 0.02). From Fig. 10 it is apparent that this absorption, does not occur on top the C iv emission line. Thus the low coverage is most likely due to the fact that the absorbing gas does not cover one of the images of the very small continuum source. If the absorbing gas covers only image C, then we expect a covering factor of 0.09. The consistency with the observed value is an additional argument in favor of object C being the third image of the gravitationally lensed quasar. If true, this implies that a strong C iv absorption, with very little residual intensity, is expected in the spectrum of image C whereas very weak or no absorptions are expected in the spectra of A and B. This can be probed with HST/STIS observations.
The width of the absorption lines is km s-1. This system must be considered as a ”mini-BAL” as the C iv profile is smooth and broader than a typical intervening system but narrower than a typical BAL outflow (Barlow et al. 1997). Si iv absorption is not detected and O vi and N v are redshifted at the same position as other strong lines.
6.2 Absorptions in the range km s-1
In addition to the broad absorption seen in this wavelength range, there are a few narrow absorption lines identified as C iv doublets.
6.2.1 Narrow lines at km s-1
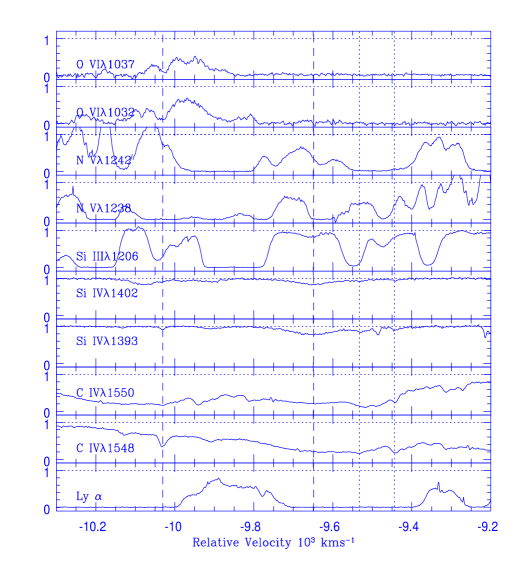
The system at km s-1 is defined by C iv, O vi, N v and Si iv narrow absorption lines. They are most probably associated with a strong Lyman- line seen at the same velocity (see Fig. 12). Unlike other narrow systems seen over this wavelength range, the profile of the O vi absorption is well defined and less affected by blending. The equivalent widths of the C iv lines measured using a continuum defined locally, = 0.24 and 0.13 Å, are consistent with a covering factor close to unity.
A Voigt-profile fit to the C iv1548 narrow line, with a continuum defined locally, gives = 11.0.3 km s-1and (C iv) = cm-2. This gives an upper limit on the temperature of the gas, K. The C iv1548 , Si iv1393 and O vi1037 profiles are very similar, suggesting that the velocity dispersions are of the same order. Higher order Lyman series lines are present exactly at the redshift defined by the C iv1548 line. The Ly-6 line is weak and not saturated. Voigt-profile fitting to this line gives (H i) = 3.30.2 1015 cm-2 and km s-1, which implies and suggests that ionization is dominated by photoionization.
6.2.2 System at km s-1
This system is defined by strong and broad C iv and Si iv lines. There is an absorption line at the expected position of Si iii1206 with very similar velocity profile which leaves little doubt on the identification (see Fig. 12). The fit to the Si iv doublet gives a covering factor of 0.25. For this value we estimate the column density of Si iv to be cm-2. It is interesting to note that the residual intensities of Si iii1206 and Si iv are similar. If both absorptions are produced in the same region this means that the column density of Si iv is about a factor of 3 larger than that of Si iii.
As the continuum fitting in the Si iv region is accurate, the estimate of the covering factor is reliable. The low-resolution data indicates that the Si iv absorption is not located on top of the Si iv emission line. Thus, a partial covering factor has to be explained in terms of one or two of the multiple images not being covered. However, the covering factor we derive here is larger than what is expected if the gas covers only image C and smaller than the expected value if it covers only image B. This most certainly means that the absorbing gas covers at least two of the images and that the optical depths along different sight lines are different. Absorptions due to the C iv lines are strong and both have residual intensity 0.20 (covering factor ). Though this value is somewhat uncertain due to the non-uniqueness of the continuum fitting, it is larger than the value derived for Si iv. It has been observed already in some ”mini-BALs” that covering factors vary from one transition to the other (see e.g. the = 2.207 system towards J2233-606, Petitjean & Srianand 1999). However, the interpretation of this in the present case is clearly that the ratio of the optical depths of Si iv and C iv along different sight-lines are different.
The Lyman- line at about the same velocity is most certainly from an intervening system at 3.7584 associated with two weak C iv and Si iv narrow components (marked by dotted lines at and km s-1 on Fig. 12). The determination of the H i column density in the broad system is difficult as the higher Lyman series lines are expected to be broad and shallow if the covering factor is 0.25. However we note that the residual flux at the expected positions of Ly-6 and Ly-7 are smaller than 0.25 suggesting that these lines, if at all present, are not heavily saturated. We obtain an upper limit on (H i) of 4 cm-2 for an assumed covering factor of 0.25. For a Mathews & Ferland (1987) ionizing spectrum, the ionization parameter required to produce the observed Si iv to Si iii column density ratio is log . This suggests that the absorbing gas is weakly ionized compared to the systems we have discussed above. The model needs [Si/H]20[Si/H]⊙ in order to reproduce the column densities. Note that in this case the solution depends weakly on the assumed value of
6.3 Narrow components in the range km s-1
From the C iv profiles (see Fig. 9), it is apparent that this velocity range is dominated by absorptions from individual clouds superposed on a continuous absorption. It is difficult to disentangle both contributions. The narrow C iv systems have small H i optical depth. This is characteristic of systems associated with the quasar.
It is interesting to note on Fig. 9 that the residual flux of O vi1037 is very small and narrow components are barely visible. This indicates that the continuous gas-component is of higher ionization than the other components in the flow. Absorption due to Si iv is not detected over this velocity range. Thus, the systems are similar to the high-ionization systems discussed in Section 5.
6.4 Complex centered at km s-1
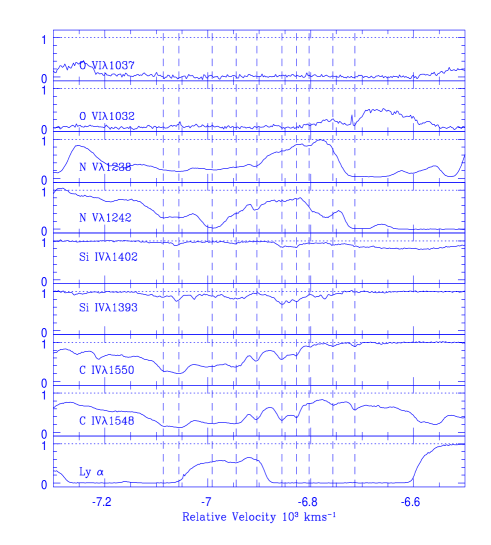
As can be seen in Fig. 13, there are at least 10 distinct components (marked with dashed lines) in the C iv profile of this complex. The two strong Lyman- lines at and km s-1 are most probably due to intervening systems. The line at = km s-1 (= 3.8018) is indeed associated with the five weak and narrow C iv and Si iv components with the largest velocities ( km s-1).
The other C iv components have strong associated N v absorption with (N v) (Si iv), typical of associated systems. The non similarity of the N v1238 and N v1242 profiles indicates that there is some blending. As noted before, the expected position of Lyman- from the two high-ionization systems at , discussed in Section 5, coincides with N v1242 in this system. Moreover, the N v1242 line of the system at km s-1coincides with the blue wing of the N v1238 absorption. The strong absorption in the N v1242 profile at km s-1is most certainly Lyman- at = 3.904 with possible N v but no O vi associated absorption.
From the N v1238 profile it is clear that the gas producing the N v absorption covers more than 80% of the background source. Fitting of the unblended C iv and Si iv doublets results in covering factors in the range 0.80.9. It is clear from Fig. 13 that the apparent optical depth of H i in the range km s-1 is much smaller than the apparent optical depth of C iv and N v. This suggests that these systems are very similar to the systems discussed in Section 5.
6.5 The velocity range km s-1
The absorption profiles in the velocity range considered here is mainly due to broad lines (see Fig. 14). The component at km s-1 is defined by C iv1548 , N v and O vi absorptions. The width of the absorptions is consistent with the definition of ”mini-BAL”. It can be seen on Fig. 14 that the optical depth increases dramatically from H i to O vi (note the weak but significant residual in O vi1037 ). This clearly suggests that (O vi) (C iv) and that the ionization of this system is very high.
The component at km s-1 is defined by C iv, Si iv, N v and O vi absorptions. The two lines of the C iv doublet are partially blended. The width of the lines is km s-1. The Si iv1393 profile has a width of km s-1. The Si iv1402 line is blended with the C iv1548 from = 3.3776. As the latter intervening system is itself heavily blended, unique profile decomposition is not possible and it is difficult to remove the C iv1548 contribution to the broad Si iv1402 profile. The important observation is that the residual intensities of O vi1031 , O vi1037 and N v1238 are larger than that derived for the component at km s-1 while it is the opposite for the C iv residual intensity. This probably indicates that this system is of lower ionization compared to the ”mini-BAL” at = 5300 km s-1.
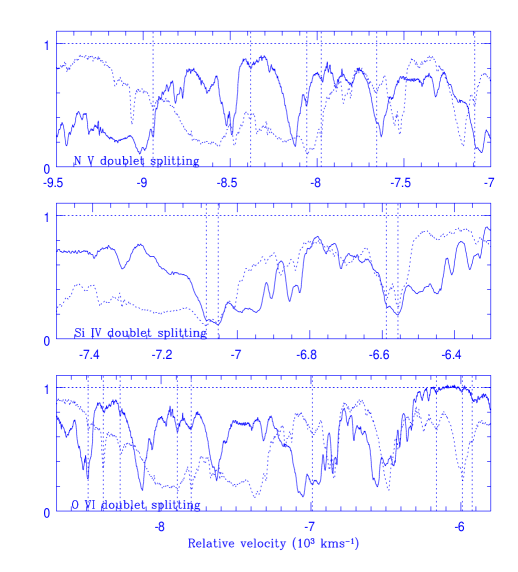
7 Line-locking
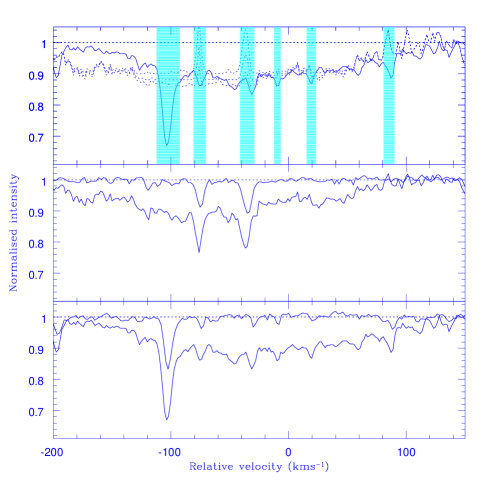
Several mechanisms have been proposed to explain the acceleration of BAL winds (see a review by de Kool 1997). One of the signatures of acceleration dominated by line radiation pressure is the presence of line-locking (e.g. Q 1303+308 in Foltz et al. 1987; NGC 5548 in Srianand 2000). We searched the spectrum of APM 08279+5255 for such signatures in the C iv wavelength range. We note that some of the velocity separations between the ”mini-BALs” are close to the Si iv and O vi doublet splittings. However as the individual lines are broad, the probability of such occurrence by chance is high. More striking is that most of the narrow C iv systems have a ”companion” system with a velocity difference corresponding to the velocity splitting of the Si iv, N v or O vi doublets with line centroids coinciding within 5 km s-1. The maximum number of matchings occurs at the velocity separation of the O vi doublet as expected for a high-ionization system. As an illustration we show in Fig. 15 the components with velocity separations equal to the O vi, N v and Si iv doublet separations. We believe that the data are indicative of the presence of ”line-locking”.
8 Summary
8.1 Low-ionization systems
Two of the narrow absorption systems (at = 3.8931 and = 3.9135), show absorptions from singly ionized species (C ii, Si ii, Al ii) whereas absorptions from N v and O vi are weak or absent. Absorptions from excited fine structure levels of C ii (excitation energy corresponding to 156m) and Si ii (excitation energy corresponding to 34m) are detected at = 3.8931. The relative column densities are consistent with the shape of the IR spectrum of APM 08279+5255. Together with the low-ionization level of the system, this favors a picture where the cloud is closer to the IR source than to the UV source. This supports the idea that the extension of the IR source is larger than 200 pc. Alternatively, if the excitation is due to collisions, the electronic density must be larger than 100 cm-3. The dimensions of the cloud along the line-of-sight is of the order of 0.006 pc and 50/ times larger in the perpendicular direction in order for the covering factor to be 97% ( is the amplification factor and could be as large as 100). Excited fine-structure lines are not detected in the = 3.9135 system. This suggests that the cloud is farther away from the QSO compared to the = 3.8931 cloud. Using photo-ionization models with and without attenuation by associated systems acting as a screen between the QSO and the gas, it is shown that abundances are and 0.01 at = 3.8931 and 3.9135 respectively. All this suggests that whereas the = 3.8931 system is probably located within 200 pc from the QSO and ejected at a velocity larger than 1000 km s-1, the = 3.9135 system must be farther away and part of the host-galaxy.
Aluminum could be over-abundant with respect to silicon and carbon at least by a factor of two and five at = 3.8931 and 3.9135 respectively. Such enrichment has already been observed by Ganguly et al. (1999) in a system with a velocity separation of 10000 km s-1 with respect to Q1222+228. It is well established that in Galactic halo stars and field dwarfs the odd-Z elements (Na, Al, Cl, P, Mn and Co) have metallicities relative to iron smaller than solar by about a factor of 3 for iron metallicities in the range (Timmes et al. 1995). Conversely, chain elements (O, Ne, Mg, Si, S, Ar, Ca and Ti) generally have metallicities relative to iron larger than solar by about a factor of three for [Fe/H]. The aluminum and silicon metallicities measured in damped Lyman- systems follow these trends (Lu et al. 1997). In rapid star-formation models, massive star formation is favored and leads to high enrichment of aluminum and silicon with respect to carbon and nitrogen (Ferland et al. 1996). But [Si/H] is always larger than [Al/H]. Large [Al/Fe] ratios are observed in bright giant stars in mildly metal-poor globular clusters (Ivans 1999). Various correlations between different element abundances suggest that the abundance pattern is most likely due to very deep mixing and proton-capture nucleosynthesis (see Langer et al. 1997 for a review). However, although [Al/Si] is found larger than solar, the excess is quite small ( 0.2 dex) and indeed much smaller than the factor 20 we observe in the = 3.9135 system.
Enrichment of aluminum with respect to silicon is found in the ejecta of classical novae (Andrea, Drechsel & Starrfield 1994; Gehrz et al. 1998). Therefore, the over enrichment of odd nucleus could be explained if the absorption is produced by individual novae shells (Shields 1996). However, novae shells invariably produce very high metal enrichment and high values of [N/C] compared to solar (Petitjean et al. 1990; Andrea et al. 1994), which conflict with the present observations.
8.2 High-ionization systems
The high-ionization associated systems at = 3.90–3.917 (redshifts very close or even larger than the assumed intrinsic redshift, = 3.91, see Fig. 8) have been shown to have metallicities larger than solar for a Mathews & Ferland ionization spectrum. At this redshift, the maximum life-time allowed by the cosmology is 0.8 Gyr, suggesting that rapid star formation occurs. We note that the relatively low N v to C iv and O vi column density ratios could be at odd with the standard rapid star-formation models discussed in the literature which predict larger values (Hamann & Ferland 1993; Matteucci & Padovani 1993). However it is known that BALQSOs are X-ray quiet with optical to X-ray spectral index (Green & Mathur, 1996) when the Mathews & Ferland spectrum corresponds to . If the cloud is ionized by a spectrum with , observations are consistent with metallicities of the order of solar or slightly smaller.
The broad C iv absorption profile has a complex structure. It shows mini-BAL absorptions (of width km s-1) and narrow components superposed on a continuous absorption of smaller optical depth. There is a tendency for mini-BALs to have different covering factors for different species. Again, this could be due to ionization structure of the BLR or due to ionization gradients in the flow. It is shown that the covering factors of a few of these absorbing clouds, which are well detached from the corresponding broad emission line profiles, are most probably due to the cloud not covering the three images of the lensed quasar. If true, this would put strong constraints on the dimensions of the clouds. HST spectroscopic observations of the three images are needed to confirm this findings. The continuous absorption is much stronger in O vi indicating that the diffuse component is highly ionized compared to the other components in the flow. This suggests that the absorption structures are due to density inhomogeneities within the flow.
The H i column density in the ”mini-BAL” is small suggesting large metallicities as is commonly found in associated narrow as well as broad absorption systems. However, there is no absorption from Al iii and P v contrary to what is seen in some of the BAL systems (Junkkarinen et al. 1995). Indeed, Shields (1997) derived overabundance of aluminum compared to silicon, [Al/Si] = 6[Al/Si]⊙, in the BAL outflows of Q1101+091, Q1231+1325 and Q1331-0108, using photo-ionization models with a Mathews & Ferland (1987) spectrum and ionization parameters in the range 1.5 log 1.00. He also noted that there are indications for [Al/Si] being several times larger than solar in the BLR of some QSOs. The Al iii to Si iv optical depth ratio is less than 0.10 in the mini-BALs seen in the spectrum of APM 08279+5255. As the above ratio depends only weakly on the ionization parameter for log (Hamann 1997), we can use a simple scaling of the analysis of Shields (1997) to derive that [Al/Si]2 [Al/Si]⊙.
Finally we tentatively identify narrow components within the BAL-flow which have velocity separations very close (within 5 km s-1) to the O vi, N v and Si iv doublet splittings. This strongly suggests the existence of ”line-locking” and points towards radiative acceleration as an important process in driving the outflow.
Acknowledgements.
We would like to thank the team headed by Sara L. Ellison to have made this beautiful data available for general public use. We gratefully acknowledge support from the Indo-French Centre for the Promotion of Advanced Research (Centre Franco-Indien pour la Promotion de la Recherche Avancée) under contract No. 1710-1.References
- (1) Arav N., 1996, ApJ 465, 717
- (2) Andrea J., Drechsel H., Starrfield S., 1994, A&A 291, 869
- (3) Bahcall J.N., Wolf R.A., 1968, ApJ 152, 701
- (4) Barlow T.A., Junkkarinen V.T., Burbidge E.M., et al., 1992, ApJ 397, 81
- (5) Barlow T.A., Sargent W.L.W., 1997, AJ 113, 136
- (6) Crenshaw, D. et al. 1999, ApJ, 516, 750.
- (7) de Kool, M., 1997, eds N. Arav, I. Shlosman & R.J. Weymann, in Mass Ejection from Active Galactic Nuclei, ASP Conference Series, Vol. 128, p. 233
- (8) Downes D., Neri R., Wiklind T., Wilner D.J., Shaver P.A., 1999, ApJ 513, L1
- (9) Ellison S.L., Lewis G.F., Pettini M., Sargent W.L.W., Chaffee F.H., Foltz C.B., Rauch M., Irwin M.J., 1999a, PASP 111, 946
- (10) Ellison S.L., Lewis G.F., Pettini M., Sargent W.L.W., Chaffee F.H., Irwin M.J., 1999b, ApJ 520, 456
- (11) Ferland, G. J. 1996, ”HAZY a Brief Introduction to Cloudy”, Univ. Kentucky, Dept. Physics & Astron.. Internal rep
- (12) Ferland G., et al., 1996, ApJ 461, 683
- (13) Ganguly R., Churchill C.W., Charlton J.C., 1998, ApJ 498, L103
- (14) Ganguly R., Eracleous M., Charlton J.C., Churchill C.W., 1999, AJ 117, 2594
- (15) Gehrs R.D., Truran J.W., Williams R.E., Starrfield S., 1998, PASP 110, 3
- (16) Green P. J. & Mathur, S. 1996, ApJ, 462, 637.
- (17) Hamann F., 1997, ApJS 109, 279
- (18) Hamann F., Barlow T.A., Junkkarinen V., 1997a, ApJ 478, 87
- (19) Hamann F., Barlow T.A., Junkkarinen V., Burbidge E.M., 1997b, ApJ 478, 80
- (20) Hamann F., Ferland G., 1993, ApJ 418, 11
- (21) Hamann F., Ferland G., 1999, astro-ph/9904223
- (22) Ibata R.A., Lewis G.F., Irwin M.J., Lehár J., Totten E.J., 1999, astro-ph/9908052
- (23) Ivans I., 1999, astro-ph/9909279
- (24) Irwin M.J., Ibata R.A., Lewis G.F., Totten E.J., 1998, ApJ 505, 529
- (25) Korista K.T., Alloin D., Barr P., et al., 1995, ApJS 97, 285
- (26) Korista K.T., Voit G.M., Morris S.L., Weymann R.J., 1993, ApJS 88, 357
- (27) Krolik J.H., Done C., 1995, ApJ 440, 166
- (28) Langer C.E., Hoffman R.D., Zaidins C.S., 1997, PASP 109, 204
- (29) Ledoux C., Thédore B., Petitjean P., et al., 1998, A&A 339, L77
- (30) Lewis G.F., Chapman S.C., Ibata R.A., Irwin M.J., Totten E.J., 1998, ApJ 505, L1
- (31) Mathews W.G., Ferland G.J., 1987, ApJ 323, 456
- (32) Matteucci F., Padovani P., 1993, ApJ 419, 485
- (33) Papovich C., Norman C.A., Bowen D.V., et al., 1999, astro-ph/9910349
- (34) Petitjean P., Boisson C., Péquignot D., 1990, A&A 240, 433
- (35) Petitjean P., Rauch M., Carswell R.F., 1994, A&A 291, 29
- (36) Petitjean P., Srianand R., 1999, A&A 345, 73
- (37) Savage B.D., Sembach K.R., 1991, ApJ 379, 245
- (38) Savaglio S., D’Odorico S., Møller P., 1994, A&A 281, 331
- (39) Shields G.A., 1996, ApJ 461, L9
- (40) Shields M., 1997, eds. N. Arav, I. Shlosman & R.J. Weymann, in Mass Ejection from Active Galactic Nuclei, ASP Conference Series, Vol. 128, p. 214
- (41) Srianand R., 2000, ApJ, 528, 617; astro-ph/9908179
- (42) Srianand R., Shankaranarayanan S., 1999, ApJ 518, 672
- (43) Timmes F.X., Lauroesch J.J., Truran J.W., 1995, ApJ 451, 468
- (44) Weymann R.J., Morris S.L., Foltz C.B., Hewett P.C., 1991, ApJ 373, 23