VLBI Astrometry of the Stellar Image of U Herculis, Amplified by the 1667 OH Maser
Abstract
The OH 1667 MHz maser in the circumstellar shell around the Mira variable U Her has been observed with the NRAO Very Long Baseline Array (VLBA) at 6 epochs, spread over 4 years. Using phase referencing techniques the position of the most blue-shifted maser spot was monitored with respect to two extra-galactic radio sources. The absolute radio positions of the maser can be compared with the stellar optical position measured by the Hipparcos satellite to 15 mas accuracy. This confirms the model in which one of the maser spots corresponds to the stellar continuum, amplified by the maser. The stellar proper motion and the annual parallax ( mas) were measured.
Key Words.:
masers – stars: circumstellar matter – stars: individual (U Her) – stars: AGB and post-AGB – techniques: interferometric – astrometry1 Introduction
Until recently, distances to Mira variables were mostly based on the Period – Luminosity relation. Primary distance measurements are important to discuss the calibration and origin of this relation, which bears on the understanding of the structure and evolution of stars on the AGB. Prior to the Hipparcos mission there were very few measurements of parallaxes of Mira stars. For a number of nearby Miras the distances are now better known; however, in several cases and for U Her in particular, the optical parallax and hence the distance is very uncertain. In this paper we show that it is possible to obtain fundamental measurements of AGB star properties by monitoring the OH maser positions with Very Long Baseline Interferometry (VLBI).
The Mira variable U Her is a well known source for studies of circumstellar masers. Both its main line OH and water masers have been the target of a number of VLBI studies (e.g. Chapman et al. Chapman (1994), Yates & Cohen YatCoh (1994)). It has been assumed to be relatively close; Chapman et al. Chapman (1994) give a value of 385 pc based on the Mira Period – Luminosity relation. Using a revised P – L relation Alvarez & Mennesier (AlMe (1997)) find a value of 280 pc.
In order to use the maser positions to monitor the trajectory of U Her, an assumption has to be made about the motion of the masers with respect to the underlying star. If the most blue-shifted circumstellar maser spot corresponds to a special condition, maser action in the shell initiated by the radio continuum radiation from the photosphere, then this most blue-shifted spot should be a bright beacon, necessarily fixed on the true stellar position. VLBI observations by Sivagnanam et al. (SivaAmpl (1990)) provided strong evidence for this. They showed that in U Her the dominant OH 1665 and 1667 MHz VLBI features at the most blue-shifted side of the spectrum are coincident, in accordance with such a model. Observations presented here support the amplified stellar image model, although some questions still remain.
Even with considerable errors on the parallax, the Hipparcos data on U Her allow a comparison between the optical and maser positions with unprecedented accuracy. Traditionally the position of the star with respect to the maser features, as well as the relative positions of maser features of different species, had to be assumed, for instance by fitting a shell and assuming the star is in the center. It has now become possible to overlay these positions directly to 15 mas accuracy.
2 Observations
The NRAO111The National Radio Astronomy Observatory is a facility of the National Science Foundation operated under cooperative agreement by Associated Universities, Inc. VLBA was used to monitor the positions of the circumstellar masers of U Her over a period of almost 4 years. In total 7 observations were recorded and correlated, but 6 were technically successful. These are July 22 1994, March 6 1995, August 8 1995, May 24 1997, October 29 1997 and April 15 1998. For most epochs a total of 6 hours was used to measure U Her. An additional 6 hours usually targeted R LMi, but this source was only detected in the first epoch. In the last epoch R LMi was omitted and we observed the water maser in U Her instead. It was detected, but no proper phase connection with any of the reference sources could be made.
The 1667 MHz OH line was observed with a small bandwidth of 500 kHz and correlated with high ( km/s) spectral resolution. Simultaneously three 4 MHz wide bands were recorded, which yielded sufficient bandwidth to detect the continuum reference sources. These were correlated separately with modest spectral resolution (ranging from 5.6 – 22.5 km/s). The 1665 MHz OH transition, which is usually also excited in Mira variables exhibiting 1667 MHz maser emission, happens to fall in one of these continuum bands. Due to a technical problem the first epoch is single polarization, the others all have both circular polarizations.
Two nearby extra-galactic continuum sources were used to calibrate phase, delay and phase rate. These were 1636+2112 and 1628+214 from Wilkinson et al. (Wilkinson (1998)). The accuracy of the calibrator positions was uncertain to 50 mas with respect to fundamental VLBI reference positions (Ma et al. Ma (1990)) according to the authors. Both calibrators are within 3 of U Her and were observed every 5 – 7 minutes. Part of the schedule was done by cycling over three sources, part by using one of the reference sources and the target only.
Recently, the VLBA was used to determine the positions of our calibrators with higher accuracy by phase-referencing them to 1639+230. ( , ). These observations refined the calibrator positions to be , and , for 1636+2112 and 1628+214 respectively. The positional accuracy is estimated to be mas, mostly due to extended structure of the reference sources themselves. The reference source 1639+230 was observed as part of the USNO 9903 catalog (electronic publication). It can be tied to the radio reference frame with mas accuracy; including the measurement uncertainties, the phase reference sources can be assumed to have absolute positions accurate up to mas. The new positions were used to calibrate the positions determined for the maser features.
The U Her data have been processed in AIPS without much special astrometric software. We rely on the accuracy of the VLBA correlator model and work with the residual phases directly. A special task was written to connect the calibration of the wide band data on the reference sources to the spectral line data sets. In all epochs phase referencing works well, even at this relatively low frequency; note that no ionospheric model is included in the correlator model. The effects of the ionosphere are seen as slightly distorted images. Indeed, when the maser spots are bright enough, these distortions can be corrected for by self-calibration. The resulting beam size varies from one epoch to the other and depends on whether we can find phase connections for the outer antennas; typically the beam is mas.
The internal consistency of our procedures can be verified by measuring the separation between the two calibrators at all epochs. The difference between the measured separation and its a-priori value was mas using the original positions from Wilkinson et al. (1998). This improved to after new determinations of the positions with respect to a fundamental reference source were made. This then agrees well with the estimate of mas accuracy for the absolute position of the calibrators. From the scatter in the positions of the calibrators with respect to each other, we conclude that the errors in the relative astrometry, due to the phase-referencing, are of the order of mas in each coordinate for each epoch.
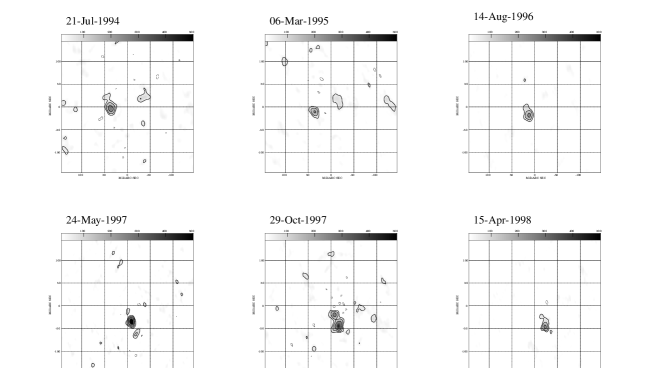
The positions of several maser spots were measured at each epoch and used to determine their motions. One should bear in mind that the image quality differs substantially between epochs; not only is the quality of the data dependent on ionospheric conditions (solar cycle, day and night) and elevation, but also on the OH variability of U Her. For our astrometric purposes, the images have been processed without using self-calibration so that the phase information is preserved. The final spectral resolution used was 2 kHz (Fig. 1).
3 Results
3.1 Maser spots
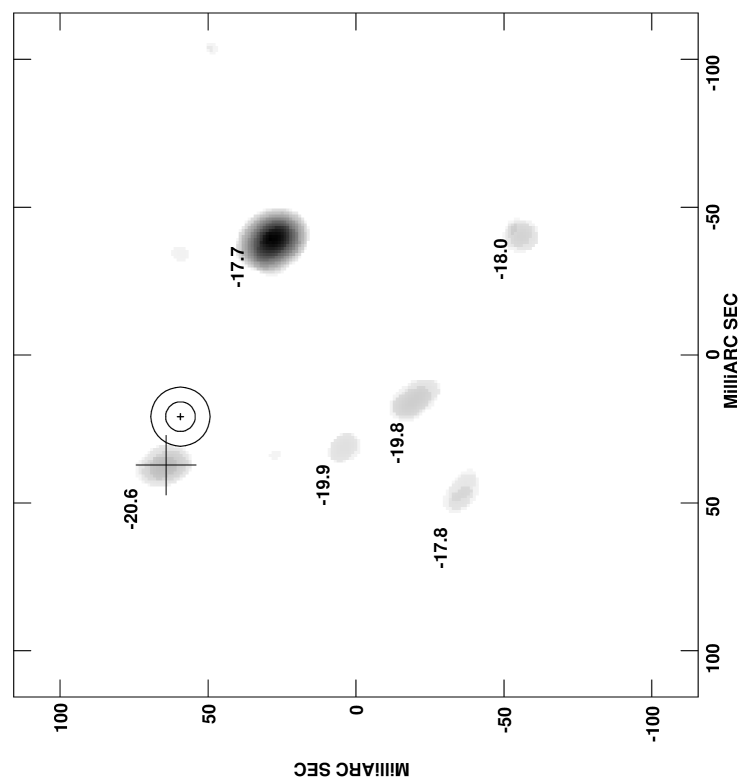
On VLBI baselines most () of the OH maser emission is resolved out. Although the U Her 1667 MHz line displays a regular double-peaked spectrum in single dish observations, the VLBI emission is limited to blue-shifted emission only. Maser spots are found in a velocity range of to km/s, the stellar velocity of U Her is km/s. In different epochs 4 – 7 regions of VLBI emission can be found, spread over 200 mas. The brightest maser spots are resolved and have sizes between 14 and 25 mas, even in the few cases where we can self-calibrate the data. Moreover, structure more compact than mas has seldom been detected previously in circumstellar OH main line masers. Therefore we believe that the fact that the maser spots are resolved is not an artifact of the phase referencing.
The most blue-shifted maser spot can be identified at all epochs (Fig. 1). However it does not seem to be any brighter (stronger or more compact) than some of the other compact spots (Fig. 2) (although one should bear in mind that the phase referencing does not calibrate the phases perfectly). Most of the other spots can be tracked over many epochs as well.
Although the 1665 MHz OH maser was observed with only modest spectral resolution it has been possible to trace the maser spots for all 6 epochs. The low resolution prohibited accurate determination of the velocities of the individual maser spots. However, it was still possible to pair many 1667 and 1665 MHz spots, solely on the basis of their relative positions.
Approximately 75% of the brightest spots detected at 1665 MHz coincide with 1667 MHz spots. Typically the positions match to mas which is slightly less than the beam size and certainly smaller than the maser spot size. An accurate determination of the flux ratio is difficult because of the difference in spectral resolution but the 1665 MHz maser spots generally appear to be the brightest. The trend of decreasing flux ratio with decreasing velocity (Sivagnanam et al. SivaAmpl (1990)) is not supported by these observations.
3.2 Amplified stellar image
Observations of U Her and other OH-masering stars have revealed compact maser sources on the blue side of the circumstellar shell, but no corresponding red-shifted features (Sivagnanam et al. SivaAmpl (1990)). This has been suggested to be due to amplification of continuum radiation from the stellar radio-sphere; the amplified stellar image theory. By comparing the optical stellar position of U Her as determined by Hipparcos with the positions of the compact maser features we have tested this hypothesis.
Previous attempts to compare radio and optical positions for maser stars had to rely on ground-based optical data (Baudry et al. Baud (1990)). Comparisons have been made using OH positions (Bowers & Johnston Bow2 (1994)), H2O positions (Bowers et al. Bow1 (1989)) and SiO positions (Wright et al. Wrig (1990); Baudry et al. Baud2 (1995)). These studies were limited to mas accuracy. With the current measurements and the data from the Hipparcos mission available, the accuracy can be increased considerably. Positions and proper motions in the Hipparcos catalogue are given for the reference epoch J1991.25 within the International Celestial Reference System (ICRS). The alignment of the Hipparcos frame with the ICRS was made at 1 mas accuracy through several link programs among which VLBI observations of radio stars played a central role (Lestrade et al. Lestrade (1995)). As noted before, our reference sources are tied to the fundamental reference frame using the USNO frame with an accuracy of 3 mas.
Comparison of the radio and optical position requires a transposition of the radio position to the mean epoch of the Hipparcos observations, J1991.25. For this we use the proper motion and parallax as determined by our fits (see below). The error in the transposed radio position is therefore dominated by the error in proper motion. For our first observational epoch this results in an error of mas, for the last epoch the error has increased to mas. Taking into account the error in the parallax, the error in the transposed position can be estimated to be 5 – 9 mas in each coordinate. Combined with the error in the radio position determination and the Hipparcos position error this allows us to compare the optical and radio positions with 15 mas accuracy (Fig. 2).

Fig. 3 shows the deviation between the radio observations and the predicted optical position using different fits for the proper motion. The radio photosphere of U Her can be estimated by using the SiO maser observations by Diamond & Kemball Diam2 (1994). They provide an upper limit of mas if, as proposed by Reid & Menten Reid (1997), the radio photosphere extends to the edge of the SiO masering region. The size of the optical photosphere of the star is thought to be half that of the radio photosphere, thus the stellar disk is expected to have a diameter of mas. This value is consistent with a straightforward diameter estimate, assuming fundamental mode pulsation and a distance of 189 pc. As seen in Fig. 3 the deviations are not significantly different for the various fits that were performed. There seems to be a systematic shift of mas in right ascension.
If the most blue-shifted spot originates from amplification of a smooth background source by a masering screen, one may expect the size of the maser spot to be comparable to that of the stellar radio-sphere. The spot is found to have a diameter of mas, consistent with the estimated radio-sphere size of 20 mas. The centroid could wander up to mas due to temporal variations of the maser or the background stellar continuum. Indeed we detect some position variations in Fig. 3, which seem to be of the order of the assumed diameter of the stellar photosphere, as expected

3.3 Parallax & proper motion
The proper motion and parallax were determined using a least-square fitting method on the 1667 MHz data. A fit to the motion of the most blue-shifted maser spot, visible in all 6 epochs, resulted in , mas/yr for the proper motion in right ascension and declination respectively (throughout the paper the errors represent deviations). If we include two other bright spots, each of which we could detect at 5 of the 6 epochs, we find: , mas/yr. Both proper motion values agree well with the result on U Her by Hipparcos: mas/yr. The Hipparcos observations (ESA ESA (1997)) give highly accurate positions but a rather poor trigonometric parallax ( mas), so the distance to the star is not reliably known. Numerical analysis shows that the VLBI data is significantly better represented by a model which includes a parallax. The best fit using the VLBA data for only the brightest spot gives mas (Fig. 4). The fit to three spots simultaneously gives mas. Although the fit to the three brightest maser spots results in smaller errors on the parallax and proper motion this result has to be treated with care. There is no clear reason to assume that all masers spots remain fixed with respect to each other, in fact they do not (see below). Only the most blue-shifted spot is expected to remain fixed to the star. Using this we have also performed a fit on that spot including the Hipparcos optical position as additional data point. This resulted in , mas/yr and mas. However, due to the difficulties in the connection of the optical and radio frames systematic errors may be present. We adopt the fit of mas and , mas/yr, with a single maser spot and radio data only as our most reliable estimate of the parallax and proper motion.
The errors displayed in Fig. 4 are the formal uncertainties in fitting Gaussian profiles to the maser spot in order to obtain the position. These errors are typically mas in each coordinate, a fraction of the beam. The additional systematic errors in the relative astrometry originating from the phase referencing were estimated to be mas. The final fit, however, leaves rms residuals of and mas in right ascension and declination respectively. The maximum deviation is mas in right ascension and mas in declination.
As noted before, the separation between the bright maser spots is not constant. Between the different observational epochs shifts average 2.5 mas. The separation between the most-blue-shifted spot and the spot at -17.7 km/s, which is the brightest spot at the first epoch, seems to show some systematic expansion. However, it is possible that between the second and third epoch the spot at -17.7 km/s disappears and thus we might be tracking a different spot afterwards.
The residuals and the relative spot motion can be only partly attributed to turbulent motion in the masering shell. A typical value of 1 km/s turbulent motion (Diamond et al. Diam (1985)) corresponds to 0.7 mas/yr at a distance of 300 pc.
4 Discussion
One motivation to attempt the detection of the U Her motion by means of the OH maser, was the prediction that on the line of sight to the star the maser will amplify radio photons from the stellar surface (Norris et al. Norris (1984); Van Langevelde & Spaans Spaans2 (1993)). In a spherically symmetric shell with a constant outflowing velocity, the most blue-shifted part of the masering shell would then be amplifying a background source rather than spontaneous emission. Hence this would result in a spot with more maser beaming and thus brighter, more compact emission. The spot would be fixed to the stellar radio-photosphere (which could be as large as mas for U Her, while the visible photosphere is perhaps twice smaller) and probably be persistent over the years. It would also be observable in different maser lines, as the mechanism would work in a similar way for all transitions. It could still vary in flux with stellar cycle through changing pumping conditions.
This idea is confirmed by our results, although some issues remain unexplained. We find that the brightest and most compact features are all from the blue-shifted side of the shell. We find no high brightness red-shifted maser spots. Our wide-band data confirm the observation by Sivagnanam et al. (SivaAmpl (1990)) that the most blue-shifted 1667 MHz spot matches one of the 1665 MHz spots exactly. This spot at km/s also seems the most persistent. We managed to follow this 1667 MHz and corresponding 1665 MHz features for over 4 years. The size of the most blue-shifted spot is consistent with the estimated size of the stellar radio-sphere. Finally, and most importantly, we have been able to compare the radio and optical positions. The position of the most blue-shifted maser spot has been shown to match the Hipparcos optical position within the errors.
However, contrary to what would be expected, the most blue-shifted spot is not always the brightest or most compact; other spots at different velocities are dominant at different epochs. And not just the most blue-shifted 1667 MHz maser spot coincides with a 1665 MHz spot; almost of the other bright spots coincide with one as well. Furthermore, it should have been possible to describe the motion of the km/s spot, presumably fixed on the stellar position, with a simple trajectory. So, although our data is consistent with the amplified stellar image theory, the residuals of the fit may be indicative of more complex kinematics. A fixed maser spot could still show some random motion, as it drifts over the large surface of the radio-photosphere. The compact maser spot is a result of high beaming so small motions could result from minor changes of the maser path length due to variations in the pumping mechanism. This could also explain some of the relative motion between the spots. A correlation between stellar phase and these motions however cannot be determined. One other possibility is that U Her itself does not follow a simple trajectory because it is part of a binary or multiple system. All these mechanisms could give rise to residuals of the order of those observed. (, mas rms)
Another issue that remains is the high surface brightness of the multiple maser spots. The most blue-shifted spot can be explained by amplified emission from the stellar radio-photosphere, but it is not always the brightest spot. The brightness of these other spots cannot easily be explained by normal self-amplifying masering regions. Since they are also only seen at the blue-shifted side of the shell, and since they move along with the star, they can not be amplified sources from beyond the shell. They lie too far from the star to be amplifying part of a very extended stellar radio-photosphere. At least two other spots are too bright to be self-amplifying. Should U Her really be a multiple system, the high brightness spots could be the other components, amplified like U Her itself. The motion of a multiple system should also be visible in the separation of the spots at different epochs. There might be an indication of such systematic motion between two of the spots. The occurrence of multiple bright spots is a subject of further study in a larger sample of OH-masering stars and will also be studied in the 1612 MHz maser transition.
Although the precise nature of the additional compact blue-shifted emission features remains debatable, amplified stellar emission seems indeed to be the cause of the compact most blue-shifted maser spot. We are able to measure a proper motion derived from the VLBI maser spot which is consistent with the results from the Hipparcos satellite. The fit to the observed trajectories improves significantly when a parallax is included. The distance of pc determined with VLBI from a fit to the most blue-shifted OH spot is significantly smaller than the Chapman et al. Chapman (1994) estimate of 385 pc. It is somewhat smaller than the revised estimate of 280 pc by Alvarez & Mennesier (AlMe (1997)).
Acknowledgments: We thank Craig Walker for help verifying the correlator model used, Jim Brauher for carrying out some initial data reduction and Jean-Francois Lestrade and Bob Campbell for providing software to check our fitting procedures. This project is supported by NWO grant 614-21-007.
References
- (1) Alvarez, R., Mennesier, M.-O., 1997, AA, 317, 761.
- (2) Baudry, A., Mazurier, J.M., Perié, J.P., Requième, Y., Rousseau, J.M., 1990, AA, 232, 258.
- (3) Baudry, A., Lucas, R., Guilloteau, S., 1995, AA, 293, 594.
- (4) Bowers, P.F., Johnston, K.J., 1994, ApJSS, 92, 189.
- (5) Bowers, P.F., Johnston, K.J., de Vegt, C., 1989, ApJ, 340, 479.
- (6) Chapman, J.M, Sivagnanam, P., Cohen, R.J., Le Squeren, A.M, 1994, MNRAS, 268, 475.
- (7) Diamond, P.J., Kemball, A.J., Junor, W., Zensus, A., Benson, J., Dhawan, V., 1994, ApJ, 430, L61.
- (8) Diamond, P.J., Norris, R.P., Rowland, P.R., Booth, R.S., Nyman, L.-Å., 1985, MNRAS, 212, 1.
- (9) ESA, 1997, The Hipparcos and Tycho Catalogues, ESA SP-1200.
- (10) Lestrade, J.-F., Jones, D.L., Preston, R.A. et al., 1995, AA, 304, 182.
- (11) Ma, C., Shaffer, D.B., De Vegt, C., Johnston, K.J., Russell, J.L., 1990, AJ, 99, 1284.
- (12) Norris, R.P., Booth, R.S., Diamond, P.J., Nyman, L.A., Graham, D.A., Matveyenko, L.I., 1984, MNRAS, 208, 435.
- (13) Patnaik, A.R., Browne, I.W.A., Wilkinson, P.N., Wrobel, J.M., 1992, MNRAS, 254, 655.
- (14) Reid, M.J., Menten, K.M., 1997, ApJ, 476, 327.
- (15) Sivagnanam, P., Diamond, P.J., Le Squeren, A.M., Biraud, F., 1990, AA, 229, 171.
- (16) Van Langevelde, H.J., Spaans, M., 1993, MNRAS, 264, 597.
- (17) Wilkinson, P.N., Browne, I.W.A., Patnaik, A.R., Wrobel, J.M., Sorathia, B., 1998, MNRAS, 300, 790.
- (18) Wright, M.C.H., Carlstrom, J.E., Plambeck, R.L., Welch, W.J., 1990, AJ, 99, 1299.
- (19) Yates, J.A., Cohen, R.J., 1994, MNRAS, 270, 958.