2.5–11 micron spectroscopy and imaging of AGNs: ††thanks: Based on observations with ISO, an ESA projects with instruments funded by ESA member states (especially the PI countries: France, Germany, the Netherlands and the United Kingdom) and with the participation of ISAS and NASA
Abstract
We present low resolution spectrophotometric and imaging ISO observations of a sample of 57 AGNs and one non-active SB galaxy over the 2.5–11 m range. The sample is about equally divided into type I (; 28 sources) and type II (; 29 sources) objects. The mid-IR (MIR) spectra of type I (Sf1) and type II (Sf2) objects are statistically different: Sf1 spectra are characterized by a strong continuum well approximated by a power-law of average index with only weak emission features from Polycyclic Aromatic Hydrocarbon (PAH) bands at 3.3, 6.2, 7.7 and 8.6 m. In sharp contrast to Sf1s, most Sf2s display a weak continuum but very strong PAH emission bands, with equivalent widths (EW) up to 7.2 m. On the other hand, Sf1s and Sf2s do not have statistically different PAH luminosities while the 7 m continuum is on the average a factor 8 less luminous in Sf2s than in Sf1s. Because the PAH emission is unrelated to the nuclear activity and arises in the interstellar medium of the underlying galactic bulge, its EW is a sensitive nuclear redenning indicator. These results are consistent with unification schemes and imply that the MIR nuclear continuum source of Sf2s is, on the average, extinguished by visual magnitudes whereas it is directly visible in Sf1s. The dispersion in Sf2’s PAH EW is consistent with the expected spread in viewing angles. Those Sf2s with suffer from an extinction magnitudes and are invariably extremely weak X-ray sources. Such Sf2s presumably represent the highly inclined objects where our line of sight intercepts the full extent of the molecular torus. Conversely, about a third of the Sf2s have PAH EW m, in the range of Sf1s. Among them, those which have been observed in spectropolarimetry and/or in IR spectroscopy invariably display “hidden” broad lines. As proposed by Heisler et al (heisler (1997)), such Sf2s are most likely seen at grazing incidence such that one has a direct view of both the “reflecting screen” and the torus inner wall responsible for the near and mid-IR continuum. Our observations therefore constrain the screen and the torus inner wall to be spatially co-located. Finally, the 9.7 m Silicate feature appears weakly in emission in Sf1s, implying that the torus vertical optical thickness cannot significantly exceed . 111Tables 2,3,4 & 5 are only available in electronic form at the CDS via anonymous ftp to cdsarc.u-strasbg.fr (130.79.128.5) or via http://cdsweb.u-strasbg.fr/Abstract.html.
Key Words.:
Galaxies: active – Infrared: galaxies – Galaxies: Seyfert1 Introduction
According to “unified models” of Active Galactic Nuclei (AGN), Seyfert 1 and Seyfert 2 galaxies (hereafter Sf1 and Sf2) are essentially the same objects viewed at a different angle: Sf1s are observed close to face-on such that we have a direct view to the Broad emission Line Region (BLR) and the accretion disk responsible for the strong UV-Optical-X-ray continuum, whereas Sf2s are seen at an inclination such that our view is blocked by an optically thick dusty torus which surrounds the disk and the BLR (e.g. Antonucci antonucci (1993)). This model makes specific predictions. In particular, the UV photons from the disk which are absorbed by the grains in the torus should be re-emitted as thermal radiation in the IR. Several arguments constrain the torus inner radius to be of the order of 1 pc in which case the dust temperature should peak to about 700–1000 K and give rise to an emission “bump” between 2 and 15 m (Pier & Krolik pier (1992)). The model also predicts that the silicate 9.7 m feature should appear preferentially in absorption in Sf2s and in emission in Sf1s. In order to test these predictions and better constrain the model, we initiated a program of mid-IR (MIR) observations of a large sample of AGNs. Throughout this paper, we use . Unless otherwise stated, all quoted uncertainties correspond to 1- errors.
2 Observations
A sample of 57 AGNs and one non-active “normal” SB galaxy were observed with the ISOPHOT (Lemke et al. lemke (1996)) and ISOCAM (Cesarsky et al. 1996a ) instruments on board the Infrared Space Observatory (ISO; Kessler et al. kessler (1996)).
Table 1 lists all the sources successfully observed with ISO. Columns 1–3 give the most common name and equatorial coordinates, columns 4 & 5 the seyfert type and the redshift, respectively, while columns 6–8 list the instrument, the corresponding exposure time and start time of the observation. The redshifts and types are taken from the NED 222The NASA/IPAC Extragalactic Database (NED) is operated by the Jet Propulsion Laboratory, California Institute of Technology, under contract with the National Aeronautics and Space Administration.. The sample is drawn from the CfA hard X-ray flux limited complete sample (Piccinotti et al. piccinotti (1982)) but lacks the most well known objects (e.g. NGC~4151) which were embargoed by ISO guaranteed time owners. On the other hand, the sample was enriched in bright Sf2s. We caution that our sample is therefore not “complete” in a statistical sense. It is about equally divided into Sf1s (28 sources, including 2 QSOs) and Sf2s (29), where we define Sf1s as all objects of type 1.5 and Sf2s those whose type is 1.5. The mean and redshift are and for Sf1s and Sf2s. Excluding the two QSO’s (HS~0624+6907 and H~1821+643), the mean Sf1 redshift becomes 0.0240.015, not significantly different from that of Sf2s. At these mean redshifts, a 10 angular dimension projects onto a linear size at the source of 4.6 and 3.1 kpc, for Sf1 and Sf2 respectively.
For every object but two, the data-set consists of ISOCAM images obtained in staring mode through the LW2 and LW7 filters at 6.75 and 9.63 m respectively, with a 3 ″per pixel magnification, together with 2.5–11.8 m spectra obtained immediately before with the ISOPHOT-S low resolution () spectrograph. The images consist of arrays of pixels (i.e. ″) with an effective resolution (FWHM) of 3.8 ″and 4.5 ″, for the LW2 and LW7 filter, respectively. The exposure times per filter were always larger than 200 s, sufficiently long to ensure proper stabilization of the detectors. For the spectra, on-source measurements were alternated with sky measurements at a frequency of 1/256 Hz, with a chopper throw of . Through a common aperture, light is fed simultaneously to the spectrograph and short wavelength detector (ISOPHOT-SS: 2.5-4.8 m) and to the equivalent long wavelength channel (ISOPHOT-SL: 5.8–11.8 m). There is a detector gap between 4.8 and 5.8 m where no data can be recorded. IR~05189-2524 was observed twice with the ISOCAM, while 3C~390.3 and Ark~564 were observed with ISOPHOT-S only.
3 Data reduction, calibration & analysis
3.1 ISOCAM data
The ISOCAM images were reduced and calibrated using standard procedures of the CAM Interactive Analysis (CIA; Ott ott (1997)) software package 333CIA is a joint development by the ESA Astrophysics Division and the ISOCAM Consortium led by the ISOCAM PI, C. Cesarsky, Direction des Sciences de la Matiere, C.E.A., France. starting from the Edited Raw Data (ERD). The first few ( 4) readouts of each frame were discarded so as to retain only those data for which the detector throughput had reached 90 % of its stabilization level. The remainder of the processing involved the usual steps, i.e. dark current subtraction, flat-fielding, removal of particle hits (“de-glitching”) and flux calibration. All sources are detected at a very high significance level. Fluxes were obtained by integrating all the emission in a circle of 3 pixels radius () and subtraction of the background emission summed over an external annulus centered on the source. These fluxes were further multiplied by 1.23 to account for the emission in the wings of the PSF. In the case of extended sources (see below), the flux was integrated over a circle of radius of 4.5 pixels (13.5 ) with the same area as the ISOPHOT-S aperture. The resulting ISOCAM fluxes are listed in columns 2 and 4 of Table 2, where an “E” in the last column denotes extended sources. The flux accuracy is mainly limited by flat-fielding residuals and imperfect stabilization of the signal. It is typically % for fluxes greater than 200 mJy, 10 % for fluxes in the range 100–200 mJy and 15 % at lower intensity levels. This is confirmed by the two observations of the bright galaxy IR~05189-2524 for which the fluxes differ by only 5.5 % and 0.5 %, at 6.75 m and 9.63 m respectively (see table 2).
3.2 ISOPHOT-S data
The ISOPHOT-S data were reduced with the PHOT Interactive Analysis (PIA; 444PIA is a joint development by the ESA Astrophysics Division and the ISOPHOT Consortium led by the ISOPHOT PI, D. Lemke, MPIA, Heidelberg. Gabriel gabriel (1998)) software package. However, because ISOPHOT-S was operating close to its sensitivity limit, special reduction and calibration procedures had to be applied. During the measurement, the chopper mirror switches periodically between source and background. After such a change of illumination, the photocurrent of the Si:Ga photoconductors immediately changes to an intermediate level, followed by a slow characteristic transition to the final level. At the fainter fluxes, a few Janskys and below, the time constant of this transition is extremely long. In our case of chopped-mode observations with a frequency of Hz, the final asymptotic value is never reached and only the initial steps towards the final value are observed. These are practically equal to the intermediate level.

This allows to simplify the flux calibration procedure by determining a spectral response function for this particular mode and flux, thereby minimising possible systematic errors due to differences in instrument configuration between the observations of calibrator and galaxy. We derived this function from a chopped observation of a faint standard star HD 132142 (TDT 63600901) of similar brightness to our objects, whose flux ranges from 0.15 to 2.54 Jy. The measurement was performed with the same chopper frequency and readout-timing as the AGN observations. The of the ISOPHOT-S spectra was considerably enhanced by two additional measures: ) the 32-s integration ramps were divided into sub-ramps of 2 sec, to provide enough signals per chopper plateau for the statistical analysis and to keep the loss of integration time low when de-glitching, i.e. when removing ramps affected by cosmic ray hits. ) after fitting slopes to all sub-ramps, and removal of outliers (de-glitching) with PIA, the mean signal (slope) for each pixel was determined separately for on- and off-source pointings by fitting gaussians to the signal histograms. This corrects for the remaining asymmetry in the signal distribution, i.e. the tail of the distribution towards higher values due to non-recognised glitches is ignored and the result is closer to the median. We did not use the median itself because the digitisation of the voltages leads to signal-quantisation effects at small fluxes. The difference of on- and off-source signals was then divided by our spectral response function to derive fluxes expressed in Janskys. Taking into account the accuracy of the model-SED of the stellar calibrator (Hammersley 1995, priv. comm., see also Hammersley hamm98 (1998)) and the reproducibility of the measurements (Schulz schulz99 (1999)), the flux calibration is accurate to within % (1-), except at wavelengths 10 m, where the flux of HR 132142 is weakest and the noise in the calibration measurement dominates. This agrees also with the accuracies given in Klaas et al. (klaas (2000)). The individual spectra will be published in a separate paper (Schulz et al. schulz (2000)) and can be provided on request.

3.3 Comparison of ISOCAM & ISOPHOT-S fluxes
To check the reliability of our calibration, the ISOCAM and ISOPHOT-S results were compared as follows. The total ISOPHOT-S flux in the LW2 and LW7 bands were computed by integration of the signal over the nominal band-pass of the filters, 5.00–8.50 m and 8.50–10.70 m, respectively. The exact shape of the filter spectral response is somewhat uncertain and the LW2 band-pass extends over the data-gap between ISOPHOT-SS and ISOPHOT-SL detector arrays. The integration was performed assuming a simple rectangular profile for the filter and interpolating the power-law continuum (see next section) over the 4.8–5.8 m data gap. The resulting ISOPHOT-S fluxes are listed in columns 3 & 5 of Table 2. The projected linear dimension in kilo-parsec sustained by a 10 angle is given for convenience in column 6. The ISOCAM and ISOPHOT-S fluxes are in good agreement, especially given the crudeness of the integration method and the assumption about the data gap. The mean ratios of the ISOPHOT-S to the ISOCAM nuclear flux are 0.87 ( 0.15, r.m.s.) and 1.07 ( 0.20) at 6.75 and 9.63 m respectively. Neither ratio differs significantly from unity. Our crude interpolation method, which neglects emission above the continuum, is at least partly responsible for the fact that the 6.75 m ratio is smaller than one (at the 0.9- level only). Averaged over the whole sample, the mean relative difference between the ISOCAM and ISOPHOT-S fluxes amount to 16 % for both filters. Selecting only those sources with a flux larger than 100 mJy, the difference decreases to 14 %, as expected. These figures are quite close to the quadratic sum of the uncertainties on the ISOCAM and ISOPHOT-S fluxes, thereby confirming the reliability of our calibration and error estimates.
3.4 Extended sources
The 14 extended sources are listed in Table 3 where columns 2–7 give the estimated nuclear flux, the flux in the ISOPHOT-S aperture and the total flux from the galaxy in the two ISOCAM filters. Column 8 lists the spatial extension of the source obtained by averaging the FWHM of the LW2 and LW7 images, while comments in column 9 provide a brief morphological description of the object. In the case of NGC~5953, the galaxy is compact (4 pixels FWHM) with an approximately gaussian flux distribution and no well defined point-source. In this case, no nuclear flux can be derived. For the other sources, the nuclear flux was obtained by deconvolution. Apart from NGC~1097 which is clearly extended, all other sources are compact and smaller than the entrance of the ISOPHOT-S spectrograph. Averaged over the whole sample, the ratio of the nuclear flux to the flux in the ISOPHOT-S aperture is 0.77 and 0.79, at 6.75 and 9.63 m respectively. This implies that even for these extended sources, the ISOPHOT-S spectrum is dominated by the nuclear emission, with a 20–25 % contribution from the underlying galaxy. The mean ratio of the ISOPHOT-S flux to the total flux from the galaxy is 0.75 at 6.75 m and 0.71 at 9.63 m. This further implies that the extended MIR emission is relatively weak compared to the flux from the central bulge and nucleus and that the bulk of it is anyway recorded in the ISOPHOT-S spectrum. Hence, the redshift bias noted earlier should not have a significant impact on the ISOPHOT-S spectra.
3.5 Analysis
The typical spectrum of a Sf1 (Mrk~509) is shown in Fig. 1 and that of a Sf2 (NGC~5953) in Fig. 2. The MIR spectrum of a Sf2 is characterized by very strong emission features with well defined peaks at 6.2, 7.7 and 8.6 m, usually ascribed to Polycyclic Aromatic Hydrocarbon (PAH) bands. The weaker 3.3 m band is also detected in most sources and, in galaxies of adequate and redshift, the blue side of the strong 11.3 m PAH feature also shows up as a sharp rise in flux toward the long wavelength end of the ISOPHOT-S array. Though much weaker, the PAH emission bands are also present in Sf1s
As can be judged from Fig. 1, the continuum of a Sf1 is well approximated by a power-law (). The continuum of a Sf2 is less well defined but in the absence of a better prescription and for the sake of consistency, we also adopted a power-law functional form to fit the continuum of type 2 sources. The results of the fit are given in Table 4, were we list the spectral index and the continuum flux at a fiducial wavelength of 7 m in the rest frame of the object. No correction for foreground redenning in the milky way was applied as it is negligible at this wavelength. The error on the flux is estimated to be 10 % and the uncertainty on the spectral index 0.05 for Sf1s and 0.1 for Sf2s.
The flux and equivalent widths (EW) of the PAH emission bands were measured by integrating all the flux above the best fit power-law continuum in the following pre-defined wavelength range (rest frame of the source): 3.22–3.35 m, 5.86–6.54 m, 6.76–8.30 m and 8.30–8.90 m for the 3.3, 6.2, 7.7 and 8.6 m PAH band, respectively. In addition, the total PAH flux (excluding the weakest 3.3 m feature) was computed by integration over the range 5.86–8.90 m. The results are given in Table 4 and Table 5. The errors quoted represent the quadratic sum of the statistical uncertainties attached to each spectral data-point in the integration interval. The ISOCAM images of ESO~137-G34 show a star at a distance of 12 from the nucleus, with a flux of 124 and 81 mJy at 6.75 m and 9.63 m respectively. Emission from this star therefore contaminates the ISOPHOT-S spectrum. This contamination shows-up as an excess of short wavelength emission which completely dominates the spectrum for m. The parasitic spectrum was crudely estimated by fitting a straight line to the excess over the 2.5–4.5 m range and removed from the ISOPHOT-S spectrum of ESO 137-G34. For this object, the continuum and line parameters are therefore subject to larger uncertainties than the rest of the sample.
4 The difference between Sf1 and Sf2
A comparison of Fig. 1 and Fig. 2 reveals that the MIR spectrum of a typical Sf1 is markedly different from that of a Sf2: while Sf1s have a strong continuum with only weak PAH emission, most Sf2s are characterized by a weak continuum but very strong PAH emission. This difference is confirmed by a detailed statistical analysis. In Sf1s, the average equivalent width of the strongest of the PAH band at 7.7 m is , where the error refers to the dispersion about the mean. This is 5.4 times smaller than the average equivalent width in Sf2s, . Similarly, the equivalent width of the sum of the 3 strongest PAH features is in Sf1s, compared to in Sf2s. The mean equivalent widths of the two populations and their variances are statistically different at the and confidence level, respectively.
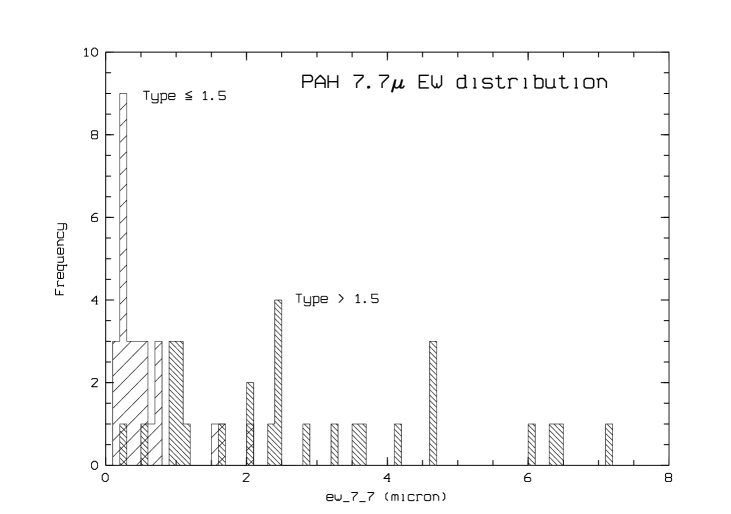
The distribution of the m PAH band EW is shown in Fig. 3. It clearly illustrates that Sf1s and Sf2s have different EW distributions: Sf1s are confined to a small range of EW with a maximum of 2.0 m whereas Sf2s EW extend all the way up to a maximum of 7.2 m. A two-tail Kolmogorov-Smirnov (KS) test confirms that the Sf1 and Sf2 EW distributions are statistically different at the confidence level.
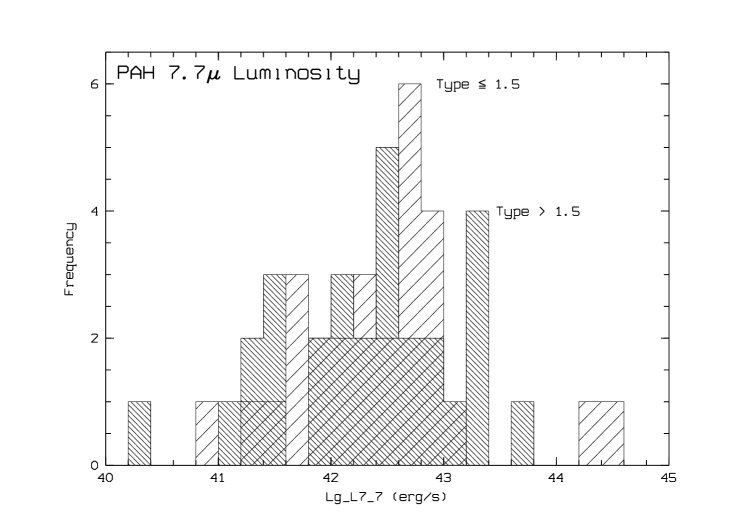
As can be seen from Fig. 4 however, the distribution of the 7.7 m PAH luminosity is the same for Sf1s and Sf2s, at the 64 % confidence level (KS test). The mean () 7.7 m PAH luminosity of Sf1s is , not statistically different (at the 39 % confidence level) from that of Sf2s, .
On the other hand, the average 7 m continuum luminosity of Sf1s is nearly 8 times smaller than that of Sf2s, . A KS test confirms that the luminosity distribution is also different for the two populations, at the confidence level. The average continuum spectral index is however not statistically different in Sf1s () and Sf2s () and a KS test confirms that the distribution of indices is the same in the two populations at the 69 % confidence level.
It must be stressed that selection effects cannot account for the difference between Sf1s and Sf2s. First, the mean redshift and projected linear size of the two populations is not statistically different if one excludes the two QSOs. Second, as noted in section 3.4, all sources are relatively compact and smaller than the entrance of the PHT-S spectrograph, except NGC 1097. Third, the difference in PAH EW persists if one considers individual pairs of Sf1s and Sf2s with similar redshift. For instance, the Sf1 NGC~4051 and Sf2 NGC~5033 have very similar redshift (0.00242 versus 0.00292, respectively), but the 7.7 m PAH band EW of the latter, 2.394 m is 5.6 times larger than that of the former (0.428 m).
5 Implications for unified schemes
The simplest explanation of the above observational results is that the MIR continuum is depressed in Sf2s relative to Sf1s. Indeed, a depressed continuum accounts for both the larger PAH EW and the reduced continuum luminosity of type 2 AGNs. This interpretation is consistent with the weak anti-correlation that exists between the 7.7 m PAH EW and the 7 m continuum luminosity, significant at the confidence level (Kendall rank order coefficient = -0.358). The most likely reason for the continuum depression is obscuration by dust, as postulated by unification schemes. The reddening law is essentially grey from 3 to 11 m and does not alter significantly the shape of the continuum. Hence, the obscuration hypothesis is consistent with Sf1 and Sf2 having the same spectral index on the average. On the other hand, we have seen that the PAH luminosity is the same in Sf1s and Sf2s. This further requires that the region responsible for the PAH emission is located outside the screen that absorbs the MIR (and optical-UV) continuum. In other words, the screen must be located in the immediate vicinity of the nucleus such that it absorbs the 7 m continuum but leaves the PAH emission unaffected. Again, this is consistent with unification schemes and with the molecular torus hypothesis. We have made here the implicit assumption that the MIR continuum observed in Sf1s is of nuclear origin. There is strong observational support for this hypothesis:
-
•
Up to at least 3.4 m, the near-IR continuum of AGNs is known to be variable, indicating a compact emission source (e.g. Neugebauer et al. neugebauer (1989)). Furthermore, in F~9 (Clavel Wamsteker & Glass clavel (1989)), GQ~COMAE (Sitko, Sitko & Siemiginowska sitko (1993)), NGC~1566 (Baribaud et al. baribaud (1992)) and NGC~3783 (Glass glass (1992)), the variations follow closely those of the optical and ultraviolet continuum with a delay of a few months to one year, which is commensurate with the photon travel time to the dust sublimation radius. Such observations are a strong indication that the 1.25–3.4 m flux of radio-quiet AGNs originates from thermal emission by dust grains located in the immediate vicinity of the central engine, presumably at the torus inner edge.
-
•
AGNs have warm 12 to 100 m colors, clearly different from those of “normal” non-active galaxies (e.g. Miley Neugebauer & Soifer miley (1985)) which indicates that the 12 m emission is associated with the nuclear activity
In the following, we have therefore assumed that the MIR continuum of Sf1s originates from thermal emission by dust grains located at the inner edge of the molecular torus.
This leaves the origin of the PAH emission unclear. PAH emission is ubiquitous throughout the interstellar medium of our galaxy, in particular in star forming region and reflection nebulae (Verstraete et al. verstraete (1996); Cesarsky et al. 1996b ; Cesarsky et al 1996c ) and galactic cirrus (Mattila et al. mattila (1996)). PAH emission bands are also conspicuous in normal late type galaxies (Xu et al. xu (1998); Boulade et al. boulade (1996); Vigroux et al. vigroux (1996); Metcalfe et al. metcalfe (1996); Acosta-Pulido et al. acosta (1996)). Hence, the PAH emission bands seen in AGN spectra most probably arise in the general ISM of the underlying galaxies, more specifically in its bulge given that nearly all sources have low redshifts and are unresolved at the 4–5 ″resolution of ISOCAM.

To check this hypothesis, we overlay in Fig. 5 the spectrum of the typical Sf2 spectrum of NGC~5953 on top of the spectrum of the normal SB galaxy NGC~701 (scaled by a factor 0.5). The two spectra are virtually indistinguishable. Moreover, the 7.7 m PAH EW in NGC 701, 5.88m as well as the luminosity, , are well within the range spanned by Sf2s. This confirms that the PAH emission is not related to the activity in the nucleus. Note also that the continuum in the two objects matches perfectly. This further implies that, at least in NGC 5953, the nuclear continuum is completely extinguished and the faint residual we observe originates from outside the active nucleus. The origin of this faint continuum in normal galaxies is currently a matter of debate. However, the fact that it appears to correlate tightly with the PAH feature, possibly indicate a common origin (Xu et al. xu (1998)). Our results are at odds with those of Malkan, Gorjian & Tam (malkan (1998)) who conclude that Sf1s and Sf2s differ in galaxy type and infer that much of the extinction occurs in the ISM, at larger radii than the molecular torus. We note however, that the statistical evidence for a difference in spectral types between the host of Sf1s and Sf2s in the Malkan et al. sample is marginal.

6 The obscuration of Seyfert 2 galaxies
Since the PAH emission is not obscured by the torus while the MIR continuum of Sf2s is, the PAH EW is a de-facto indicator of the nuclear extinction. According to unification schemes, the extinction through which we see the nucleus depends on the orientation of the torus with respect to our line of sight. One therefore expects a spread in Sf2 PAH EW, as is indeed observed (Fig. 3). The small EW sources correspond to the low inclination case where our line of sight intercepts only the upper layers of the torus, while the large EW Sf2s are the sources seen close to edge-on where our line of sight to the nucleus intercepts the full extent of the torus. In such object, like NGC 5953, the MIR nuclear emission is completely absorbed and we are left with the spectrum of a normal galactic bulge, such as that of NGC 701. According to unification schemes, the MIR continuum of Sf1s should not suffer from extinction since we have a direct view of the torus inner edge. We can therefore use the ratio R of the average PAH EW in Sf1s and in Sf2s to estimate the average MIR extinction of type 2 AGNs. This ratio for the strongest PAH band at 7.7 m is , where the error quoted reflects the dispersion of Sf2 EWs. This implies that the continuum of Sf2s suffers on the average from magnitudes of extinction at 7.7 m. This translates into a visual extinction magnitudes (Rieke and Lebofsky rieke (1985)). For a normal gas to dust ratio, this corresponds to an average X-ray absorbing column, (Gorenstein gorenstein (1975)). The latter is in good agreement with the mean Sf2 absorbing column as measured directly from X-ray data by Mulchaey et al. (mulchaey (1992)), or Smith and Done (smith (1996)), . This excellent agreement should be seen more as a consistency check of our assumptions and a validation of unified schemes than an accurate determination of the torus optical depth. First, as mentioned earlier, it represents a mean value of the extinction averaged over the range of viewing angles, from grazing incidence to edge-on. Second, there is an intrinsic spread in the luminosity of the PAH emission, as illustrated by Fig. 4 which introduces uncertainties in this estimate. Third, in sources like NGC 5953 where the MIR continuum is totally absorbed, the PAH EW only provides a lower-limit of the true extinction.
6.1 The highly obscured, large PAH EW Sf2s

From the 29 Sf2s in our sample, 4 have , in the range of a normal galaxy. This suggests that about 14 % of Sf2s suffer from extinction in excess of 125 visual magnitudes, sufficient to block-out the mid-IR continuum. These extreme Sf2s are presumably those where the torus symmetry axis lies in the plane of the sky. The 4 galaxies are IC~4397, ESO~137-G34, NGC~5728 and NGC 5953. If our conclusions are correct, such extreme Sf2s should be heavily absorbed in the X-rays, with hydrogen column densities in excess of . Since for such cases the PAH EW ratio only provides a lower limit to the extinction, these galaxies could even be compton thick (i.e. ) and opaque to X-rays below 10 keV. In order to verify this prediction, we have searched the literature and the NED for X-ray data on these sources. IC 4397 and ESO 137-G34 have no entry in the ROSAT data-base nor in the EINSTEIN catalog of IPC sources (Burstein et al. burstein (1997)), presumably because they are too faint to have been detected. NGC 5728 is not in the ROSAT data-base but appears in the IPC catalog with a 0.5–4.5 keV luminosity , in the range of luminous non-active galaxies. NGC 5953 coincides with the ROSAT HRI source 1RXH J153432.5+151137. Its 0.5–2 keV luminosity can be accounted for entirely by integrated stellar emission. It therefore appears that our predictions are borne by existing X-ray data and that these 4 large PAH EW Sf2s are indeed X-ray faint and probably compton thick. The next three largest PAH EW Sf2s are NGC~1667, Mrk~673 and NGC~5674. They have 7.7 m PAH EW of the order of 4.6 m, smaller than that of the normal galaxy NGC 701, but still a factor of 10 larger than Sf1’s. NGC 1667 was observed with ASCA by Turner et al. (1997a ) who report luminosities of and over the 2–10 keV and 0.5–2 keV range, respectively, well within the range of inactive galaxies. Furthermore, according to these authors,

68 % of the X-ray flux in this galaxy can be accounted for by a thermal component due to the integrated stellar emission from a starburst. Mrk 673 appears in Burstein et al. (burstein (1997)) with an upper limit to its 0.5–4.5 keV luminosity. Mrk 673 also coincides with the ROSAT PSPC source WGA J1417.3+2651 with a 0.5–2 keV luminosity , again consistent with a mostly stellar origin. Finally, NGC 5674 may represent the first Sf2 where one starts seeing through the torus, since its X-ray absorbing column could be measured with Ginga, (Smith & Done smith (1996)). To summarize, all large PAH EW Sf2s are faint and heavily absorbed in the X-rays, as predicted by unification schemes.
6.2 The low obscuration, small PAH EW Sf2s
Ten Sf2 galaxies have 7.7 m PAH EW m, in the range occupied by Sf1s (fig 3). The spectrum of Mrk 3 is shown in Fig.6 as an example of such a small PAH EW Sf2. Among these ten Sf2s, four have been observed in spectropolarimetry and/or near IR spectroscopy (Heisler et al. heisler (1997); Young et al. young (1996); Veilleux Goodrich & Hill veilleux (1997)). All four galaxies display broad-lines in polarized light. These are Mrk~3, NGC~7674, IRAS~05189-2524 and NGC~4388. Conversely, none of the three Sf2s with 7.7 m PAH EW m for which spectropolarimetric or IR spectroscopic data exist (Mrk~266, NGC~5728, NGC~1097) exhibit “hidden” broad lines. This confirms the finding of Heisler et al. (heisler (1997)) that the Sf2s which have “hidden” BLR (i.e. seen in spectropolarimetry or in direct IR spectroscopy) are those where our line-of-sight grazes the torus upper layer such that we have a direct view of the reflecting mirror but not of the BLR. As discussed previously, the MIR continuum most likely originates from thermal emission by hot dust grains located on the inner wall of the torus. Hence, the fact that the “hidden” BLR Sf2s are the same sources which exhibit a Sf1-like MIR continuum further constrains the mirror and the torus inner wall to be in neighbouring regions. It is in fact conceivable that the mirror is the wall itself or a wind of hot electrons boiled-off the torus surface. It is interesting to note that these “hidden” BLR Sf2s remain heavily absorbed in the X-rays while their MIR continuum apparently does not suffer from a significant amount of extinction. For instance, Mrk 3 has an X-ray absorbing column (Turner et al 1997b ) corresponding to a 7 m extinction of 9 magnitudes, amply sufficient to block-out the MIR continuum. Nevertheless, the MIR continuum of Mrk 3 (see Fig.6) is hardly absorbed. This indicates that our line-of-sight to the X-ray source is different from our line-of-sight to the MIR source, the former intercepting a much larger fraction of the torus than the latter. As predicted by unified schemes, this confirms that the X-ray source (like the BLR and the disk) is embedded further down the throat of the torus than the mirror and the wall emitting the MIR continuum.
As a final remark, we note that MIR spectral characteristics do not allow to distinguish between type 1.8, 1.9 and type 2 objects. For instance, the sub-class of small PAH EW Sf2s include sources such as Mrk~3 and NGC~4507 which are bona-fide type 2 Seyferts. Conversely, NGC~5674 and Mrk~334 are classified as type 1.9 and 1.8 Seyfert galaxies whereas their 7.7 m PAH band EW is as large as 4.6 m and 2.6 m, respectively. Similarly, we do not find significant differences between Broad-Line Radio-Galaxies (BLRG) and genuine radio-quiet Sf1s. Indeed, 3C~382 and 3C~390.3 have 7.7 m PAH EW of 0.30 and 0.22 m respectively, close to the Sf1’s average (m). Last, two sources in our sample qualify as “Narrow-Line Seyfert 1” (NLS1) galaxies, Ark~564 and Mrk~507 (Boller, Brandt & Fink boller (1996)). With a 7.7 m PAH EW of 0.26 and 0.59 m respectively, their MIR spectrum is undistinguishable from that of “normal” Sf1s.
Our scheme seems to be supported by the few published ISO spectra of Sf2 galaxies. The Circinus galaxy displays broad emission (Oliva et al. oliva (1998)) in polarized light while its MIR spectrum reveals a strong continuum with relatively weak () PAH emission bands (Moorwood et al. moorwood (1996)). NGC 1068, the prototype Sf2 galaxy with a “hidden BLR” also has weak PAH emission features (Genzel genzel (1998)). Finally, IRAS 05189-2524 (Watson et al. watson (1999)) has moderate strength PAH emission bands (EW m) together with polarized broad-lines (Young et al. young (1996)).
7 The silicate 9.7 micron feature
In individual spectra, there are hints of a spectral curvature around 9.7 m, the expected wavelength of the silicate dust feature. However, the local continuum in the spectral range m is difficult to define due to the proximity of the 8.6 m and 11.3 m PAH emission bands. Moreover, the ratio decreases rapidly as one approaches the long wavelength end of the ISOPHOT-S array. Finally, the silicate feature itself appears to have a complex profile with a narrow absorption (possibly of galactic origin) superimposed on a broader emission line. Attempts measuring its strength usually yield insignificant detections. To overcome this limit and increase the signal-to-noise ratio, we have computed the average MIR spectrum of a Sf1 and a Sf2 galaxy separately. Fig. 7 shows the mean Sf1 spectrum obtained by normalizing and averaging the rest wavelength spectra of all 20 type AGNs with a signal-to-noise ratio per pixel large than 7, while Fig. 8 displays the average of the 23 Sf2 spectra with . In the mean Sf1 spectrum, the silicate 9.7 m feature appears in emission with an equivalent width . This immediately rules out models with very large torus optical depths. In the model of Pier and Krolik (pier (1992)) for instance, the strength of the silicate feature is calculated as a function of inclination and of the vertical and radial Thomson optical depth, and respectively. Reading from their figure 8, models with and/or are ruled-out as they predict the silicate feature in absorption. For an average Sf1 inclination , the best fit to suggests and . A unit Thomson optical depth corresponds to a column density . While these figures are somewhat model dependent, it is reassuring that they agree with our independent estimate of based on the PAH EW ratio. The PAH bands are so strong in Sf2s that placing the continuum at 9.7 m becomes a subjective decision. The mean Sf2 spectrum (Fig. 8) shows a weak maximum at 9.7 m and a shallow minimum near 10 m. In the absence of longer wavelengths data, one can only set a provisional upper limit of 0.32 m to the silicate EW in Sf2s, whether in absorption or in emission. It must be emphasized that the limitation is not the S/N but the uncertainty in placing the local continuum.
8 Summary and conclusions
A sample of 57 AGNs and one normal SB galaxy (NGC 701) were observed with the ISOPHOT-S spectrometer and the ISOCAM imaging camera. The sample is about equally divided into Sf1s (28) and Sf2s (29), where we define Sf1s as all objects of type and Sf2s those whose type is . The observations show that:
-
1.
Forty-four of the 57 AGNs in the sample appear unresolved at the resolution of ISOCAM. Of the 13 resolved sources, 12 are sufficiently compact to ensure that all of the flux falls into the ISOPHOT-S spectrograph aperture. Moreover, even in these resolved sources, nuclear/bulge emission contributes for at least 3/4 th of the light recorded with ISOPHOT-S.
-
2.
The spectrum of Sf1s is characterized by a strong continuum and weak Polycyclic Aromatic Hydrocarbon (PAH) emission bands at 3.3, 6.2, 7.7 and 8.6 m. The continuum is well described by a power-law of average index .
-
3.
In sharp contrast with Sf1s, Sf2s generally have a weak continuum with very strong PAH emission bands.
-
4.
The distribution of PAH equivalent widths (EW) is statistically different in Sf1s and Sf2s. The average EW for the strongest band at 7.7 m is m in Sf1s versus m in Sf2s. Moreover, the distribution of PAH EW in Sf1s is confined to values smaller than 2.0 m whereas that of Sf2s extends from 0.24 m up to 7.2 m.
-
5.
There are however no statistical differences in the PAH luminosity distribution of Sf1s and Sf2s.
-
6.
The 7 m continuum is on the average a factor 8 less luminous in Sf2s than in Sf1s.
-
7.
The PAH emission is not related to the activity in the nucleus and originates in the interstellar medium of the underlying galactic bulge. The PAH EW can therefore be used as a nuclear redenning indicator.
-
8.
The above results are consistent with unification schemes and imply that the MIR continuum of Sf2s suffers from an average extinction of visual magnitudes. This corresponds to an average hydrogen absorbing column , in good agreement with X-ray measurements. The large dispersion in the Sf2s EW is consistent with the expected spread in viewing angles.
-
9.
The spectrum of Sf2s whose 7.7 m PAH band EW exceeds 5 m is indistinguishable from that of a normal non-active galaxy, implying that the MIR continuum is completely obscured in these sources ( magnitudes). Without exception, these Sf2s are also heavily absorbed in the X-rays and probably “compton thick”. These large PAH EW Sf2s are presumably those where the torus is seen edge-on.
-
10.
Ten Sf2s have 7.7 m PAH EW m, in the range of Sf1s. Of these ten, four have been observed in spectropolarimetry and all four display “hidden” broad lines. Conversely, none of the three Sf2s with PAH EW m which have been observed in spectropolarimtery display “hidden” broad lines. This confirms the finding of Heisler et al. (heisler (1997)) that those Sf2s with a “hidden” BLR are those for which our line-of-sight grazes the upper surface of the torus. In these sources, we have a direct view of both the reflecting mirror and of the torus inner wall responsible for the MIR continuum. Thus, our observations strongly favour a model where the “mirror” and the torus inner wall are spatially co-located. It is in fact conceivable that the mirror is the torus inner wall itself or a wind of hot electrons boiled-off its surface by radiation pressure.
-
11.
The silicate 9.7 m feature appears weakly in emission in Sf1s. This implies that the torus cannot be extremely thick and the average silicate EW (m) suggests that the total hydrogen column integrated along the torus vertical axis lies in the range , consistent with our previous estimate based on the Sf2 PAH EW.
-
12.
As far as their MIR properties are concerned, AGNs of intermediate types 1.8 and 1.9 are indistingishable from genuine SF2s, whereas Narrow Line Seyfert 1 (NLS1) and Broad-Line Radio-Galaxies (BLRG) behave as normal SF1s.
The sketch outline in this paper makes specific predictions. First, Sf2s which have 7.7 m PAH EW in excess of m should never exhibit broad-lines in spectropolarimetry. Second, these sources should always be heavily absorbed in the X-rays, possibly up to 10 keV. Third, Sf2s whose PAH EW m should exhibit broad lines when observed in spectropolarimetry and/or direct IR spectroscopy. This last prediction seems to be borne by the few existing ISO observations of Sf2 with a “hidden” BLR
References
- (1) Acosta-Pulido, J. A. et al., 1996, A&A 315, L121
- (2) Antonucci, R., 1993, ARA&A 31, 473
- (3) Baribaud, T. et al. 1992, A&A 256, 375.
- (4) Boller, Th., Brandt, W.N., and Fink, H., 1996, A&A 305, 53
- (5) Boulade, O. et al. 1996, A&A 315, L85
- (6) Burstein, D., 1997, ApJS 111, 163
- (7) Cesarsky, C. P. et al., 1996a, A&A 315, L32
- (8) Cesarsky, C. J. et al., 1996b, A&A 315, L305
- (9) Cesarsky, C. J. et al., 1996c, A&A 315, L309
- (10) Clavel, J., Wamsteker, W. and Glass, I. S. 1989, ApJ 337, 256
- (11) Gabriel, C. 1998, PHOT Interactive Analysis Users Manual, 3rd ed., http://www.iso.vilspa.esa.es/manuals
- (12) Genzel, R. et al., 1998, ApJ 498, 579
- (13) Glass, I. S. 1992, MNRAS 256, 23P
- (14) Gorenstein, P., 1975, ApJ 198, 95
- (15) Hammersley, P. L. et al., 1998, A&AS, 128, 207
- (16) Heisler, C. A. et al., 1997, Nat 385, 700
- (17) Kessler, M. F. et al., 1996, A&A 315, L27
- (18) Klaas, U. et al., 2000, ISOPHOT Calibration Accuracies SAI/1998-092/Dc, Version 3.0, January 2000, available at http://isowww.estec.esa.nl/users/expl_lib/PHT_top.html
- (19) Lemke, D. et al., 1996, A&A 315, L64
- (20) Malkan, M. A., Gorjian, V., Tam, R., 1998, ApJS 117, 25
- (21) Mattila, K. et al., 1996, A&A 315, L353
- (22) Metcalfe, L. et al., 1996, A&A 315, L105
- (23) Miley, G. K., Neugebauer, G., Soifer, B. T., 1985, ApJ 293, L11
- (24) Moorwood, A. F. M. et al., 1996 A&A 315, L109
- (25) Mulchaey, J. S., Mushotzky, R. F., Weaver, K. A., 1992, ApJ 390, 69
- (26) Neugebauer, G. et al., 1989, AJ 97, 957
- (27) Oliva, E. et al., 1998, A&A 329, L21
- (28) Ott, S. et al., 1997, in proceedings of the “Astronomical Data Analysis Software & Systems Conference - VI”, Hunt, G. & Payne, H. Eds, ASP Conf. Ser. 125.
- (29) Piccinotti, G. et al., 1982, ApJ 253, 485
- (30) Pier E. A., Krolik J. H., 1992, ApJ 401, 99
- (31) Rieke, G. H., Lebofsky, M. J., 1985, ApJ 288, 618
- (32) Schulz, B., 1999, Long-term Responsivity Stability of ISOPHOT-S, May 1999, available at http://www.iso.vilspa.esa.es/users/expl_lib/PHT_list.html
- (33) Schulz, B. et al., 2000 (in preparation)
- (34) Sitko, M. L., Sitko, A. K., Siemiginowska, A., 1993, ApJ 409, 139
- (35) Smith, D. A., Done, C., 1996, MNRAS 280, 355
- (36) Turner, T. J. et al., 1997, ApJS 113, 23
- (37) Turner, T. J. et al., 1997, ApJ 488, 164
- (38) Verstraete, L. et al., 1996, A&A 315, L337
- (39) Veilleux, S., Goodrich, R. W., Hill, G. J., 1997, ApJ 477, 631
- (40) Vigroux, L. et al., 1996, A&A 315, L93
- (41) Watson, D. et al., 1999, in preparation
- (42) Xu, C. et al., 1998, ApJ 508, 576
- (43) Young, S. et al., 1996, MNRAS 281, 1206
| TARGET | RA | Dec | Type | z | INS | Start Time | |
|---|---|---|---|---|---|---|---|
| (J2000) | (J2000) | (s) | (UT) | ||||
| Mk 334 | 00h 03m 09.5s | +21d 57’ 35.8” | 1.8 | 0.02196 | PHT | 2368 | 12 12 1996 00:22:43 |
| Mk 334 | 00h 03m 09.5s | +21d 57’ 35.8” | 1.8 | 0.02196 | CAM | 568 | 12 12 1996 00:59:23 |
| Mk 335 | 00h 06m 19.5s | +20d 12’ 10.7” | 1.0 | 0.02564 | PHT | 1344 | 12 12 1996 01:09:39 |
| Mk 335 | 00h 06m 19.5s | +20d 12’ 10.7” | 1.0 | 0.02564 | CAM | 568 | 12 12 1996 01:29:13 |
| Fairall 9 | 01h 23m 45.9s | -58d 48’ 21.0” | 1.0 | 0.04702 | PHT | 1344 | 06 05 1996 09:08:42 |
| Fairall 9 | 01h 23m 45.9s | -58d 48’ 21.0” | 1.0 | 0.04702 | CAM | 568 | 06 05 1996 09:28:16 |
| NGC 526A | 01h 23m 54.2s | -35d 03’ 55.9” | 1.5 | 0.01922 | PHT | 2368 | 24 11 1996 02:37:19 |
| NGC 526A | 01h 23m 54.2s | -35d 03’ 55.9” | 1.5 | 0.01922 | CAM | 568 | 24 11 1996 03:13:59 |
| NGC 701 | 01h 51m 03.7s | -09d 42’ 10.4” | SB | 0.00610 | PHT | 4416 | 17 12 1997 23:24:55 |
| NGC 701 | 01h 51m 03.7s | -09d 42’ 10.4” | SB | 0.00610 | CAM | 568 | 18 12 1997 00:35:41 |
| Mk 590 | 02h 14m 33.6s | -00d 46’ 00.0” | 1.5 | 0.02638 | PHT | 1344 | 03 07 1997 14:51:53 |
| Mk 590 | 02h 14m 33.6s | -00d 46’ 00.0” | 1.5 | 0.02638 | CAM | 568 | 03 07 1997 15:11:27 |
| NGC 1097 | 02h 46m 19.1s | -30d 16’ 28.2” | 2.0 | 0.00425 | PHT | 832 | 01 01 1997 02:09:46 |
| NGC 1097 | 02h 46m 19.1s | -30d 16’ 28.2” | 2.0 | 0.00425 | CAM | 568 | 01 01 1997 02:20:48 |
| NGC 1125 | 02h 51m 40.4s | -16d 39’ 02.2” | 2.0 | 0.01100 | PHT | 2368 | 01 02 1998 13:06:11 |
| NGC 1125 | 02h 51m 40.4s | -16d 39’ 02.2” | 2.0 | 0.01100 | CAM | 568 | 01 02 1998 13:42:51 |
| NGC 1241 | 03h 11m 14.7s | -08d 55’ 19.3” | 2.0 | 0.01351 | PHT | 4416 | 04 01 1998 13:52:47 |
| NGC 1241 | 03h 11m 14.7s | -08d 55’ 19.3” | 2.0 | 0.01351 | CAM | 568 | 04 01 1998 15:03:35 |
| NGC 1386 | 03h 36m 46.2s | -35d 59’ 58.0” | 2.0 | 0.00289 | PHT | 832 | 27 01 1998 02:39:25 |
| NGC 1386 | 03h 36m 46.2s | -35d 59’ 58.0” | 2.0 | 0.00289 | CAM | 568 | 27 01 1998 02:50:27 |
| NGC 1566 | 04h 20m 00.7s | -54d 56’ 17.3” | 1.0 | 0.00499 | PHT | 832 | 18 05 1997 17:57:48 |
| NGC 1566 | 04h 20m 00.7s | -54d 56’ 17.3” | 1.0 | 0.00499 | CAM | 568 | 18 05 1997 18:08:52 |
| NGC 1667 | 04h 48m 36.9s | -06d 19’ 12.9” | 2.0 | 0.01517 | PHT | 1344 | 02 10 1997 21:12:47 |
| NGC 1667 | 04h 48m 36.9s | -06d 19’ 12.9” | 2.0 | 0.01517 | CAM | 568 | 02 10 1997 21:32:21 |
| Ark 120 | 05h 16m 11.4s | -00d 08’ 59.4” | 1.0 | 0.03273 | PHT | 2368 | 20 08 1997 12:29:00 |
| Ark 120 | 05h 16m 11.4s | -00d 08’ 59.4” | 1.0 | 0.03273 | CAM | 568 | 20 08 1997 13:05:38 |
| IR 05189-2524 | 05h 21m 01.4s | -25d 21’ 45.6” | 2.0 | 0.04256 | PHT | 2368 | 18 10 1997 00:20:57 |
| IR 05189-2524 | 05h 21m 01.4s | -25d 21’ 45.6” | 2.0 | 0.04256 | CAM | 568 | 18 10 1997 00:57:35 |
| IR 05189-2524 | 05h 21m 01.4s | -25d 21’ 45.6” | 2.0 | 0.04256 | CAM | 568 | 22 09 1997 08:04:39 |
| MCG 8-11-11 | 05h 54m 53.6s | +46d 26’ 21.7” | 1.5 | 0.02048 | PHT | 2368 | 14 10 1997 23:15:13 |
| MCG 8-11-11 | 05h 54m 53.6s | +46d 26’ 21.7” | 1.5 | 0.02048 | CAM | 568 | 14 10 1997 23:51:53 |
| Mrk 3 | 06h 15m 36.4s | +71d 02’ 15.3” | 2.0 | 0.01351 | PHT | 2368 | 04 09 1997 10:35:21 |
| Mrk 3 | 06h 15m 36.4s | +71d 02’ 15.3” | 2.0 | 0.01351 | CAM | 568 | 04 09 1997 11:12:01 |
| HS 0624+6907 | 06h 30m 02.7s | +69d 05’ 04.8” | QSO | 0.37000 | PHT | 4416 | 04 09 1997 07:55:32 |
| HS 0624+6907 | 06h 30m 02.7s | +69d 05’ 04.8” | QSO | 0.37000 | CAM | 568 | 04 09 1997 09:06:18 |
| NGC 3227 | 10h 23m 30.6s | +19d 51’ 55.1” | 1.5 | 0.00386 | PHT | 832 | 25 04 1996 04:21:35 |
| NGC 3227 | 10h 23m 30.6s | +19d 51’ 55.1” | 1.5 | 0.00386 | CAM | 568 | 25 04 1996 04:32:37 |
| A 1058+45 | 11h 01m 34.0s | +45d 39’ 13.7” | 2.0 | 0.02908 | PHT | 4416 | 18 04 1996 08:40:29 |
| A 1058+45 | 11h 01m 34.0s | +45d 39’ 13.7” | 2.0 | 0.02908 | CAM | 568 | 18 04 1996 09:51:17 |
| NGC 3516 | 11h 06m 47.5s | +72d 34’ 06.6” | 1.5 | 0.00884 | PHT | 832 | 12 03 1996 11:21:20 |
| NGC 3516 | 11h 06m 47.5s | +72d 34’ 06.6” | 1.5 | 0.00884 | CAM | 576 | 12 03 1996 11:32:22 |
| NGC 3982 | 11h 56m 28.2s | +55d 07’ 29.3” | 2.0 | 0.00370 | PHT | 832 | 08 04 1996 06:03:32 |
| NGC 3982 | 11h 56m 28.4s | +55d 07’ 29.3” | 2.0 | 0.00370 | CAM | 576 | 08 04 1996 06:14:36 |
| NGC 4051 | 12h 03m 09.6s | +44d 31’ 52.9” | 1.0 | 0.00242 | PHT | 832 | 09 05 1996 09:25:53 |
| NGC 4051 | 12h 03m 09.6s | +44d 31’ 52.9” | 1.0 | 0.00242 | CAM | 568 | 09 05 1996 09:36:57 |
| Mk 766 | 12h 18m 26.4s | +29d 48’ 46.2” | 1.5 | 0.01293 | PHT | 832 | 02 06 1996 04:06:30 |
| Mk 766 | 12h 18m 26.4s | +29d 48’ 46.2” | 1.5 | 0.01293 | CAM | 568 | 02 06 1996 04:17:32 |
| NGC 4388 | 12h 25m 46.7s | +12d 39’ 40.7” | 2.0 | 0.00842 | PHT | 832 | 09 07 1996 06:07:32 |
| NGC 4388 | 12h 25m 46.7s | +12d 39’ 40.7” | 2.0 | 0.00842 | CAM | 568 | 09 07 1996 06:18:36 |
| TARGET | RA | Dec | Type | z | INS | Start Time | |
|---|---|---|---|---|---|---|---|
| (J2000) | (J2000) | (s) | (UT) | ||||
| NGC 4507 | 12h 35m 36.7s | -39d 54’ 33.4” | 2.0 | 0.01180 | PHT | 832 | 04 02 1996 11:55:40 |
| NGC 4507 | 12h 35m 36.7s | -39d 54’ 33.4” | 2.0 | 0.01180 | CAM | 566 | 04 02 1996 12:06:42 |
| NGC 4579 | 12h 37m 43.5s | +11d 49’ 04.6” | 1.9 | 0.00507 | PHT | 1344 | 12 07 1996 23:43:27 |
| NGC 4579 | 12h 37m 43.5s | +11d 49’ 04.6” | 1.9 | 0.00507 | CAM | 568 | 13 07 1996 00:03:03 |
| NGC 4593 | 12h 39m 39.3s | -05d 20’ 38.9” | 1.0 | 0.00900 | PHT | 1344 | 14 07 1996 06:00:28 |
| NGC 4593 | 12h 39m 39.3s | -05d 20’ 38.9” | 1.0 | 0.00900 | CAM | 568 | 14 07 1996 06:20:04 |
| IR 12495-1308 | 12h 52m 12.6s | -13d 24’ 49.9” | 1.0 | 0.01463 | PHT | 2368 | 19 12 1996 10:52:42 |
| IR 12495-1308 | 12h 52m 12.6s | -13d 24’ 49.9” | 1.0 | 0.01463 | CAM | 568 | 19 12 1996 11:29:20 |
| NGC 5033 | 13h 13m 27.8s | +36d 35’ 39.7” | 1.9 | 0.00292 | PHT | 832 | 25 06 1996 12:02:21 |
| NGC 5033 | 13h 13m 27.8s | +36d 35’ 39.7” | 1.9 | 0.00292 | CAM | 568 | 25 06 1996 12:13:25 |
| MGC-6-30-15 | 13h 35m 53.7s | -34d 17’ 45.3” | 1.0 | 0.00775 | PHT | 832 | 14 02 1996 17:40:28 |
| MGC-6-30-15 | 13h 35m 53.7s | -34d 17’ 45.3” | 1.0 | 0.00775 | CAM | 566 | 14 02 1996 17:51:30 |
| Z 1335.5+3925 | 13h 37m 39.9s | +39d 09’ 16.4” | 1.8 | 0.02009 | PHT | 4416 | 09 06 1996 11:34:33 |
| Z 1335.5+3925 | 13h 37m 39.9s | +39d 09’ 16.4” | 1.8 | 0.02009 | CAM | 568 | 09 06 1996 12:45:19 |
| Mrk 266 SW | 13h 38m 17.4s | +48d 16’ 36.4” | 2.0 | 0.02786 | PHT | 1344 | 04 05 1996 15:44:50 |
| Mrk 266 SW | 13h 38m 17.4s | +48d 16’ 36.4” | 2.0 | 0.02786 | CAM | 568 | 04 05 1996 16:04:24 |
| NGC 5273 | 13h 42m 08.3s | +35d 39’ 15.0” | 1.9 | 0.00352 | PHT | 2368 | 25 06 1996 11:14:43 |
| NGC 5273 | 13h 42m 08.3s | +35d 39’ 15.0” | 1.9 | 0.00352 | CAM | 568 | 25 06 1996 11:51:23 |
| IC 4329 A | 13h 49m 19.2s | -30d 18’ 34.6” | 1.0 | 0.01605 | PHT | 832 | 14 02 1996 16:13:56 |
| IC 4329 A | 13h 49m 19.2s | -30d 18’ 34.6” | 1.0 | 0.01605 | CAM | 566 | 14 02 1996 16:25:00 |
| Mrk 279 | 13h 53m 03.4s | +69d 18’ 29.1” | 1.0 | 0.02940 | PHT | 2368 | 05 02 1996 06:50:17 |
| Mrk 279 | 13h 53m 03.4s | +69d 18’ 29.1” | 1.0 | 0.02940 | CAM | 566 | 05 02 1996 07:26:57 |
| Mrk 673 | 14h 17m 21.0s | +26d 51’ 27.8” | 2.0 | 0.03651 | PHT | 2368 | 07 02 1996 19:18:22 |
| Mrk 673 | 14h 17m 21.0s | +26d 51’ 27.8” | 2.0 | 0.03651 | CAM | 566 | 07 02 1996 19:55:02 |
| IC 4397 | 14h 17m 58.7s | +26d 24’ 47.5” | 2.0 | 0.01474 | PHT | 4416 | 07 02 1996 17:57:42 |
| IC 4397 | 14h 17m 58.7s | +26d 24’ 47.5” | 2.0 | 0.01474 | CAM | 566 | 07 02 1996 19:08:30 |
| NGC 5548 | 14h 17m 59.5s | +25d 08’ 12.2” | 1.0 | 0.01717 | PHT | 1344 | 07 02 1996 16:37:46 |
| NGC 5548 | 14h 17m 59.5s | +25d 08’ 12.2” | 1.0 | 0.01717 | CAM | 566 | 07 02 1996 16:57:22 |
| NGC 5674 | 14h 33m 52.1s | +05d 27’ 30.7” | 1.9 | 0.02492 | PHT | 2368 | 07 02 1996 13:28:56 |
| NGC 5674 | 14h 33m 52.1s | +05d 27’ 30.7” | 1.9 | 0.02492 | CAM | 566 | 07 02 1996 14:05:36 |
| Mk 817 | 14h 36m 22.0s | +58d 47’ 39.0” | 1.5 | 0.03145 | PHT | 1344 | 05 02 1996 13:44:27 |
| Mk 817 | 14h 36m 22.0s | +58d 47’ 39.0” | 1.5 | 0.03145 | CAM | 566 | 05 02 1996 14:04:02 |
| NGC 5728 | 14h 42m 23.8s | -17d 15’ 09.9” | 2.0 | 0.00930 | PHT | 2368 | 07 02 1996 08:12:45 |
| NGC 5728 | 14h 42m 23.8s | -17d 15’ 09.9” | 2.0 | 0.00930 | CAM | 566 | 07 02 1996 08:49:23 |
| Mk 841 | 15h 04m 01.1s | +10d 26’ 16.0” | 1.0 | 0.03620 | PHT | 2368 | 07 02 1996 15:17:22 |
| Mk 841 | 15h 04m 01.1s | +10d 26’ 16.0” | 1.0 | 0.03620 | CAM | 566 | 07 02 1996 15:54:02 |
| NGC 5929 | 15h 26m 06.1s | +41d 40’ 14.5” | 2.0 | 0.00854 | PHT | 1344 | 05 02 1996 13:12:15 |
| NGC 5929 | 15h 26m 06.1s | +41d 40’ 14.5” | 2.0 | 0.00854 | CAM | 566 | 05 02 1996 13:31:51 |
| NGC 5940 | 15h 31m 18.0s | +07d 27’ 27.8” | 1.0 | 0.03405 | PHT | 2368 | 07 02 1996 14:29:36 |
| NGC 5940 | 15h 31m 18.0s | +07d 27’ 27.8” | 1.0 | 0.03405 | CAM | 566 | 07 02 1996 15:06:16 |
| NGC 5953 | 15h 34m 32.4s | +15d 11’ 37.8” | 2.0 | 0.00656 | PHT | 1344 | 07 02 1996 16:05:22 |
| NGC 5953 | 15h 34m 32.4s | +15d 11’ 37.8” | 2.0 | 0.00656 | CAM | 566 | 07 02 1996 16:24:58 |
| ESO 137-G34 | 16h 35m 14.2s | -58d 04’ 48.9” | 2.0 | 0.00916 | PHT | 2368 | 09 02 1996 07:54:40 |
| ESO 137-G34 | 16h 35m 14.2s | -58d 04’ 48.9” | 2.0 | 0.00916 | CAM | 566 | 09 02 1996 08:31:18 |
| MRK 507 | 17h 48m 38.4s | +68d 42’ 15.9” | 2.0 | 0.05590 | PHT | 4416 | 29 05 1997 14:30:14 |
| MRK 507 | 17h 48m 38.4s | +68d 42’ 15.9” | 2.0 | 0.05590 | CAM | 1214 | 10 10 1997 21:20:24 |
| H 1821+643 | 18h 21m 57.2s | +64d 20’ 36.4” | QSO | 0.29700 | PHT | 2368 | 05 02 1996 09:34:27 |
| H 1821+643 | 18h 21m 57.2s | +64d 20’ 36.4” | QSO | 0.29700 | CAM | 566 | 05 02 1996 10:11:07 |
| TARGET | RA | Dec | Type | z | INS | Start Time | |
|---|---|---|---|---|---|---|---|
| (J2000) | (J2000) | (s) | (UT) | ||||
| 3C 382 | 18h 35m 03.3s | +32d 41’ 46.8” | 1.0 | 0.05787 | PHT | 4416 | 16 02 1996 17:19:38 |
| 3C 382 | 18h 35m 03.3s | +32d 41’ 46.8” | 1.0 | 0.05787 | CAM | 566 | 16 02 1996 18:30:26 |
| 3C390.3 | 18h 42m 08.7s | +79d 46’ 16.8” | 1.0 | 0.05610 | PHT | 4416 | 05 02 1996 04:38:11 |
| ESO 141-G55 | 19h 21m 14.2s | -58d 40’ 12.4” | 1.0 | 0.03600 | PHT | 2368 | 04 03 1996 17:27:35 |
| ESO 141-G55 | 19h 21m 14.2s | -58d 40’ 12.4” | 1.0 | 0.03600 | CAM | 576 | 04 03 1996 18:04:15 |
| Mk 509 | 20h 44m 09.7s | -10d 43’ 24.5” | 1.0 | 0.03440 | PHT | 4416 | 18 10 1996 01:52:36 |
| Mk 509 | 20h 44m 09.7s | -10d 43’ 24.5” | 1.0 | 0.03440 | CAM | 568 | 18 10 1996 03:03:22 |
| NGC 7314 | 22h 35m 45.7s | -26d 03’ 02.9” | 1.9 | 0.00474 | PHT | 2368 | 29 04 1996 12:05:36 |
| NGC 7314 | 22h 35m 45.7s | -26d 03’ 02.9” | 1.9 | 0.00474 | CAM | 568 | 29 04 1996 12:42:14 |
| IR 22377+0747 | 22h 40m 17.6s | +08d 03’ 15.4” | 1.8 | 0.02460 | PHT | 1344 | 18 05 1996 09:06:54 |
| IR 22377+0747 | 22h 40m 17.6s | +08d 03’ 15.4” | 1.8 | 0.02460 | CAM | 568 | 18 05 1996 09:26:28 |
| Ark 564 | 22h 42m 39.4s | +29d 43’ 31.3” | 1.0 | 0.02400 | PHT | 4416 | 20 05 1997 14:28:34 |
| NGC 7592 | 23h 18m 22.1s | -04d 24’ 59.7” | 2.0 | 0.02444 | PHT | 2368 | 15 11 1996 15:20:15 |
| NGC 7592 | 23h 18m 22.1s | -04d 24’ 59.7” | 2.0 | 0.02444 | CAM | 568 | 15 11 1996 15:56:53 |
| NGC 7603 | 23h 18m 56.6s | +00d 14’ 36.8” | 1.5 | 0.02952 | PHT | 1344 | 18 05 1996 05:27:37 |
| NGC 7603 | 23h 18m 56.6s | +00d 14’ 36.8” | 1.5 | 0.02952 | CAM | 568 | 18 05 1996 05:47:11 |
| NGC 7674 | 23h 27m 56.7s | +08d 46’ 43.5” | 2.0 | 0.02906 | PHT | 832 | 28 05 1996 06:28:21 |
| NGC 7674 | 23h 27m 56.7s | +08d 46’ 43.5” | 2.0 | 0.02906 | CAM | 568 | 28 05 1996 06:39:23 |
| TARGET | 6.75 m nuclear flux | 9.63 m nuclear flux | Note | |||
|---|---|---|---|---|---|---|
| CAM | PHT | CAM | PHT | |||
| (mJy) | (mJy) | (mJy) | (mJy) | (Kpc/10 ) | ||
| Mrk 334 | 131 | 107 | 148 | 167 | 4.3 | |
| Mrk 335 | 155 | 153 | 203 | 225 | 4.3 | |
| Fairall 9 | 174 | 148 | 272 | 205 | 9.1 | |
| NGC 526a | 118 | 107 | 167 | 169 | 3.7 | |
| NGC 701 | 162 | 119 | 142 | 128 | 1.2 | E |
| Mrk 590 | 144 | 123 | 198 | 215 | 5.1 | |
| NGC 1097 | 1212 | 729 | 825 | 813 | 0.8 | E |
| NGC 1125 | 72 | 63 | 61 | 47 | 2.1 | |
| NGC 1241 | 67 | 43 | 43 | 44 | 2.6 | E |
| NGC 1386 | 257 | 213 | 276 | 319 | 0.6 | |
| NGC 1566 | 116 | 157 | 114 | 190 | 1.0 | E |
| NGC 1667 | 194 | 114 | 167 | 149 | 2.9 | E |
| Ark 120 | 140 | 128 | 188 | 203 | 6.3 | |
| IR 05189-2524 | 302 | NA | 451 | NA | 8.2 | |
| IR 05189-2524 | 320 | 252 | 449 | 418 | 8.2 | |
| MCG 8-11-11 | 230 | 213 | 383 | 376 | 4.0 | |
| Mrk 3 | 154 | 117 | 320 | 302 | 2.6 | |
| HS 0624+6907 | 63 | 54 | 57 | 73 | 73. | |
| NGC 3227 | 294 | 249 | 382 | 372 | 0.7 | |
| A 1058+45 | 42 | 27 | 46 | 47 | 5.6 | |
| NGC 3516 | 264 | 263 | 369 | 392 | 1.7 | |
| NGC 3982 | 147 | 129 | 113 | 182 | 0.7 | E |
| NGC 4051 | 265 | 262 | 411 | 454 | 0.5 | |
| Mrk 766 | 177 | 185 | 274 | 318 | 2.5 | |
| NGC 4388 | 265 | 256 | 267 | 361 | 1.6 | |
| NGC 4507 | 274 | 251 | 410 | 428 | 2.3 | |
| NGC 4579 | 104 | 114 | 113 | 159 | 1.0 | |
| NGC 4593 | 206 | 200 | 280 | 309 | 1.7 | |
| IR 12495-1308 | 51 | 40 | 62 | 82 | 2.8 | |
| NGC 5033 | 239 | 200 | 210 | 225 | 0.6 | E |
| MCG -6-30-15 | 213 | 206 | 329 | 388 | 1.5 | |
| Z 1335.5+3925 | 49 | 39 | 49 | 59 | 3.9 | E |
| Mrk 266 SW | 125 | 92 | 108 | 133 | 5.4 | E |
| NGC 5273 | 23 | 25 | 25 | 37 | 0.7 | |
| IC 4329A | 591 | 477 | 890 | 739 | 3.1 | |
| Mrk 279 | 102 | 94 | 146 | 143 | 5.7 | |
| Mrk 673 | 72 | 55 | 73 | 80 | 7.1 | |
| IC 4397 | 64 | 44 | 59 | 64 | 2.9 | E |
| NGC 5548 | 177 | 168 | 268 | 275 | 3.3 | |
| NGC 5674 | 38 | 26 | 43 | 50 | 4.8 | E |
| Mrk 817 | 142 | 123 | 259 | 234 | 6.1 | |
| NGC 5728 | 147 | 114 | 126 | 114 | 1.8 | E |
| Mrk 841 | 74 | 66 | 133 | 115 | 7.0 | |
| NGC 5929 | 41 | 30 | 72 | 51 | 1.7 | |
| NGC 5940 | 46 | 36 | 81 | 67 | 6.6 | |
| NGC 5953 | 310 | 247 | 243 | 252 | 1.3 | E |
| ESO 137-G34 | 70 | 91 | 60 | 63 | 1.8 | |
| Mrk 507 | 29 | 19 | 52 | 36 | 11. | |
| H 1821+643 | 109 | 99 | 143 | 156 | 58. | |
| TARGET | 6.75 m nuclear flux | 9.63 m nuclear flux | Note | |||
|---|---|---|---|---|---|---|
| CAM | PHT | CAM | PHT | |||
| (mJy) | (mJy) | (mJy) | (mJy) | (Kpc/10 ) | ||
| 3C 382 | 62 | 56 | 76 | 72 | 11. | |
| 3C 390.3 | * | 50 | * | 81 | 11. | |
| ESO 141-G55 | 103 | 100 | 145 | 184 | 7.0 | |
| Mrk 509 | 162 | 149 | 222 | 242 | 6.7 | |
| NGC 7314 | 51 | 51 | 67 | 72 | 1.0 | |
| IR 22377+0747 | 45 | 41 | 50 | 64 | 4.8 | |
| Ark 564 | - | 77 | - | 132 | 4.7 | |
| NGC 7592 | 171 | 128 | 136 | 162 | 4.7 | E |
| NGC 7603 | 138 | 109 | 176 | 152 | 5.7 | |
| NGC 7674 | 259 | 213 | 344 | 348 | 5.6 | |
| TARGET | 6.75 m flux | 9.63 m flux | FWHM | Comments | ||||
|---|---|---|---|---|---|---|---|---|
| Nucl. | Total | Nucl. | Total | |||||
| (mJy) | (mJy) | (mJy) | (mJy) | (mJy) | (mJy) | |||
| NGC 701 | 119 | 162 | 258 | 92 | 142 | 250 | 8.0 | Edge-on spiral; well defined bulge |
| NGC 1097 | 626 | 1212 | 1445 | 624 | 825 | 1024 | 28 | Ill-defined nucleus; bright annular galaxy |
| NGC 1241 | 42 | 67 | 104 | 35 | 43 | 133 | 5.6 | Nearly point-nucleus; faint annular galaxy |
| NGC 1566 | 109 | 116 | 210 | 112 | 114 | 190 | 4.7 | Point-nucleus; faint spiral arms |
| NGC 1667 | 94 | 194 | 300 | 68 | 167 | 274 | 9.0 | Faint bulge; bright oval galaxy |
| NGC 3982 | 62 | 147 | 262 | 68 | 113 | 300 | 4.5 | Point-nucleus in circular galaxy |
| NGC 5033 | 179 | 239 | 600 | 150 | 210 | 675 | 8.5 | Well defined nucleus; bright edge-on spiral |
| Z 1335.5+3925 | 47 | 49 | 49 | 44 | 49 | 50 | 7.5 | Compact oval galaxy; no defined nucleus |
| Mrk 266 SW | 114 | 125 | 130 | 102 | 108 | 108 | 4.5 | Bright point-nucleus; faint compact galaxy |
| IC 4397 | 48 | 64 | 73 | 41 | 59 | 65 | 7.0 | Faint point-nucleus; faint compact galaxy |
| NGC 5674 | 36 | 38 | 84 | 41 | 43 | 96 | 4.5 | Point-nucleus; faint ring galaxy |
| NGC 5728 | 139 | 147 | 147 | 112 | 126 | 126 | 8.0 | Nearly point-nucleus; compact galaxy |
| NGC 5953 | - | 310 | 310 | - | 243 | 243 | 12 | No defined nucleus; compact galaxy |
| NGC 7592 | 171 | 171 | 171 | 136 | 136 | 136 | 4.5 | Two point-nuclei separated by 9 arcsec |
| TARGET | Type | F(7m) | F(3.3m) | EW(3.3m) | F(6.2m) | EW(6.2m) | |
|---|---|---|---|---|---|---|---|
| (mJy) | (m) | (m) | |||||
| Mrk 334 | 1.8 | -1.18 | 80.0 | 0.260 | 0.03 | 2.8350.130 | 0.525 |
| Mrk 335 | 1.0 | -0.50 | 152.6 | 0.4500.390 | 0.030 | 1.0820.180 | 0.086 |
| Fairall 9 | 1.0 | -0.53 | 146.0 | 0.299 | 0.01 | 1.0150.167 | 0.101 |
| NGC 526a | 1.5 | -0.72 | 94.7 | 0.6090.258 | 0.041 | 2.2470.117 | 0.322 |
| NGC 701 | SB | -0.84 | 48.9 | 0.6330.154 | 0.099 | 4.3120.078 | 1.299 |
| Mrk 590 | 1.5 | -0.86 | 119.6 | 1.6010.343 | 0.080 | 1.1080.154 | 0.139 |
| NGC 1097 | 2.0 | -0.96 | 402.8 | 4.2020.456 | 0.082 | 20.1580.321 | 0.744 |
| NGC 1125 | 2.0 | -0.44 | 40.1 | 0.3980.221 | 0.060 | 1.4270.108 | 0.551 |
| NGC 1241 | 2.0 | -0.95 | 32.7 | 1.3910.159 | 0.314 | 0.6390.077 | 0.295 |
| NGC 1386 | 2.0 | -1.01 | 191.1 | 0.5280.395 | 0.033 | 2.1600.240 | 0.165 |
| NGC 1566 | 1.0 | -0.85 | 112.9 | 6.0990.668 | 0.372 | 3.6970.494 | 0.423 |
| NGC 1667 | 2.0 | -0.66 | 58.7 | 1.6200.322 | 0.176 | 3.5640.162 | 0.896 |
| Ark 120 | 1.0 | -0.97 | 130.7 | 1.0670.248 | 0.059 | 1.2330.115 | 0.139 |
| IR 05189-2524 | 2.0 | -0.92 | 229.3 | 0.7030.215 | 0.024 | 3.3500.110 | 0.215 |
| MCG 8-11-11 | 1.5 | -0.81 | 223.2 | 0.5970.230 | 0.017 | 0.6780.119 | 0.037 |
| Mrk 3 | 2.0 | -1.91 | 127.4 | 1.0930.228 | 0.114 | 0.6400.110 | 0.084 |
| HS 0624+6907 | QSO | -0.77 | 65.2 | 0.4920.225 | 0.078 | 0.3700.122 | 0.072 |
| NGC 3227 | 1.5 | -0.75 | 189.9 | 3.0500.498 | 0.112 | 4.3130.241 | 0.331 |
| A 1058+45 | 2.0 | -0.93 | 16.8 | 0.3100.173 | 0.162 | 0.7070.077 | 0.650 |
| NGC 3516 | 1.5 | -0.60 | 270.9 | 2.2480.545 | 0.032 | 1.4380.241 | 0.070 |
| NGC 3982 | 2.0 | -0.65 | 86.1 | 2.1750.440 | 0.161 | 2.5470.245 | 0.418 |
| NGC 4051 | 1.0 | -0.96 | 265.3 | 0.427 | 0.04 | 1.2410.241 | 0.070 |
| Mrk 766 | 1.5 | -0.90 | 198.5 | 1.1110.508 | 0.005 | 0.4770.222 | 0.032 |
| NGC 4388 | 2.0 | -0.65 | 198.8 | 0.649 | 0.04 | 3.6440.239 | 0.284 |
| NGC 4507 | 2.0 | -1.15 | 268.5 | 0.8040.441 | 0.049 | 1.8530.224 | 0.105 |
| NGC 4579 | 1.9 | -0.37 | 91.4 | 5.1460.336 | 0.280 | 1.4720.162 | 0.230 |
| NGC 4593 | 1.0 | -0.52 | 199.2 | 0.6640.393 | 0.023 | 0.8180.163 | 0.053 |
| IR 12495-1308 | 1.0 | -1.37 | 38.4 | 0.8690.271 | 0.165 | 0.6480.130 | 0.289 |
| NGC 5033 | 1.9 | -0.75 | 132.8 | 3.5770.438 | 0.198 | 4.5170.220 | 0.497 |
| MCG-6-30-15 | 1.0 | -0.84 | 218.4 | 0.5900.406 | 0.037 | 0.0830.247 | 0.012 |
| Z 1335.5+3925 | 1.8 | -0.85 | 29.1 | 0.4400.179 | 0.088 | 0.8140.080 | 0.432 |
| Mrk 266 SW | 2.0 | -1.04 | 56.8 | 1.2170.350 | 0.187 | 2.7300.163 | 0.760 |
| NGC 5273 | 1.9 | -0.22 | 18.5 | 0.1670.219 | 0.017 | 0.7070.114 | 0.511 |
| IC 4329A | 1.0 | -0.87 | 414.6 | 0.4860.483 | 0.011 | 8.8740.255 | 0.313 |
| Mrk 279 | 1.0 | -0.80 | 103.4 | 0.1870.181 | 0.012 | 0.0510.077 | 0.006 |
| Mrk 673 | 2.0 | -0.72 | 32.2 | 0.8420.225 | 0.128 | 1.7230.110 | 0.811 |
| IC 4397 | 2.0 | -0.86 | 16.4 | 0.5080.172 | 0.204 | 1.8300.079 | 1.702 |
| NGC 5548 | 1.5 | -0.81 | 175.5 | 0.7620.355 | 0.037 | 0.3480.170 | 0.026 |
| NGC 5674 | 1.9 | -1.25 | 13.1 | 0.5070.228 | 0.205 | 1.2840.132 | 1.469 |
| Mrk 817 | 1.5 | -0.85 | 121.8 | 0.377 | 0.01 | 1.4520.160 | 0.171 |
| NGC 5728 | 2.0 | -1.10 | 46.2 | 1.5060.337 | 0.235 | 4.1570.158 | 1.399 |
| Mrk 841 | 1.0 | -0.99 | 66.9 | 0.3740.221 | 0.041 | 0.6980.120 | 0.137 |
| NGC 5929 | 2.0 | 0.13 | 17.8 | 0.9300.345 | 0.155 | 0.7830.163 | 0.524 |
| NGC 5940 | 1.0 | -1.40 | 27.2 | 0.229 | 0.09 | 1.3990.115 | 0.796 |
| NGC 5953 | 2.0 | -0.56 | 98.0 | 1.4160.393 | 0.087 | 8.2500.180 | 1.201 |
| ESO 137-G34 | 2.0 | -0.75 | 11.0 | 1.040 | 0.880 | 0.7170.300 | 0.880 |
| Mrk 507 | 2.0 | -0.93 | 15.3 | 0.2040.159 | 0.087 | 0.4160.070 | 0.409 |
| H 1821+643 | QSO | -0.99 | 122.5 | 0.5670.355 | 0.033 | 1.0120.161 | 0.121 |
| TARGET | Type | F(7m) | F(3.3m) | EW(3.3m) | F(6.2m) | EW(6.2m) | |
|---|---|---|---|---|---|---|---|
| (mJy) | (m) | (m) | |||||
| 3C 382 | 1.0 | -0.38 | 52.7 | 0.3960.149 | 0.033 | 0.5840.080 | 0.156 |
| 3C 390.3 | 1.0 | -0.53 | 52.1 | 0.167 | 0.01 | 0.0480.080 | 0.027 |
| ESO 141-G55 | 1.0 | -0.97 | 108.8 | 0.0140.229 | 0.014 | 0.7200.113 | 0.091 |
| Mrk 509 | 1.0 | -0.84 | 161.2 | 0.166 | 0.01 | 0.6240.079 | 0.055 |
| NGC 7314 | 1.9 | -1.05 | 43.1 | 0.9050.321 | 0.219 | 0.6770.151 | 0.205 |
| IR 22377+0747 | 1.8 | -0.50 | 36.6 | 0.307 | 0.07 | 0.5210.166 | 0.201 |
| Ark 564 | 1.0 | -1.18 | 84.8 | 0.157 | 0.01 | 0.4050.070 | 0.069 |
| NGC 7592 | 2.0 | -0.73 | 72.6 | 0.1310.245 | 0.034 | 4.1270.112 | 0.872 |
| NGC 7603 | 1.5 | -0.84 | 99.8 | 0.3210.344 | 0.019 | 1.6030.174 | 0.229 |
| NGC 7674 | 2.0 | -0.96 | 186.9 | 1.4010.469 | 0.053 | 3.3360.226 | 0.279 |
| TARGET | Type | F(7.7m) | EW(7.7m) | F(8.6m) | EW(8.6m) | ||
|---|---|---|---|---|---|---|---|
| (m) | (m) | (m) | |||||
| Mrk 334 | 1.8 | 9.0910.201 | 2.063 | 2.6490.124 | 0.615 | 14.5470.276 | 3.191 |
| Mrk 335 | 1.0 | 1.8010.303 | 0.225 | 0.7010.188 | 0.104 | 3.6940.419 | 0.417 |
| Fairall 9 | 1.0 | 3.2170.270 | 0.410 | 0.4000.184 | 0.045 | 4.7900.376 | 0.575 |
| NGC 526a | 1.5 | 2.5960.191 | 0.507 | 0.8900.112 | 0.197 | 6.0250.257 | 1.050 |
| NGC 701 | SB | 15.7110.121 | 5.876 | 4.2910.079 | 1.627 | 24.0950.166 | 8.940 |
| Mrk 590 | 1.5 | 3.7100.249 | 0.555 | 1.0110.155 | 0.153 | 5.8170.342 | 0.860 |
| NGC 1097 | 2.0 | 79.7590.444 | 3.612 | 19.3870.277 | 0.897 | 118.5340.627 | 5.292 |
| NGC 1125 | 2.0 | 5.0000.172 | 2.405 | 1.1610.116 | 0.620 | 7.7160.245 | 3.530 |
| NGC 1241 | 2.0 | 3.7080.121 | 2.084 | 1.0880.082 | 0.612 | 5.3900.171 | 2.983 |
| NGC 1386 | 2.0 | 10.2170.355 | 0.986 | 2.3490.235 | 0.208 | 14.7370.504 | 1.366 |
| NGC 1566 | 1.0 | 10.5620.604 | 1.695 | 2.6010.382 | 0.425 | 16.9900.889 | 2.617 |
| NGC 1667 | 2.0 | 14.7070.257 | 4.683 | 3.9550.164 | 1.334 | 22.1360.354 | 6.981 |
| Ark 120 | 1.0 | 2.6340.177 | 0.377 | 0.5670.124 | 0.108 | 4.5640.252 | 0.622 |
| IR 05189-2524 | 2.0 | 13.8170.182 | 1.104 | 3.8450.117 | 0.355 | 21.8070.250 | 1.706 |
| MCG 8-11-11 | 1.5 | 3.4140.175 | 0.289 | 1.0130.118 | 0.094 | 5.0560.249 | 0.403 |
| Mrk 3 | 2.0 | 4.1380.171 | 0.545 | 1.1080.111 | 0.139 | 5.9380.240 | 0.785 |
| HS 0624+6907 | QSO | 0.8790.269 | 0.275 | 0.0001.000 | 0.000 | 0.0001.000 | 0.000 |
| NGC 3227 | 1.5 | 16.0410.369 | 1.581 | 4.4510.229 | 0.448 | 24.8800.506 | 2.392 |
| A 1058+45 | 2.0 | 2.9010.127 | 3.247 | 0.9320.081 | 1.132 | 4.6840.175 | 5.009 |
| NGC 3516 | 1.5 | 2.3640.368 | 0.161 | 0.5610.235 | 0.046 | 4.2200.520 | 0.261 |
| NGC 3982 | 2.0 | 10.9410.378 | 2.405 | 2.8650.216 | 0.657 | 16.2950.513 | 3.509 |
| NGC 4051 | 1.0 | 6.2090.352 | 0.428 | 1.8700.222 | 0.136 | 9.3450.502 | 0.648 |
| Mrk 766 | 1.5 | 2.9120.382 | 0.285 | 0.6300.224 | 0.045 | 3.8640.516 | 0.342 |
| NGC 4388 | 2.0 | 16.4960.363 | 1.612 | 5.0240.252 | 0.556 | 25.7590.522 | 2.405 |
| NGC 4507 | 2.0 | 3.7290.358 | 0.243 | 1.0820.191 | 0.053 | 6.5960.484 | 0.401 |
| NGC 4579 | 1.9 | 4.7380.363 | 0.945 | 0.9570.156 | 0.254 | 7.2770.432 | 1.466 |
| NGC 4593 | 1.0 | 3.1450.254 | 0.338 | 0.8980.163 | 0.104 | 4.8950.358 | 0.458 |
| IR 12495-1308 | 1.0 | 1.6910.195 | 0.760 | 0.7450.120 | 0.357 | 3.0360.274 | 1.383 |
| NGC 5033 | 1.9 | 16.9330.364 | 2.394 | 3.9100.220 | 0.571 | 25.1630.492 | 3.454 |
| MCG-6-30-15 | 1.0 | 1.4690.420 | 0.120 | 1.5990.339 | 0.157 | 3.1930.610 | 0.298 |
| Z 1335.5+3925 | 1.8 | 3.6670.124 | 2.413 | 1.1900.083 | 0.835 | 5.6920.173 | 3.619 |
| Mrk 266 SW | 2.0 | 11.1850.274 | 3.545 | 2.7240.172 | 0.843 | 16.7770.370 | 5.267 |
| NGC 5273 | 1.9 | 0.9300.171 | 1.028 | 0.4540.111 | 0.619 | 2.0900.239 | 2.161 |
| IC 4329A | 1.0 | 17.1570.397 | 0.714 | 4.3710.242 | 0.204 | 31.7530.546 | 1.313 |
| Mrk 279 | 1.0 | 0.7580.118 | 0.135 | 0.1750.084 | 0.036 | 0.9420.168 | 0.169 |
| Mrk 673 | 2.0 | 7.9610.183 | 4.617 | 2.0770.117 | 1.319 | 11.9440.251 | 6.843 |
| IC 4397 | 2.0 | 6.4490.126 | 7.199 | 1.8660.077 | 2.275 | 10.3070.173 | 11.422 |
| NGC 5548 | 1.5 | 4.0190.267 | 0.425 | 1.2040.165 | 0.099 | 5.2380.363 | 0.552 |
| NGC 5674 | 1.9 | 3.4000.209 | 4.654 | 1.6160.135 | 2.307 | 6.3650.291 | 8.520 |
| Mrk 817 | 1.5 | 3.5610.251 | 0.542 | 0.8880.169 | 0.146 | 6.0810.353 | 0.871 |
| NGC 5728 | 2.0 | 15.5790.261 | 6.064 | 3.0530.158 | 1.276 | 23.4200.358 | 8.835 |
| Mrk 841 | 1.0 | 2.3310.190 | 0.627 | 0.8560.120 | 0.262 | 3.8790.260 | 1.044 |
| NGC 5929 | 2.0 | 2.4720.242 | 2.855 | 0.9560.156 | 1.385 | 4.2560.347 | 4.697 |
| NGC 5940 | 1.0 | 3.0890.186 | 2.008 | 1.0750.120 | 0.674 | 5.5320.257 | 3.460 |
| NGC 5953 | 2.0 | 33.8200.279 | 6.442 | 8.3510.171 | 1.631 | 49.8690.375 | 9.430 |
| ESO 137-G34 | 2.0 | 4.0402.000 | 6.350 | 0.8500.420 | 1.580 | 6.2403.100 | 9.560 |
| Mrk 507 | 2.0 | 2.0350.121 | 2.417 | 0.5890.102 | 0.745 | 3.1540.179 | 3.675 |
| H 1821+643 | QSO | 2.0590.333 | 0.318 | -0.3340.253 | -0.070 | 3.0790.459 | 0.371 |
| TARGET | Type | F(7.7m) | EW(7.7m) | F(8.6m) | EW(8.6m) | ||
|---|---|---|---|---|---|---|---|
| (m) | (m) | (m) | |||||
| 3C 382 | 1.0 | 0.8690.136 | 0.297 | 0.1180.109 | 0.057 | 1.7100.196 | 0.539 |
| 3C 390.3 | 1.0 | 0.6610.141 | 0.223 | 0.5130.109 | 0.267 | 1.3170.202 | 0.558 |
| ESO 141-G55 | 1.0 | 1.6350.190 | 0.265 | 1.3020.131 | 0.257 | 3.5340.265 | 0.618 |
| Mrk 509 | 1.0 | 1.8090.127 | 0.206 | 0.5350.079 | 0.075 | 3.0180.174 | 0.341 |
| NGC 7314 | 1.9 | 2.5510.245 | 1.046 | 0.5800.168 | 0.170 | 3.8170.337 | 1.498 |
| IR 22377+0747 | 1.8 | 1.6470.249 | 0.906 | 0.6260.167 | 0.377 | 2.7180.352 | 1.456 |
| Ark 564 | 1.0 | 1.2580.115 | 0.260 | 0.1870.073 | 0.037 | 1.8700.159 | 0.368 |
| NGC 7592 | 2.0 | 15.9730.189 | 4.108 | 4.0860.113 | 1.111 | 24.3890.256 | 6.136 |
| NGC 7603 | 1.5 | 4.2470.266 | 0.788 | 1.1680.183 | 0.241 | 7.1390.378 | 1.260 |
| NGC 7674 | 2.0 | 11.5090.376 | 1.099 | 3.5030.238 | 0.390 | 18.9420.516 | 1.811 |