Smoke Signals From IRC +10216
1. Milliarcsecond Proper Motions of the Dust
Abstract
The results of a 7-epoch interferometric imaging study, at wavelengths in the near-infrared K-band, of the carbon star IRC +10216 are presented. The use of non- and partially-redundant aperture masking techniques on the 10-m Keck-I telescope has allowed us to produce images of the innermost regions of the circumstellar dust envelope with unprecedented detail. With roughly twice the resolving power of previous work (Weigelt et al. (1997); Weigelt et al. (1998); Haniff & Buscher (1998)), the complex asymmetric structures reported within the central 0 5 (20 R⋆) have been imaged at the size scale of the stellar disk itself (50 mas). A prominent dark lane at a position angle of approximately is suggested to be an optically thick disk or torus of dust which could help to explain IRC +10216’s well-known bipolarity at a position angle of . Observations spanning more than a pulsational cycle (638 days) have revealed significant temporal evolution of the nebula, including the outward motion of bright knots and clumps. Registering these displacements against the compact bright core, which we tentatively identify as marking the location of the star, has allowed us to determine the apparent angular velocity at a number of points. The magnitudes of the proper motions were found to be in agreement with current estimates of the stellar distance and radial velocity. Higher outflow speeds were found for features with greater separation from the core. This is consistent with acceleration taking place over the region sampled by the measurements, however alternate interpretations are also presented. Although a number of changes of morphology were found, none were clearly interpreted as the condensation of new dust over the pulsation cycle. Unfortunately, ambiguities associated with the true three-dimensional nature of the nebula weaken a number of our quantitative and qualitative conclusions.
Subject headings:
stars: AGB and post-AGB, stars: circumstellar matter, stars: mass-loss, stars: variables, stars: late-type, stars: giants, ISM: dust, techniques: interferometric, ISM: jets and outflows, infrared: stars1. Introduction
The extreme carbon star IRC +10216 is a classic example of a red giant caught in the act of evolving into a planetary nebula. Its relative proximity, high infrared luminosity, and abundance of molecules found in its dense outflow has resulted in a barrage of observations by astronomers, working across the spectrum, but particularly in the infrared and millimeter/sub-millimeter. Despite all this attention, a good model of what is happening in the innermost regions where the stellar outflow is born and accelerated is still sorely lacking.
Numerous studies of molecular lines in the outer envelope (e.g. Bieging & Tafalla (1993)) have revealed a spherically expanding outflow, a finding which was beautifully confirmed with deep and band images of the dust shell in ambient scattered galactic light (Mauron & Huggins (1999)). However this spherical symmetry, a characteristic of most red giant winds, will likely be broken as the IRC +10216 evolves into a planetary nebula, most of which are elongated or bipolar (e.g. Zuckerman & Aller (1986)). The pronounced asymmetry in the innermost regions of the envelope of IRC +10216 reported by numerous high-resolution imaging experiments (most recently Weigelt et al. (1997); Danchi et al. (1998); Weigelt et al. (1998); Haniff & Buscher (1998)) and also polarization studies (Trammell, Dinerstein & Goodrich (1994); Kastner & Weintraub (1994)) suggests that the onset of this aspherical flow has already begun, probably within the last few hundred years. With a privileged vantage onto such a brief yet important period in the evolution of a low to intermediate mass (initial mass – 5 M⊙ Guelin et al. (1995)) star, high resolution observations are crucial in distinguishing between the many competing models for the physical mechanisms underlying the onset of asymmetry in the birth of a planetary nebula.
In this paper, we present a 7-epoch diffraction-limited imaging study of the inner dust shell of IRC +10216 in the near-infrared K-band. Although some interpretation of the morphology of the images is given, full radiative transfer modelling results are beyond the scope of this report, and will be presented in a second paper. Instead, we emphasize here the detection and measurement of the motion of features presumably embedded in the outflow. Although proper motions have been reported for near-infrared images of dusty Wolf-Rayet shells (Tuthill, Monnier & Danchi (1999); Monnier, Tuthill & Danchi (1999)), the two order-of-magnitude slower winds around Asymptotic Giant Branch (AGB) stars result in the requirement of longer time bases, and extremely high fidelity mapping schemes.
2. Observations and Results
2.1. Observations
Diffraction-limited images of IRC +10216 were obtained at seven separate epochs with the Keck I telescope, with dates and other observing details given in Table 1. Observations used the technique of aperture masking interferometry, by which starlight from the primary mirror is selectively blocked, with only a few regions of the pupil allowed to contribute to the final image. For observations of bright compact objects, of which IRC +10216 is a prime example, the methods of sparse-pupil interferometry have been shown to be fully competitive with, or superior to, other techniques such as speckle interferometry. Statistical methods based on the maximum-entropy technique (Sivia (1987)) have been used to recover maps from the complex visibility data; however alternate methods such as the CLEAN algorithm (Högbom (1974)) produced similar results. Data reduction and analysis procedures were also tested by observing a number of test objects, such as known binary stars, on each night. A detailed description of the Keck aperture masking experiment covering the observational techniques, data reduction, and image reconstruction can be found in Tuthill et al. (2000).
| Epoch | Date | Mask | Filter11
Filter Wavelength Information (m):
kcont 2.260 0.053 ch4 2.269 0.155 k 2.214 0.427 |
Phase22Stellar Phases from Monnier, Geballe & Danchi (1998) |
|---|---|---|---|---|
| 1 | 1997 Jan 29 | Golay15 | kcont | 0.72 |
| 1 | 1997 Jan 29 | Annulus | kcont | 0.72 |
| 2 | 1997 Dec 16 | Annulus | kcont | 1.23 |
| 2 | 1997 Dec 16 | Golay21 | kcont,ch4 | 1.23 |
| 2 | 1997 Dec 18 | Golay21 | kcont | 1.23 |
| 3 | 1998 Apr 14 | Golay21 | ch4 | 1.41 |
| 3 | 1998 Apr 15 | Annulus | ch4 | 1.41 |
| 4 | 1998 Jun 04 | Golay21 | ch4 | 1.49 |
| 5 | 1999 Jan 05 | Annulus | ch4 | 1.83 |
| 5 | 1999 Jan 05 | Golay21 | ch4 | 1.83 |
| 6 | 1999 Feb 04 | Golay21 | ch4 | 1.88 |
| 6 | 1999 Feb 04 | Annulus | ch4 | 1.88 |
| 7 | 1999 Apr 25 | Annulus | k,ch4 | 2.00 |
| 7 | 1999 Apr 25 | Annulus | ch4 | 2.00 |
At each epoch in Table 1, a number of observations of IRC +10216 were made, often with quite distinct experimental setups. Three different aperture masks were used over the course of the project, with the non-redundant Golay-type masks passing only a few percent, and the partially-redundant annulus mask passing around ten percent of the unobstructed pupil. Three different filters were also employed at various epochs, with the bandpass characteristics given in Table 1. This diversity of observing parameters, while in part representing experimental evolution, allowed us to tailor the observations to conditions and specific requirements on a given night. However, no systematic differences were found when comparing maps from annulus and Golay data, and more significantly, from any of the different filters used (filters differ in bandwidth, but have similar center frequencies; c.f. Table 1). Thus for the remainder of this work, all maps taken at one observing epoch are treated as measuring the same quantities.
Two limitations of the interferometrically reconstructed maps should be mentioned. Firstly, the absolute photometry, or surface brightness scale in the maps, is difficult to calibrate with any great accuracy. For this reason, images shown have fluxes scaled relative to the peak intensity in each map, and discussion will refer to these relative fluxes. Secondly, the closure phase method does not deliver absolute positional information, and the center of each map has been chosen to be the location of the brightest pixel.
2.2. Morphology of IRC +10216
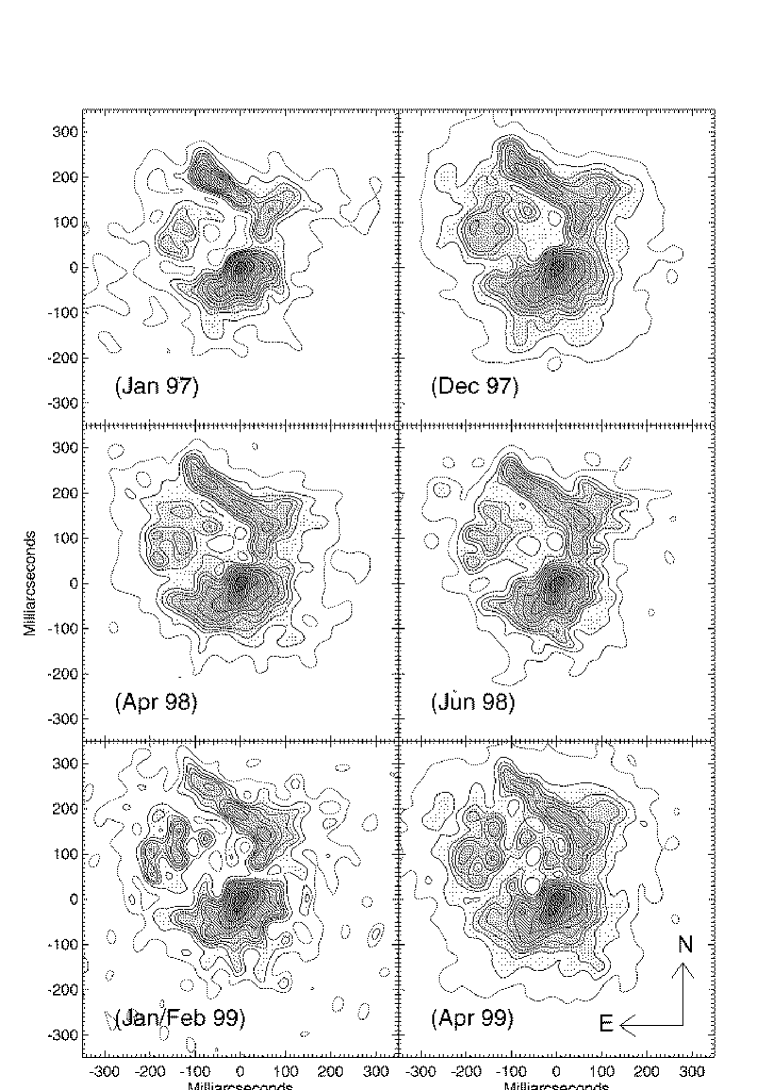
Figure 1 shows maps of IRC +10216 from data spanning a period from 1997 January to 1999 April. In this figure, maps shown are the noise-weighted average over all image reconstructions from a given epoch (or, in the case of Jan/Feb 99, pair of epochs). Simple inspection shows that the basic morphology of the inner nebula surrounding IRC +10216 has been very well established in the K band. From the most prominent structures down to relatively minor features at only a few percent of the peak surface brightness, a high degree of consistency is found in the sequence of images. Furthermore, the early epoch images shown in Figure 1 are also in excellent agreement with recently published near-infrared images of Weigelt et al. (1998) and Haniff & Buscher (1998) (We refer collectively to these two papers as “WHB” hereafter).
In order to proceed with a quantitative analysis of the maps, a simple descriptive model has been used to identify and label features. WHB have labelled compact features A through D, with Weigelt et al. (1998) adding E and F which seem much less distinct. With the considerably higher resolution available from the Keck, these compact knots have in most cases been resolved into more complicated structures, and therefore a different approach is taken in describing the images, which we relate to the earlier schemes.
A skeleton diagram of our model, based on analysis of images from Figure 1, is given in Figure 2. The location of the brightest feature in all maps, the relatively compact core, appears as a + surrounded by rings showing its approximate extent (Feature A of WHB). This core appears somewhat offset to the North-West from the center of an elongated, roughly elliptical region (Features E & F of Weigelt et al. (1998)). We refer to the Core and these immediate surroundings as the Southern Component in Figure 2. The next most prominent structure in the maps is the linear extension to the North and North-East, which we have split into two; the shorter North Arm (WHB Feature C) and the more prominent, elongated, North-East Arm (WHB Feature B). The important North-East Arm we have modelled as a linear ridge of emission. Displaced to the East between these other features is a dimmer structure, consisting of multiple peaks we have labelled the Eastern Complex (WHB Feature D). Although signal-to-noise was not uniformly high enough to be assured of high-fidelity reconstructions of the Eastern Complex, for the purposes of characterizing the structure, we have labelled the most southerly portion Cloud EC1 (usually a little brighter and appearing like a ring or three peaks in a triangle), while in the more northern section we have been content to simply tag the location of the two most prominent peaks.

2.3. Proper Motions and Modelling
Having established in the previous section a framework for describing the appearance of the maps of IRC +10216, we now proceed to examine the data for changes over the seven epochs. The easiest thing to look for is a change in the relative positions of the components. This was done with the use of a computer program which found the best-fit location of model components describing four features: the North-East Arm, EC1, and two minor peaks in the Eastern Complex. As our maps have no associated astrometry, the registration between separate images is unknown and we have used the bright compact core as the fixed point against which to measure any motions. Note that fits were not made directly to the averaged images presented in Figure 1, but to the full 7-epoch dataset with multiple separate images at each epoch (comprising a total of 25 maps). This allowed errors to be determined on the locations of the features from the apparent spread of values over different maps.
All four features tracked were found to exhibit widening separations from the core as a function of time. This can be verified by visual inspection of the images of Figure 1 where the Northward motion of the North-East Arm is readily apparent without any assistance from computer model-fits. Motions of the North-East Arm and elements in the Eastern Complex including EC1 are shown in Figure 2. To avoid the confusion of seven sets of features on one plot, the motion is shown averaged into four time-intervals (labelled t1 – t4), as described in the caption.
In addition to the motions of certain features, other changes are apparent with time in Figure 1, at a level of significance well above the level of noise in the maps. Two of these in particular are worth highlighting. The North-East Arm which in 1997 January ends in a bright, fairly compact knot, evolves through a stage where it is of fairly uniform brightness along its length (1998), and in the final measurements (1999) the extreme end of the arm has dimmed considerably. The second interesting change concerns the central core, which in 1997 January appears fairly circular and compact, but by 1999 April clearly exhibits an extension to the South-East. Further discussion of these points is given in Section 3 below.
2.4. Outflow Velocities
Having established the presence of motion between the components, it is possible to characterize the apparent outflow of material by watching the features which are presumably embedded within it. We restrict our attention to the North-East Arm and EC1, as the more minor features are too near to the map noise level to make useful tag points for the flow. The first important question to be addressed is the assumption as to the origin of the flow. WHB present arguments that their component A, the compact core, be identified as the star itself. Certainly, features identified to be moving do appear to be moving away from a point to the South, and in our subsequent analysis we have assumed radial divergence from the compact core. However, there is no guarantee that any of the map features must be the stellar disk, which may lie behind some optically thick region, as is discussed further below.
It was fairly straightforward to project the motion of EC1 onto a vector beginning at the origin (the brightest pixel in the core; see Figure 2). Displacement along this vector with time then gives a velocity. Motion of the North-East Arm, however, is not so easy to quantify. The minimum possible apparent velocity consistent with the time-sequence of images would have material in the arm moving to the North-West, perpendicular to its length. While giving a lower bound on the possible velocity, this motion is not consistent with spherical outflow from our defined origin, and furthermore does not really describe the data as the arm would also need to grow in length. Instead, we have labelled points NE1 & NE2 near the beginning and end of the arm respectively, and we measure the radial motion of these points from the origin. Since the Arm has been fit as a linear ridge, two points are sufficient to completely determine its motion. Thus our three trace points in the flow are EC1 and the two points NE1 & NE2 on the North-East Arm, all of which are assumed to be radially diverging from the Core.
Plotted in Figure 3 are the displacements from the origin of each trace point over the seven epochs. For the well-determined points NE1 & NE2 lying on the high signal-to-noise North-East Arm, the points can be seen to describe a very well defined linear relationship with time, which is echoed, with more scatter, by the EC1 data. Velocities may be computed from the slope of a least-squares fit to the data, with resulting apparent outflow rates given in Figure 3.

2.5. Outflow Velocity Dispersion
The most direct way to observe an accelerating body is to follow its change of speed with time. Unfortunately, the error bars are too great, and the time-span of observation too short to make this strategy worthwhile for data in Figure 3. A uniform radial acceleration of 3.4 mas.yr-2 (see below) has been over-plotted (dotted line) illustrating the difficulty of measuring such a small curvature of the velocity law. However, some information on the flow dynamics can be inferred from examination of the velocity field derived from the maps. Specifically, the greater the distance from the origin, the higher the outflow speed. Three possible explanations for this finding are described below.
The acceleration of material over the region sampled by the measurements may have been detected. This acceleration can be easily visualized from the motion of the North-East Arm: the ridge-lines of best fit are not parallel causing the Arm to tilt Northward with time. In order to do this, the far end of the arm (NE2) must be moving faster than the near end (NE1). The three flow-velocity data points from Figure 3 are consistent with a uniform radial acceleration of mas.yr-2 starting at a radius of mas. As the principle acceleration mechanism is expected to be radiation pressure from the central star, a uniform acceleration law would not be expected. However, in a region as clearly anisotropic as the inner dust shell of IRC +10216, flows may be complex and more realistic models will require greater efforts both in modelling and in recovery of longer time-baseline data.
A second possible explanation for the observed velocity field arises from the ambiguities associated with the projection of three-dimensional structure onto the plane of the sky. Such projected motions and velocities may give a misleading view of the true flow structure. To take an extreme example, the North-East Arm may, in reality, be a fragment of a circular arc, all of which is at a uniform distance from the star and moving at a uniform velocity. However, when viewed from a relatively acute projected angle, apparent differences in separation and velocity will be recorded. For a roughly spherical distribution of clumps at a uniform flow speed, projection effects alone would result in slower apparent speeds being observed closer to the star, mimicking an acceleration. The uniform ‘acceleration’ law given above is appropriate for such a scenario, where the velocity will be proportional to the displacement from the origin.
Finally, a third possibility which presents itself is that faster material is found further out (e.g velocity law ), but without acceleration taking place over the sampled region. The most obvious origin for such a flow would be a stellar eruption ejecting material with a range of velocities at some point in the past, allowing faster clumps to move further from the star. Under this scenario, back-projection of the flow through time, based on the NE1 & NE2 velocities, implies that the North-East Arm was created in an event around JD 2449000 (about 1993 January) originating from a point some 90 mas from the core. Ideally, the assumption of a single expulsion event could be tested with three or more clumps by seeing if they appear to be diverging from a single point in space and time. Unfortunately, the errors on the EC1 flow are too large to offer a meaningful constraint, although a common origin for NE1, NE2 & EC1 does fall within the errors.
In summary, although acceleration stands as a strong candidate, the ambiguities of interpretation make it impossible to claim a clear detection. Indeed, some combination of all three effects discussed above may be needed to account for the true angular velocity field. This highlights the need for high quality imaging over more extended periods to follow clumps from birth to dispersal in the extended shell. Despite the uncertainties, a plane-of-the-sky assumption represents a simplest case and should give, at the least, valid lower bounds to the velocity determinations discussed here.
3. Discussion
Taking the Southern Component and the North-East Arm as the dominant bright structures in our images, the bipolarity at position angle reported throughout the literature is confirmed here. However, at very high resolution, complex and clumpy structures are revealed which do not conform immediately to any simple axially symmetric models. Perhaps one of the most striking features of the maps of Figure 1 is the Dark Lane (see Figure 2), around which all the major structures are distributed. At all epochs, the flux level in this hole, in close proximity to all the brightest knots of emission, is consistent with a surface brightness of % of the peak: similar to the noise level in the maps. That such a dark region could exist in the heart of the nebula argues for the presence of considerable material in the line-of-sight, leading to high levels of obscuration. If this is the case, the interpretation of the maps becomes more difficult. A bright knot might be either a hot clump of dust, or a “window” in the dust allowing a glimpse of the hot inner regions.
The modelling of the dust shell is a current work in progress, with the most promising interpretation being that the dark central band is a dusty torus or equatorial density enhancement, which we can see tilted towards us to the South revealing the inner hot regions (Southern Component) and possibly the star (Core). Clumpy features embedded in the outflow, such as the North-East Arm and Eastern Complex, might have their origins in enhanced dust formation occurring above slowly-evolving massive convective features (Weigelt et al. (1998)) or magnetic spots (Soker & Clayton (1999)) on the stellar surface. Interestingly, no changes observed over the seven epochs, which cover more than one pulsational cycle (638 days), gave clear evidence for new dust nucleation (discounting the elongation of the Core, discussed below). This is in accord with model dust shells (e.g. Winters Fleischer Gauger & Sedlmayr (1995)) which show new layers of dust forming on timescales longer than one pulsation period.
Until further modelling can be completed, we confine further discussion here to the motion of material in the outflow. For features such as the North-East Arm, it seems most likely that motions detected are simply the displacement of emitting material, and not some more exotic scenario such as the motion of a viewing hole in the dust, or a warm spot caused by a ‘searchlight beam’ where the star shines through a moving window in the dust. The North-East Arm does exhibit some common-sense characteristics reinforcing this view, such as the flux from the bright knot at its extreme end, initially bright, fading as it moves outwards and presumably further from the central star (see Section 2.3).
Perhaps the greatest uncertainties affecting the interpretation are the questions as to the origin and direction of the flow, and the three-dimensional structure of the nebula. Although Figure 2 does appear to show that features are moving away from a point in the general location of the Southern Component, it was not possible to pin this down precisely. Worse, it was not possible to tell if the Southern Component and Core were moving also: it may be the case that all features are diverging from the star which lies obscured behind the dark central band. A number of previous authors (WHB, Kastner & Weintraub (1994)) have claimed that the central star is visible in near-infrared. The compact feature we have labelled the Core has an approximate angular size of mas – close to the expected angular diameter of the stellar photosphere (Danchi et al. (1994); Monnier (1999)). However the progressive elongation of the Core through time (see Section 2.3; Figure 1) is not easy to reconcile with this view. It is possible that the South-East extension we see is simply the newest condensation of dust moving from the star, however for this to be the case the dust must be forming extremely close () to the photosphere. The inner radius of the dust shell has been recently estimated at (Groenewegen (1997)) and (Monnier (1999)). It may also be possible that a binary companion is playing some role in this inner distortion, although it is highly unlikely that direct light from a main-sequence star could have been seen. In this work, the assumption has been made that the Core does mark a fixed location associated with the star, with extra structure in the Southern Component arising from emission and/or partial obscuration from the inner boundary of the dust shell. Alternate scenarios, in which the Core may also be moving, lead to modification of the derived velocities by up to a factor of 2.
The gas outflow velocity at large distances from the star is well established from CO line profile studies to be 14.5 km.sec-1, however as calculated by Groenewegen (1997), the dust will drift through the gas at 3 km.sec-1 resulting in a dust outflow speed of 17.5 km.sec-1. Combining this with our maximum angular velocity of 25.5 mas.yr-1 from Figure 3 yields a distance estimate of 145 pc to IRC +10216. This is in accord with modern estimates lying in the range 110 – 170 pc (Winters, Dominik & Sedlmayr (1994); Le Bertre (1997); Groenewegen, Van Der Veen & Matthews (1998)). However, there are too many uncertainties involved to place high confidence in this result. In addition to the geometric ambiguities already mentioned, it is unclear if the dust clump followed here (NE2) has finished accelerating and is at its terminal velocity. Furthermore, the value of V∞ measured in the spherical molecular shell may not be a good measure of the inner dust motions. It is difficult to imagine that any dramatic change from spherical outflow to an equatorial disk and bipolar lobes in IRC +10216 did not also entail changes in the velocity structure.
Taking a distance of 145 pc, proper motions of 11.5, 17.8 & 25.5 mas.yr-1 (Figure 3) imply outflow velocities of 7.9, 12.2 & 17.5 km.sec-1 for points NE1, EC1, and NE2 respectively. As computed above, the velocity structure is consistent with an apparent uniform acceleration of mas.yr-2 from rest at mas. However, the projection of a three-dimensional motion onto the plane of the sky, and unknowns associated with the initial conditions of each clump may also account for the range of observed flow speeds. Models of radiatively-driven dust acceleration predict a more complicated velocity law dependent upon many properties of star and the outflowing gas and dust (Kwok (1975); Papoular & Pegourie (1986)). However, detailed comparison with such predictions is premature until the velocity of a single feature can be shown to be changing over time.
4. Conclusions
Diffraction-limited images recovered using interferometric techniques from a multi-epoch study spanning more than two years at the Keck I telescope are presented. Taken in the near-infrared K Band, the maps have revealed an asymmetric and clumpy structure at angular resolutions exceeding the expected diameter of the stellar photosphere ( 50 mas). The most likely morphology for the circumstellar environment is an optically thick circumstellar disk or torus, possibly tilted towards the line of sight in the South revealing the hot inner cavity and emission from the stellar photosphere. The angular separations of clumps of material thought to be in the Northern bipolar lobe have been followed over time, revealing increasing separation from the compact core to the South. Outflow velocities derived from this motion are consistent with estimates of the radial outflow velocity (from CO measurements) and the expected distance. Clumps at greater distances from the Core were found to show increasing velocities, which may be taken as evidence for acceleration in the inner regions; the effects of geometrical projection; or the result of a past event which ejected material with a range of velocities. In addition to the changing separations of components, the appearance of the inner nebula was found to be evolving in other ways, however none were interpreted as evidence for new dust condensation over the pulsation cycle. Further modelling of this system is currently underway, and will be presented in a subsequent paper.
References
- Bieging & Tafalla (1993) Bieging, J. H. & Tafalla, M. 1993, AJ, 105, 576
- Danchi et al. (1994) Danchi, W. C., Bester, M., Degiacomi, C. G., Greenhill, L. J., & Townes, C. H. 1994, AJ, 107, 1469
- Danchi et al. (1998) Danchi, W. C., Tuthill, P. G., Bester, M., Lipman, E. A., Monnier, J. M. & Townes, C. H. 1998, ASP Conf. Ser. 154: Tenth Cambridge Workshop on Cool Stars, Stellar Systems, and the Sun, 10, 361
- Groenewegen (1997) Groenewegen, M. A. T. 1997, A&A, 317, 503
- Groenewegen, Van Der Veen & Matthews (1998) Groenewegen, M. A. T., Van Der Veen, W. E. C. J. & Matthews, H. E. 1998, A&A, 338, 491
- Guelin et al. (1995) Guélin, M., Forestini, M., Valiron, P., Ziurys, L. M., Anderson, M. A., Cernicharo, J. & Kahane, C. 1995, A&A, 297, 183
- Haniff & Buscher (1998) Haniff, C. A. & Buscher, D. F. 1998, A&A, 334, L5
- Högbom (1974) Högbom, J. 1974, ApJS, 15, 417
- Kastner & Weintraub (1994) Kastner, J. H. & Weintraub, D. A. 1994, ApJ, 434, 719
- Kwok (1975) Kwok, S. 1975, ApJ, 198, 583
- Le Bertre (1997) Le Bertre, T. 1997, A&A, 324, 1059
- Mauron & Huggins (1999) Mauron, N. & Huggins, P. J. 1999, A&A, 349, 203
- Monnier, Geballe & Danchi (1998) Monnier, J.D., D., Geballe, T. R. & Danchi, W. C. 1998, ApJ, 502, 833
- Monnier (1999) Monnier, J.D. 1999, Ph.D. diss., University of California, Berkeley.
- Monnier, Tuthill & Danchi (1999) Monnier, J. D., Tuthill, P. G. & Danchi, W. C. 1999, ApJ, 525, L97
- Papoular & Pegourie (1986) Papoular, R. & Pegourie, B. 1986, A&A, 156, 199
- Sivia (1987) Sivia, D.S. 1987, Ph.D. diss., Cambridge Univ.
- Skinner, Meixner & Bobrowsky (1998) Skinner, C. J., Meixner, M. & Bobrowsky, M. 1998, MNRAS, 300, L29
- Soker & Clayton (1999) Soker, N. & Clayton, G. C. 1999, MNRAS, 307, 993
- Trammell, Dinerstein & Goodrich (1994) Trammell, S. R., Dinerstein, H. L. & Goodrich, R. W. 1994, AJ, 108, 984
- Tuthill, Monnier & Danchi (1999) Tuthill, P.G., Monnier, J.D., Danchi, W.C. 1999b, Nature, 398, 487
- Tuthill et ak. (2000) Tuthill, P. G., Monnier, J. D., Danchi W. C., Wishnow, E. H. & Haniff C. A. 2000, PASP, 112, In Press
- Weigelt et al. (1997) Weigelt, G., Balega, Y.Y., Hofmann, K. -H., Langer, N. & Osterbart, R. 1997, Science with the VLTI Interferometer, F. Paresce (ed.), Springer, Berlin, p. 206
- Weigelt et al. (1998) Weigelt, G., Balega, Y., Bloecker, T., Fleischer, A. J., Osterbart, R. & Winters, J. M. 1998, A&A, 333, L51
- Winters, Dominik & Sedlmayr (1994) Winters, J. M., Dominik, C. & Sedlmayr, E. 1994, A&A, 288, 255
- Winters Fleischer Gauger & Sedlmayr (1995) Winters, J. M., Fleischer, A. J., Gauger, A. & Sedlmayr, E. 1995, A&A, 302, 483
- Zuckerman & Aller (1986) Zuckerman, B. & Aller, L. H. 1986, ApJ, 301, 772