Intervening O VI Quasar Absorption Systems at Low Redshift:
A Significant Baryon Reservoir11affiliation: Based on observations with the NASA/ESA Hubble
Space Telescope, obtained at the Space Telescope Science Institute, which
is operated by the Association of Universities for Research in Astronomy,
Inc., under NASA contract NAS 5-2555. The data were reduced with the STIS
Team software, and the research was supported by NASA through grants
GO-08165.01-97A and GO-08165.02-97A from STScI.
Abstract
Far-UV echelle spectroscopy of the radio-quiet QSO H1821+643 ( = 0.297), obtained with the Space Telescope Imaging Spectrograph (STIS) at 7 km s-1 resolution, reveals 4 definite O VI absorption line systems and one probable O VI absorber at 0.15 0.27. The four definite O VI absorbers are located near galaxies and are highly displaced from the quasar in redshift; these are likely intervening systems unrelated to the background QSO. In the case of the strong O VI system at = 0.22497, multiple components are detected in Si III and O VI as well as H I Lyman series lines, and the differing component velocity centroids and values firmly establish that this is a multiphase absorption system. A weak O VI absorber is detected at = 0.22637, i.e., offset by 340 km s-1 from the = 0.22497 system. Ly absorption is detected at = 0.22613, but no Ly absorption is significantly detected at 0.22637. Other weak O VI absorbers at = 0.24531 and 0.26659 and the probable O VI system at 0.21326 have widely diverse O VI/H I column density ratios with (O VI)/(H I) ranging from to . The number density of O VI absorbers with rest equivalent width 30 mÅ in the H1821+643 spectrum is remarkably high, 48, with a high (90%) confidence that it is greater than 17. We conservatively estimate that the cosmological mass density of the O VI systems . With an assumed metallicity of 1/10 solar and a conservative assumption that the fraction of oxygen in the O VI ionization stage is 0.2, we obtain . This is comparable to the combined cosmological mass density of stars and cool gas in galaxies and X-ray emitting gas in galaxy clusters at low redshift.
Subject headings:
cosmology: observations — galaxies: halos — intergalactic medium — quasars: absorption lines — quasars: individual (H1821+643)1. Introduction
The resonance line doublet of Li-like O VI is a sensitive probe of hot collisionally ionized or warm very low density photoionized gas in the intergalactic medium and galaxy halos. The O VI 1031.92, 1037.62 doublet has been detected in absorption toward QSOs over a wide range of redshifts (see §1 in Tripp & Savage 2000). The lowest redshift O VI absorbers are particularly interesting because the redshifts of galaxies near the QSO sight lines can be measured, and the relationship between the O VI absorber properties and environment can be studied. Furthermore, cosmological simulations predict that a substantial fraction of the baryons in the universe are in a shock-heated phase at K at low (e.g., Cen & Ostriker 1999; Davé et al. 1999), and preliminary results indicate that low- O VI systems may indeed be an important baryon reservoir (Tripp & Savage 2000). In a previous paper, Savage, Tripp, & Lu (1998) studied an intervening O VI absorber associated with two galaxies at 0.225 in the spectrum of the radio-quiet QSO H1821+643 using a combination of low resolution Hubble Space Telescope (HST) spectra with broad wavelength coverage and a high resolution HST spectrum with very limited wavelength coverage. We have re-observed this QSO with an echelle mode of the Space Telescope Imaging Spectrograph (STIS) on HST, which provides a resolution of 7 km s-1 (FWHM) with broad wavelength coverage. In this paper we present in §2 and §3 new results on one probable and four definite O VI absorption line systems in the STIS H1821+643 spectrum. In §4 we discuss the implications of the high rate of occurance of O VI absorbers at low redshift. The direct information we obtain about the highly ionized state of the gas from the presence of O VI allows us to estimate the baryonic content of these systems. We conclude that O VI systems are likely to harbor an important fraction of the baryons at the present epoch.
2. Observations and Absorption Line Measurements
H1821+643 was observed with STIS for 25466 seconds on 1999 June 25 with the medium resolution FUV echelle mode (E140M) and the 0.20.06” slit.111HST archive ID numbers O5E703010–O5E7030E0. This STIS mode provides a resolution of 46000 or FWHM 7 km s-1 (Kimble et al. 1998). The data were reduced as described by Tripp & Savage (2000) including the scattered light correction developed by the STIS Instrument Definition Team. The spectrum extends from 1150 to 1710 Å with four small gaps between orders at 1630 Å. Throughout this paper wavelengths and redshifts are heliocentric.
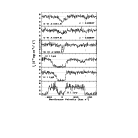
We first searched the spectrum for O VI absorbers by checking for lines with the velocity separation and relative line strengths expected for the doublet. This identified the four definite O VI systems. We then searched for O VI lines associated with known Ly absorbers, and this revealed the probable system (see below). A selected sample of the spectrum is shown in Figure 1. This portion of the spectrum shows the O VI doublet at = 0.22497 as well as a much weaker O VI doublet at = 0.22637. Both of these O VI absorbers are discussed in §3.1. In addition to the O VI systems in Figure 1, the STIS echelle spectrum shows new O VI absorbers at = 0.24531 and 0.26659 which have small equivalent widths; these systems are briefly discussed in §3.2 along with a possible O VI system at = 0.21326. The = 0.21326 system is a strong H I Ly/Ly absorber with a line detected at the expected wavelength of O VI 1031.93. However, the corresponding O VI 1037.62 line is blended with Milky Way S II 1259.52 absorption due to two high velocity clouds, so we consider this a probable but not definite O VI detection. The component structure establishes that this blend is mostly due to Milky Way S II, but it is possible that an O VI 1037.62 line of the right strength is present as well. In principle this could be proved by comparing the S II 1259.52 line strengths to the S II 1250.58, 1253.81 line strengths. However, this does not yield a clear result at the current S/N level due to ambiguity of the continuum placement near 1259 Å.
Restframe equivalent widths () of absorption lines detected in the O VI systems, measured using the software of Sembach & Savage (1992), are listed in Table 1. Note that the quoted errors in equivalent width include contributions from uncertainties in the height and curvature of the continuum as well as a 2% uncertainty in the flux zero point. Integrated apparent column densities (Savage & Sembach 1991) are also found in Table 1 with error bars including contributions from continuum and zero point uncertainties. To measure line widths, we used the Voigt profile fitting software of Fitzpatrick & Spitzer (1997) with the line spread functions from the Cycle 9 STIS Handbook.
3. Absorber Properties
Four of the five absorption systems in Table 1 are within a projected distance of 1 Mpc or less of at least one galaxy with 300 km s-1, and some of them are close to multiple galaxies (see Table 1 in Tripp et al. 1998). These absorbers are also displaced from the QSO redshift by 7100 km s-1 ( = 0.26659) to 17100 km s-1 ( = 0.22497). Finally, the O VI profiles are relatively narrow. Therefore these are probably intervening systems that trace the large-scale gaseous environment in galaxy envelopes and the IGM rather than “intrinsic” absorbers (Hamann & Ferland 1999).
3.1. O VI Absorbers at z = 0.22497 and 0.22637
Since the O VI doublets at = 0.22497 and 0.22637 shown in Figure 1 are separated by only 340 km s-1, they are probably related and we discuss them together. Two emission line galaxies are known at heliocentric redshifts of 0.22560 and 0.22650 at projected distances of 105 and 388 kpc from the sight line222In this paper, the cosmological parameters are set to km s-1 Mpc-1 and = 0.0. (Tripp et al. 1998). In addition to the O VI doublet, the STIS spectrum shows strong absorption lines due to H I Ly , Ly, Ly, Si III 1206.5, and possibly C III 977.02 at = 0.22497; the absorption profiles of most of these species are plotted on a velocity scale in Figure 2. The lines of N V and Si IV are not detected at greater than 3 significance, and upper limits on their equivalent widths and column densities are listed in Table 1 along with upper limits on C II and Si II.
Figure 2 provides several indications that these systems are multiphase absorbers. Several components are readily apparent in most of the = 0.22497 profiles including the O VI lines (see also Figure 1). Fitting of the Si III profile yields = 7.7 and 1.6 km s-1 for the two well-detected components at = –3 and +25 km s-1, respectively. However, the component velocity centroids and -values are not compatible with a homogeneous mixture of O VI and Si III. For example, the Si III profile shows a prominent narrow component at 25 km s-1, and there is no obviously corresponding component in the O VI profiles. While thermal Doppler broadening can make the O VI profiles broader than those of Si III, at most the increase will be a factor of , and this is inadequate to produce the breadth of the observed O VI lines. Thus we are compelled to consider a mixture of phases, some of which show up in Si III, while others are prominent in O VI.
In the case of the O VI at = 0.22637, which is also visible in Figure 2, the multiphase nature is suggested by an offset of 60 km s-1 between the H I Ly and O VI velocity centroids. Also we note that no H I absorption is significantly detected at the velocity of the O VI suggesting that the hydrogen is thoroughly ionized in the O VI gas. This O VI absorber may be analogous to the highly ionized high velocity clouds seen near the Milky Way which show strong high ion absorption with very weak or absent low ion absorption (Sembach et al. 1999).
3.2. Other Weak O VI Systems
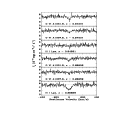
The two new O VI systems at = 0.24531 and = 0.26659 are plotted in Figure 3. A striking feature of these weak O VI absorbers (and the candidate O VI at = 0.21326) is that while their O VI column densities are comparable, the strengths of their corresponding H I absorption lines are significantly different (see Table 1 and Figure 3). For example, (O VI)/(H I) = 5.2 in the = 0.24531 system while (O VI)/(H I) = 1.2 in the = 0.26659 absorber. The contrast is even more dramatic with the = 0.21326 absorber, which has (O VI)/(H I) . For reference, in collisional ionization equilibrium (Sutherland & Dopita 1993), gas with solar metallicity at the peak O VI ionization temperature should have (O VI)/(H I) 100. The large variablility of the observed O VI/H I ratio could indicate that the metallicity of the O VI absorbers varies substantially, or this could be due to differences in the physical conditions and ionization of the gas. If, for example, these are multiphase absorbers with the H I lines arising in a cool phase which is embedded in a hot phase which produces the O VI absorption (e.g., Mo & Miralda-Escudé 1996), then the wide variations in the O VI/H I ratio could simply be due to interception of fewer cool phase clouds in one absorber compared to another.
A full analysis of the range of physical conditions of these absorbers will be presented in a later paper. However, it is interesting to note that the H I Ly profile of the = 0.26659 system is rather broad and relatively smooth (see the bottom panel of Figure 3), which may indicate that this absorber is collisionally ionized and hot. However, fitting a single component to the = 0.26659 Ly profile yields , which implies that K. At this temperature the O VI ionization fraction is rather small in collisional ionization equilibrium (Sutherland & Dopita 1993), and an unreasonably high metallicity is required to produce the observed (O VI) and (H I) in the same gas. This may be another indication that these are multiphase absorbers or that the gas is not in ionization equilibrium.
4. Number Density and Cosmological Mass Density
The new STIS data in this paper provide an opportunity to evaluate the number density of low- O VI absorbers per unit redshift () and a lower limit on their cosmological mass density. If we neglect continuum placement uncertainty and other systematic error sources, the STIS E140M spectrum of H1821+643 is formally adequate for detection of narrow lines with 30 mÅ at 1188 Å ( 0.151 for O VI 1031.93). However, the continuum placement ambiguity substantially increases the uncertainty in for weak lines. Moreover, broader resolved lines spread over more pixels have higher limiting equivalent widths (limiting ), so broad weak lines may not be detected at the level. Consequently, the derived below should be treated as a lower limit. We require detection of both lines of the O VI doublet with 30 mÅ, and we exclude one absorber333We exclude the associated O VI absorber at = 0.2967. This system is not listed in Table 1 but is discussed in detail in Savage et al. (1998) and Oegerle et al. (2000). within 5000 km s-1 of to avoid contamination of the sample with intrinsic absorbers. This results in a sample of three O VI systems444The three systems include those at = 0.22497, 0.24531, and 0.26659. We exclude the probable system at = 0.21326, and the = 0.22637 system falls below the equivalent width threshold. over a redshift path of = 0.063 (after correction for a loss of = 0.061 for spectral regions in which either of the O VI lines is blocked by ISM or extragalactic lines from other redshifts). Therefore the most probable 48 for 30 mÅ and 0.15 0.27, and we conservatively conclude that 17 at the 90% confidence level (following the Gehrels 1986 treatment for small sample statistics). This is a remarkably high number density. It is important to emphasize that the sample is extremely small and, since very little is known about weak O VI lines at low redshift, it remains possible that is unusually high toward H1821+643 for some reason. However, there is supporting evidence that is generally high: (1) a similar is derived from STIS echelle spectroscopy of PG0953+415 (Tripp & Savage 2000), and (2) one or two additional intervening O VI absorbers are evident in the H1821+643 spectrum which did not satisfy the selection criteria to be included in the sample. More observations are needed to build the sample of weak O VI lines at low .
For comparison, low to moderate redshift Mg II absorbers with 20 mÅ have (Churchill et al. 1999; see also Tripp, Lu, & Savage 1997). The stronger O VI absorbers are less common; Burles & Tytler (1996) report for O VI systems with 210 mÅ at = 0.9. Evidently, the of the weak O VI lines is substantially larger than of other known classes of low metal absorbers and is more comparable to that of low weak Ly absorbers, which have 100 for 50 mÅ (Tripp et al. 1998; Penton et al. 2000).
Following analogous calculations (e.g., Storrie-Lombardi et al. 1996; Burles & Tytler 1996),555Note that while Burles & Tytler (1996) calculated the cosmological mass density of the oxygen ions in O VI absorbers (which is quite small), they did not apply an ionization and metallicity correction to estimate the total baryonic content of the O VI systems. Instead, they used this method to place a lower limit on the mean metallicity of the O VI systems. the mean cosmological mass density in the O VI absorbers, in units of the current critical density , can be estimated using
| (1) |
where is the mean atomic weight (taken to be 1.3), (O VI) is a representative O VI ionization fraction, (O/H) is the assumed mean oxygen abundance by number in the O VI absorbers, (O VI) is the total O VI column density from the absorbers, and is the absorption distance interval (Bahcall & Peebles 1969), corrected for blocked spectral regions. With the sample defined above, we have where [O/H] = log (O/H) - log (O/H)⊙. To set a conservative lower limit on (O VI), we assume [O/H] = 0.3 and (O VI) = 0.2 (which is close to the maximum value in photo- or collisional ionization, see Tripp & Savage 2000), which yields (O VI) . If we set the mean metallicity to a more realistic value such as [O/H] = 1, (O VI) increases to . Similar lower limits on (O VI) have been derived by Tripp & Savage (2000) using a slightly less sensitive sample based on STIS echelle spectroscopy of PG0953+415 and earlier Goddard High Resolution Spectrograph observations of H1821+643. The lower limit assuming (O/H) = 1/10 solar is comparable to the combined cosmological mass density of stars, cool neutral gas, and X-ray emitting cluster gas at low redshift, 0.006 (Fukugita, Hogan, & Peebles 1998). Though still uncertain due to the small sample,666For a discussion of the impact of small number statistics on the (O VI) estimates, see Tripp & Savage (2000). small redshift path probed, and uncertain (O/H), these preliminary lower limits on (O VI) suggest that O VI absorbers contain an important fraction of the baryons in the low redshift universe.
References
- (1) Bahcall, J. N., & Peebles, P. J. E. 1969, ApJ, 156, L7
- (2) Burles, S., & Tytler, D. 1996, ApJ, 460, 584
- (3) Cen, R., & Ostriker, J. P. 1999, ApJ, 514, 1
- (4) Churchill, C. W., Rigby, J. R., Charlton, J. C., & Vogt, S. S. 1999, ApJS, 120, 51
- (5) Davé, R., Hernquist, L., Katz, N., & Weinberg, D. H. 1999, ApJ, 511, 521
- (6) Dufton, P. L., Hibbert, A., Kingston, A. E., & Tully, J. A. 1983, MNRAS, 202, 145
- (7) Fitzpatrick, E. L., & Spitzer, L. 1997, ApJ, 475, 623
- (8) Fukugita, M., Hogan, C. J., & Peebles, P. J. E. 1998, ApJ, 503, 518
- (9) Gehrels, N. 1986, ApJ, 303, 336
- (10) Hamann, F., & Ferland, G. 1999, ARA&A, 37, 487
- (11) Kimble, R. A., et al. 1998, ApJ, 492, L83
- (12) Mo, H. J., & Miralda-Escudé , J. 1996, ApJ, 469, 589
- (13) Morton, D. C. 1991, ApJS, 77, 119
- (14) Oegerle, W. R., et al. 2000, ApJ, in preparation
- (15) Penton, S. V., Shull, J. M., & Stocke, J. T. 2000, ApJ, submitted, astro-ph/9911128
- (16) Savage, B. D., & Sembach, K. R. 1991, ApJ, 379, 245
- (17) Savage, B. D., Tripp, T. M., & Lu, L. 1998, AJ, 115 436
- (18) Sembach, K. R., & Savage, B. D. 1992, ApJS, 83, 147
- (19) Sembach, K. R., Savage, B. D., Lu, L., & Murphy, E. 1999, ApJ, 515, 108
- (20) Storrie-Lombardi, L. J., McMahon, R. G., & Irwin, M. J. 1996, MNRAS, 283, L79
- (21) Sutherland, R. S., & Dopita, M. A. 1993, ApJS, 88, 253
- (22) Tripp, T. M., Lu, L., & Savage, B. D. 1997, ApJS, 112, 1
- (23) Tripp, T. M., Lu, L., & Savage, B. D. 1998, ApJ, 508, 200
- (24) Tripp, T. M., & Savage, B. D. 2000, ApJ, submitted
| aaObserved vacuum Heliocentric wavelength of the line centroid. | Species | bbRestframe vacuum wavelength from Morton (1991). Oscillator strengths used for these measurements were also obtained from Morton (1991) except for the Si II 1260.42 value, which is from Dufton et al. (1983). | ccRestframe equivalent width integrated across all components. | ddIntegrated apparent column density . |
|---|---|---|---|---|
| (Å) | (mÅ) | ( cm-2) | ||
| = 0.21326 | ||||
| 1474.93 | H I | 1215.67 | 47114 | eeSaturated absorption line. Lower limits are derived from integrated apparent column densities with pixels with flux 0 set to their 3 upper limits. |
| 1244.47 | H I | 1025.72 | 1349 | |
| 1252.07 | O VIffThis line is probably the stronger line of the O VI doublet. However, the line identification is less secure than the other O VI lines in this table because the weaker O VI line at 1037.62 Å is blended with Milky Way S II 1259.52 absorption. With higher signal-to-noise, it should be possible to confirm or refute this identification. | 1031.93 | 389 | |
| = 0.22497 | ||||
| 1488.97 | H I | 1215.67 | 85222 | eeSaturated absorption line. Lower limits are derived from integrated apparent column densities with pixels with flux 0 set to their 3 upper limits. |
| 1256.41 | H I | 1025.72 | 50314 | eeSaturated absorption line. Lower limits are derived from integrated apparent column densities with pixels with flux 0 set to their 3 upper limits. |
| 1191.27 | H I | 972.54 | 34017 | eeSaturated absorption line. Lower limits are derived from integrated apparent column densities with pixels with flux 0 set to their 3 upper limits. |
| 1264.09 | O VI | 1031.93 | 1859 | |
| 1271.05 | O VI | 1037.62 | 11010 | |
| Si II | 1260.42 | 47gg4 upper limit. | 0.31gg4 upper limit. | |
| 1477.93 | Si III | 1206.50 | 1089 | |
| Si IV | 1393.76 | 4823hhA 2 feature is detected at the expected wavelength, but we do not consider this significance adequate to claim a reliable detection. Consequently, we set an upper limit on which is the measured column density of the marginal line + 2. | 1.3hhA 2 feature is detected at the expected wavelength, but we do not consider this significance adequate to claim a reliable detection. Consequently, we set an upper limit on which is the measured column density of the marginal line + 2. | |
| C IIiiThe somewhat stronger C II 1334.53 line falls in a gap between orders. | 1036.34 | 40gg4 upper limit. | 3.6 | |
| 1196.79 | C III?jjThe strength and velocity extent of this line is surprising compared to the strength and velocity extent of the Si III 1206.5 line. However, it is difficult to find convincing alternative identifications of this strong feature. The line may be a blend. | 977.02 | 31916 | ddIntegrated apparent column density . |
| N V | 1238.82 | 52gg4 upper limit. | 2.5gg4 upper limit. | |
| = 0.22637 | ||||
| 1490.57 | H I | 1215.67 | 16815 | |
| 1265.53 | O VI | 1031.93 | 255 | |
| 1272.49 | O VI | 1037.62 | 215 | |
| = 0.24531 | ||||
| 1513.86 | H I | 1215.67 | 459 | |
| 1285.07 | O VI | 1031.93 | 556 | |
| 1292.15 | O VI | 1037.62 | 396 | |
| = 0.26659 | ||||
| 1539.75 | H I | 1215.67 | 17712 | |
| 1307.04 | O VI | 1031.93 | 558 | |
| 1314.26 | O VI | 1037.62 | 328 | |