Nearly Coherent Oscillations in Type I X-Ray Bursts from KS 1731260
Abstract
We present an analysis of the full set of Rossi X-Ray Timing Explorer (RXTE) observations of KS 1731260 made between 1996 August and 1999 February, concentrating on the nine type I X-ray bursts that were observed. We find that the bursts divide naturally into two populations: “fast bursts” occur on the Banana Branch when the accretion rate is high and exhibit short decay times, high peak fluxes, and radius expansion episodes. “Slow bursts” occur in the Island State at lower accretion rates, have lower peak fluxes, higher fluences, longer decay times, and show no evidence of radius expansion. All five of the fast bursts, and none of the four slow bursts, show coherent oscillations near 524 Hz. Thus the mechanism that produces the burst pulsations may well be related to the helium-rich burning process indicated by the other properties of the fast bursts.
We perform in-burst phase connection of the burst pulsations, which allows us to unambiguously characterize their frequency evolution. That evolution exhibits a variety of behaviors, including a sharp spin-down during one burst. The frequency evolution exhibited by two bursts that occurred 2.6 years apart is consistent with nearly the same exponential-relaxation model; in particular, the asymptotic frequencies of the two bursts differ by only Hz. The evolution during another burst, not modeled as exponential, shows a maximum frequency which is Hz greater than the smaller of these asymptotic frequencies. Applying our phase models, we find that the pulsations are spectrally harder than the burst emission, with the strength of the pulsations increasing monotonically with photon energy. Coherently summing all of the burst signals, we find upper limits of 5% relative to the power of the main pulse on any modulation at 1/2 or 3/2 the main pulse frequency. We discuss our results in the context of models in which the burst pulsations are produced by a hot spot on the surface of a spinning neutron star.
To be published in ApJ v. 542
1 Introduction
KS 1731260 is a transient X-ray binary system located near the galactic center, discovered in August 1989 using the imaging spectrometer aboard the Mir-Kvant observatory (Sunyaev, 1989). Three type I X-ray bursts were observed from the source during 24 1000 s observations spanning 15 days (Sunyaev et al., 1990), which established that the source was a neutron star low mass X-ray binary (LMXB). Subsequent ROSAT observations confirmed that KS 1731260 was a typical neutron star LMXB (Barret, Motch, & Predehl, 1998). The source has been detected once in hard X-rays (35–150 keV) by SIGMA, making KS 1731260 one of several neutron star LMXBs with states similar to the low-hard states of black hole binaries, but during several other observations no hard tail was detected (Barret et al., 1992). Recently, attention has focused on KS 1731260 because it is one of only four sources displaying both coherent oscillations during a type I X-ray burst (at 524 Hz; Smith, Morgan, & Bradt (1997)) and twin kilohertz quasi-periodic oscillations with an approximately constant separation in Fourier frequency; in KS 1731260 the measured frequency difference is close to half of the burst frequency (Wijnands & Van der Klis, 1997).
In this paper we report on a comprehensive analysis of the nine X-ray bursts that were observed during observations of KS 1731260 with the Rossi X-ray Timing Explorer (RXTE) between 1996 August and 1999 February. The bursts occurred while the persistent luminosity varied systematically, which allows us to study how the properties of the bursts correlate with the spectral states of the source. Five of the bursts exhibited coherent oscillations, and we systematically investigate what conditions correspond to the presence of these oscillations. Finally, we have tracked the evolution of the phases of the burst oscillations, which allows us to place tight constraints on any long-term change in oscillation frequency, to derive upper limits on the strength of sub-harmonics and harmonics of the observed burst frequency, and to determine the strength and energy spectrum of the pulsations.
To place this work in context, we begin by reviewing briefly the phenomenology and theory of type I X-ray bursts. In Section 1.1, we examine how the properties of bursts have been observed to correlate with the properties of the persistent emission in several sources, and how theories address these correlations. In Section 1.2, we discuss the observations of nearly coherent oscillations during type I X-ray bursts and their possible connection with the spin period of the underlying neutron star. The remainder of the paper concerns the analysis (Section 2) and interpretation (Section 3) of RXTE observations of KS 1731260.
1.1 The diversity of type I X-ray bursts
Type I X-ray bursts have been observed from more than 45 low-mass X-ray binary systems (LMXBs; see (Lewin, Van Paradijs & Taam, 1993) for a review, and (Cocchi et al., 1998) for some recent discoveries). These bursts occur when unstable nuclear burning of helium or hydrogen ignites matter accreted onto the surface of the neutron star primary. The models reproduce the observed rise times (1 s), durations (1 minute), and recurrence times (hours) of bursts, spectral softening in the burst tails, and total energies of the bursts ( ergs). Detailed models predict variations in the frequency and strength of bursts from a single source due to changes in the composition of the burning material, which is in turn determined by the metallicity of the matter accreted onto the neutron star, the amount of hydrogen burned during the time between bursts, and the amount of fuel left-over from the previous burst (Fujimoto, Hanawa, & Miyaji, 1981; Ayasli & Joss, 1982; Fushiki & Lamb, 1987; Fujimoto et al., 1987; Bildsten, 1997). In addition, variations from source to source are expected because of variations in the core temperatures of the neutron stars and accretion rate (Ayasli & Joss, 1982; Fushiki & Lamb, 1987).
The theoretical models that are most readily compared to observations of burst sources are those that predict how burst properties in an individual system should change as the accretion rate onto the neutron star varies. Of the forty-odd bursting LMXBs, only about ten have had their burst and persistent emission properties correlated; for the majority of sources, either few bursts are seen, or several bursts are seen in a single luminosity state (Lewin, Van Paradijs & Taam, 1993). Nonetheless, studies of these ten sources reveal some intriguing relationships between the persistent emission and the recurrence times, durations, and energetics of the bursts which can be compared to theoretical models.
The model of Fujimoto, Hanawa, & Miyaji (1981) predicts that X-ray bursts should occur in three regimes depending on the accretion rate (), which they label Cases 1, 2, and 3. We denote these accretion rates in units of the Eddington accretion rate, . At the lowest accretion rates (, Case 3), the temperature in the burning layer is too low for stable hydrogen burning; the hydrogen ignites unstably, in turn triggering helium burning, which produces a type I X-ray burst in a hydrogen-rich environment. At higher accretion rates (, Case 2), hydrogen burns stably via the hot CNO cycle and is converted to helium as quickly as material is accreted onto the neutron star. A pure helium layer develops at the base of the accreted material, and heats steadily until a pure helium burst is triggered. At higher accretion rates (, Case 1), material is accreted faster than it can be consumed by hydrogen burning (which is limited by the rate of -decays in the CNO cycle), so that the helium ignites unstably in the H-rich environment (see Bildsten 1998 for dependences of these accretion rates on the metallicities). At higher accretion rates (), stable helium burning becomes important on the surface of the neutron star, which depletes the primary fuel reserves and causes bursts to occur less frequently.
Hanawa & Fujimoto (1982) point out that the accretion rate inferred from the luminosity of any given neutron star LMXB that exhibits bursts can range from , so that an individual source that varies in luminosity should exhibit changes in its bursting behavior between Case 2 and Case 1. This model provides three predictions.
First, as the accretion rate increases, the column of material above the burning layer builds more quickly, and thus the time required to reach the critical temperature for unstable helium burning decreases. This is consistent with the increase in burst rate with persistent flux observed in 4U 172834 (Basinska et al., 1984) and 4U 182030 (Clark et al., 1977). At the highest accretion rates, steady helium burning reduces the amount of fuel for X-ray bursts, which causes bursts to occur less often, as seen in EXO 0748676 (Gottwald et al., 1986) and 4U 170544 (Langmeier et al., 1987), or not at all, as observed in 4U 182030 (Clark et al., 1977) and GX 31 (Makishima et al., 1983). However, no correlation was found between persistent flux and burst recurrence times in Ser X-1 (Sztajno et al., 1983), 4U 173544 (Lewin et al., 1980; Van Paradijs et al., 1988), and 4U 163653 (Lewin et al., 1987), which suggests either that an additional mechanism may control how frequently bursts occur, or that the persistent flux is not a good measure of the accretion rate in these sources (see below).
Second, the ratio of the energy released in the bursts to that released by accretion between bursts should be larger when large amounts of hydrogen are burned during a burst, and should decrease as more helium is added to the nuclear burning layer. Assuming that all of the accreted material is eventually consumed in a burst, this ratio is simply the amount of energy released by the nuclear reactions — the CNO cycle for hydrogen burning, and the triple- process for helium burning — divided by the gravitational energy released by the accreted material. Historically, the inverse of this ratio is used, and defined as . The expected values for are , where the lower value corresponds to pure hydrogen burning, which releases about four times the energy per nucleon than helium burning does. The value of was observed to increase as expected (from 12 to 75) as the persistent flux from EXO 0748763 increased by a factor of five (Gottwald et al., 1986). However, several sources exhibit values as large as , which suggests that both hydrogen and helium burn steadily during the periods of steady accretion between bursts (Van Paradijs, Pennix, & Lewin, 1988; Bildsten, 1995).
Third, the larger the fraction of helium in a burst, the faster nuclear energy will be released (via the triple-alpha process) during the helium flash, so that the peak flux of the burst will be higher (Fujimoto, Hanawa, & Miyaji, 1981; Ayasli & Joss, 1982). Conversely, if more hydrogen is present in the burning material, as in Cases 1 and 3, then helium will be diluted, slowing the rise of the burst. The hydrogen will, however, burn slowly in the tail of the burst via proton capture onto the products of the helium burning. Thus the fastest, most intense bursts should occur under Case 2, which corresponds to low accretion rates. Surprisingly, this is precisely contrary to the sense of the majority of the observations. The decay time scales of bursts from 4U 160852 (Murakami et al., 1980), 4U 163653 (Lewin et al., 1987), and 4U 170544 (Langmeier et al., 1987) have all been reported to decrease with increasing flux. The peak fluxes of bursts were found to increase as the persistent flux increased in EXO 0748676 (Gottwald et al., 1986), 4U 160852 (Murakami et al., 1980), and Ser X-1 (Sztajno et al., 1983), although 4U 170544 (Langmeier et al., 1987) and 4U 173544 (Lewin et al., 1980; Van Paradijs et al., 1988) exhibit no apparent correlation between the peak fluxes of bursts and the persistent flux. A survey of ten LMXBs by Van Paradijs, Pennix, & Lewin (1988) reveals a global decrease in burst duration with increasing flux. The sense of these observations is that the fastest, most intense bursts occur at high accretion rates. The origin of this discrepancy is uncertain (see Bildsten 2000 for a recent discussion).
It is apparent that for each correlation mentioned above, only a few sources can be cited as examples. This is largely because two systematic difficulties interfere with observation of these effects. First, recurrence times and values for bursts are difficult to measure because most satellites observe from low Earth orbit, where the Earth occults most sources for a significant fraction of every hour. Since bursts recur on a time scale of hours, many bursts are missed during occultation. Only EXOSAT, with its 91 hour orbit, was relatively free from this difficulty.
Second, the persistent flux from an LMXB is not a monotonic function of accretion rate. As the trends predicted by the model of Fujimoto, Hanawa, & Miyaji (1981) are a function of the accretion rate, it is not surprising that correlations between burst properties and persistent flux would not be evident in every source. A better measure of accretion rate is provided by the color-color diagram (Van der Klis, 1995). Indeed, in the atoll source 4U 163653 both the burst duration and the apparent temperature of the emission in the burst tails were found to be correlated with the position on the color-color diagram, but not with the flux (Van der Klis et al., 1990). Observations using instruments prior to the EXOSAT mission did not provide sufficient timing and/or spectral information to deduce the spectral state of LMXBs on a color-color diagram unambiguously. Fortunately, the excellent time and energy resolution available with RXTE allows us to examine the relationship between burst properties and accretion rate in sources such as KS 1731260.
1.2 Burst pulsations and kilohertz quasi-periodic oscillations
Although type I X-ray bursts are useful measures of the energetics, time scales and recurrence frequencies of nuclear burning on neutron stars, the bursts are only observed after the energy has propagated through the neutron star envelope, and so they are not direct probes of the burning layer itself. The discovery of near-coherent oscillations during type I bursts from several sources using data from the Proportional Counter Array (PCA; (Jahoda et al., 1996) of the Rossi X-ray timing Explorer (RXTE; Bradt, Rothschild, & Swank (1993)) has opened a new and extremely valuable window onto X-ray bursts and the neutron stars underlying them (see (Strohmayer, Swank, & Zhang, 1998a) for a review). The oscillations have been seen in both rising and cooling phases of the bursts and have extremely high coherence values (), although the pulse frequency often drifts by up to 2 Hz over the course of the burst (Strohmayer et al., 1998b; Strohmayer & Markwardt, 1999). In particular, the oscillations sometimes relax towards an asymptotic frequency which is identical in bursts separated by several years — stable enough (to less than one part in one thousand) that it has been suggested it might be used to constrain the binary mass function (Strohmayer et al., 1998b).
The obvious candidate for a pulsation of this high coherence and long-term stability is the spin period of the neutron star (Strohmayer et al., 1996). Under this interpretation, it is usually proposed that the modulation is the result of localized burst emission (a “hot spot”) on the neutron star surface. Several lines of argument support this hypothesis. First, the fractional amplitudes of the oscillations in the rise of bursts are generally strongest on the leading edge of the bursts, and are undetectable at the burst peak when a large portion of the neutron star surface is in conflagration (Strohmayer, Swank, & Zhang, 1998a). Second, the RMS strength of the oscillations in the rise of the bursts is very high, up to 30% in 4U 172834 (Strohmayer, Zhang, & Swank, 1997) and 50% in 4U 163653 (Strohmayer et al., 1998c); note that in both cases the authors report the half-amplitude, which is a factor of 1.4 larger than the RMS amplitude). This would be expected if the initial burning is confined to a small area on the neutron star surface (Miller & Lamb, 1998). Finally — although it is not understood how a hot spot could survive the initial conflagration on the neutron star — pulse phase-resolved spectroscopy of an oscillation seen in the tail of a burst from 4U 163653 indicates that the flux modulation is accompanied by a modulation of the blackbody temperature of the spectrum, again as expected (Strohmayer et al. 1998a). A similar conclusion has been reached for a burst from Aql X-1 through the detection of soft lags in the burst photons, which are attributed to Doppler shifts of the light from the fast-moving hot spot (Ford, 1999).
The favored model for the drifts in frequency is that they indicate an expansion of the burning layer by 10–30 m at the burst start. During the expansion, the rotation of the burning layer slows, only to relax back to the neutron star surface and spin up again later in the burst (Strohmayer et al., 1998b). Cumming & Bildsten (2000) have shown that the hydrostatic expansion expected during the burst is consistent with that observed, and that the shear layers are likely stabilized by the strong stratification in the atmosphere. Consistent with this hydrostatic model, Strohmayer (1999) observed a decrease in frequency of the burst pulsations during the tail of a burst from 4U 163653 which was coincident with a re-heating episode.
Still, there are several unanswered questions regarding the hot spot interpretation. Even in sources where the burst pulsations are seen, not all bursts show them, which suggests that the creation of a hot spot requires special conditions. (Until now, no systematic search for correlations between the presence of coherent oscillations and the properties of the bursts or the persistent emission has been carried out.) Moreover, as mentioned above, it is not known how a hot spot could remain on the surface of the neutron star after the initial burning phase, which presumably envelops the whole neutron star (Strohmayer, Zhang, & Swank, 1997). Finally, Miller (2000) finds that in one burst from 4U 163653 (his Burst C) the pulsations have an “asymptotic” frequency that is significantly less than the highest frequency observed during the burst, which is hard to reconcile with the simple picture of a burning layer contracting and re-coupling to the underlying neutron star.
The importance of the burst oscillations has been further enhanced by the detection of quasi-periodic oscillations (QPOs) in the 200–1200 Hz frequency range in power density spectra (PDS) of the persistent emission from numerous LMXBs. These so-called kHz QPOs (for reviews, see Van der Klis (1997), Van der Klis (2000)) may reflect the relativistic motions of material at the inner edge of the accretion disk in these systems (Strohmayer et al., 1996; Miller, Lamb, & Psaltis, 1998; Stella & Vietri, 1999). The relative ubiquity of pairs of kHz QPOs — with the twin peaks separated by a frequency difference that stays roughly constant as the frequencies of the peaks increase (Strohmayer et al., 1996; Van der Klis et al., 1997) — leads naturally to beat-frequency models which identify as the spin frequency of the neutron star, (Strohmayer et al., 1996; Miller, Lamb, & Psaltis, 1998).
Initially this interpretation was supported by the observation that was consistent (within errors) with the burst frequency , or half that, in sources where both phenomena were observed. This coincidence was evident in 4U 172834 and 4U 170242 (), and in 4U 163653 and KS 1731260 (). (Note that in the burst-pulsation sources Aql X-1 and MXB 174329 twin kHz peaks have not been detected to date.) The detection of a sub-harmonic signal in 4U 163653 (Miller, 1999) has lent the idea further support by demonstrating that the strongest signal in the bursts from this source is actually at the first harmonic of the spin period, , so that .
However, it has also since been observed that (1) is not constant in Sco X-1 (Van der Klis et al., 1997), 4U 160852 (Méndez et al., 1998), and 4U 172834 (Méndez & Van der Klis, 1999); (2) kHz QPO data from all other sources are equally consistent with a changing or a constant (Psaltis et al., 1998); and, (3) the “equalities” in 4U 172834 and 4U 163653 do not in fact hold ( in 4U 172834, (Méndez & Van der Klis, 1999); and in 4U 163653, (Méndez, Van der Klis, & Van Paradijs, 1998).
One response to this dilemma is proposed by Osherovich & Titarchuk (1999), who suggest that the decreasing difference frequency is that of a differentially rotating magnetosphere. In their model, the lower kHz QPO represents the Keplerian frequency at the inner disk, and the upper kHz QPO occurs at an upper hybrid frequency of Keplerian blobs in elliptical orbits, with the frequency determined by the Coriolis force acting in the frame of reference rotating with the neutron star magnetosphere. Another set of models states that the upper and lower kHz QPOs are the general relativistic Keplerian and periastron precession frequencies near the inner edge of the accretion disk (Stella & Vietri, 1999). The difference frequency in these latter models is unrelated to the spin period of the neutron star, and the apparent relationship between and is taken to be a coincidence.
It is therefore critical to determine the nature of the coherent oscillations observed during bursts in order to distinguish between models for the kHz QPOs. KS 1731260 provides crucial observational evidence for testing the current models, as it is one of only four sources for which both the burst frequency and the difference frequency have been measured.
2 Observations and Data Analysis
We have analyzed all 27 observations of KS 1731260 taken between 1996 July 14 to 1999 February 27 with the Proportional Counter Array aboard RXTE (Table 1). During these observations, nine X-ray bursts are seen, including the one previously reported by Smith, Morgan, & Bradt (1997).
2.1 Characterization of persistent emission and source state
In order to characterize the persistent emission from KS 1731260, we have created background-subtracted light curves of the X-ray intensity of KS 1731260 from Standard2 data for each observation. We have calculated the ratios of the count rates in the 3.4–4.8 keV 2.0–3.4 keV bands (soft color), and in the 8.5–18.0 keV 4.8–8.5 keV bands (hard color) for 256 s interval during each observations. The mean count rates and hardness ratios, excluding time intervals containing bursts, are listed in Table 1. Figure 1 displays the color-color diagram for this set of observations. The states with the lowest observed count rates correspond to points with a hard color of , while those points with higher count rates have a hard color . The count rate from the source is not a monotonic function of position on this diagram (Table 1). Although motion on the branch with lower hard color is observed in the course of several hours, the transition from a hard color to occurred between observations separated by more than a month.
We have produced power-density spectra (PDS) of photons in the 2–60 keV RXTE band for each observation, in order to determine whether KS 1731260 exhibits the canonical branches of the color-color diagram for LMXBs (Van der Klis, 1995). The PDS of each observation have been created by combining averaged PDS from data with s time resolution in 64 s intervals with a single PDS of data with s time resolution for the entire observation. Bursts are excluded from the PDS. We have found that PDS are of two types, as represented in Figure 2. Figure 2a is representative of PDS from observations with hard colors , which can be described as the sum of relatively weak (2% RMS) low frequency noise below 0.1 Hz and strong (13% RMS) flat-topped high frequency noise that decreases in power above a few Hz. Figure 2b is representative of PDS from observations with hard colors , and which can be characterized as a combination of % RMS low frequency noise below 1 Hz and weak power (2% RMS) at high frequencies. Strong (% RMS) QPOs are not evident below 100 Hz in the PDS from either state, and although single kHz QPOs are evident on a few occasions in photons with energy above 5 keV (not shown), twin kHz QPOs are only evident in the observation reported on by Wijnands & Van der Klis (1997).
Taken together, the color-color diagram and PDS indicate that KS 1731260 is indeed an atoll source, as suggested by Wijnands & Van der Klis (1997) (for a review of Z and atoll LMXBs, see (Van der Klis, 1995); see (Méndez & Van der Klis, 1999) for a similar color-color diagram of the atoll source 4U 172834 as observed with the PCA on RXTE). The state with hard color is the Island State, which is thought to represent a low accretion rate ( 0.01 times the Eddington rate, ), while the state with hard color is the Banana State, thought to occur at a somewhat higher accretion rate (). This classification of KS 1731260 is consistent with the presence of strong X-ray bursts — only two Z-sources, GX 172 (Sztajno et al., 1986) and Cyg X2 (Kuulkers & Van der Klis, 1995), exhibit type I X-ray bursts. An arrow has been drawn on the color-color diagram to indicate the direction believed to correspond to increasing accretion rate.
We have estimated the source flux during each observation (Table 1) by fitting the Standard2 data summed over each RXTE orbit with a two-component model, consisting of an exponentially cut-off power-law (, where is the photon energy, is the power law photon index, is the cut-off energy, and is the photon flux at 1 keV) and a Gaussian line at 6.4 keV, which is likely due to iron emission. We have accounted for interstellar absorption with a low-energy cut-off equivalent to a column density of 1022 cm-2 of hydrogen (according to the value derived with ROSAT, (Predehl & Schmitt, 1995). The time intervals during bursts have been excluded from the spectra. Although we fit the spectra between 2.5–25 keV, the flux was calculated from the model between 2–18 keV, to correspond with the energy range used for the color-color diagram. The reduced chi-squared value for this model is less than 1.1 for all observations except 20058-01-01-00, 30061-01-03-00, and 30061-01-04-01, for which the reduced chi-squared values are near two. The derived flux is not significantly affected by the poor values of reduced-chi squared, and we report all values in Table 1. For a more detailed discussion of the X-ray spectrum of KS 1731260 as observed by RXTE see Barret et al. (1999).
2.2 Characterization of type I X-ray bursts
Table 2 lists the times (corrected to the Earth-Sun barycenter) of the nine bursts observed with the PCA. We have integrated spectra for each 0.25 s interval during these bursts using combinations of the binned and event mode data for each observation. This provides 32 energy channels for the first burst and 74 energy channels for the remainder of the bursts. Since the effect of the X-ray burst on the spectrum of the persistent emission is unknown, it is not clear what “background” should be subtracted from the total received flux in order to obtain the true burst spectrum. Therefore we have estimated the background in two independent ways, representing two extremes of approach: (1) we have used the FTOOL pcabackest to determine the instrumental and cosmic background, including both the persistent and burst flux in our fits; and (2) we have used the spectrum of 100 s of data prior to the burst as background, subtracting the persistent emission under the assumption that it is unaffected by the burst. (We note that it is possible that persistent emission increases during the burst, with accretion induced by the burst itself, but we have no theoretical guidelines for modeling such a process and therefore ignore it.) We have fit the resulting background-subtracted spectra between 2.5–25 keV with a single blackbody (without absorption, since fits with absorption favor very small values of the column density and do not improve chi-squared significantly), which provides two parameters: the apparent temperature and solid angle of the emission region. From the solid angle we can derive the apparent radius of the emission region given a derived or assumed distance to the source. From the model parameters, we calculate the bolometric flux for each interval during the burst, .
We have compared spectral fits after subtracting the background in these two ways, and find that the resulting parameters are very similar, although using the pcabackest estimate of the background increases for the fit by a factor of 1.3–1.6 relative to fits with the pre-burst emission subtracted. The increase in is almost certainly due to the presence of flux from steady accretion in the spectra that remain after subtracting the pcabackest estimate. To keep the spectral model simple, we report results only for spectra obtained after subtracting the pre-burst emission. The resulting spectral parameters should be interpreted with some caution, because it is not likely that the burst emission is a pure black body: on the contrary, electron scattering in the neutron star atmosphere is likely to cause systematic deviations in the spectrum which would result in systematically high (and thus low ) at a given flux (see also the discussion in Section 3).
We have analyzed the profile and strength of the bursts by finding the rise time , start time of the decay , decay time scale , maximum flux , fluence , and duration for each burst (Table 2). The rise time has been defined as the time for the burst to increase from 25% to 90% of the peak flux. The start time of the decay is the approximate time when the flux begins decreasing exponentially, measured from the start of the burst. We have fit the decay in flux of each of these bursts with either one or two successive exponential functions, , (for four and five bursts, respectively, depending on the value of reduced chi-squared for a fit with a single exponential) in order to estimate the time-scale for the decay of the bursts. The exponential fits work well; for all of the bursts, . Finally, we have summed the flux from the burst up to the start of the burst decay with the flux in the burst tail, as determined by integrating the exponential fit, to determine the fluence of the burst .
The spectral fits reveal which of the bursts exhibited an episode of radius expansion (last column in Table 2). We have found that four bursts exhibit radius expansion episodes. In all cases the effective area of the emitting region expands by a factor of 2.5–5.2. Since the maximum luminosity during the radius expansion episodes is thought to represent the Eddington luminosity of the neutron star , we can use the maximum peak flux from all of the radius-expansion bursts, erg cm-2 s-1, to estimate the distance to the source via erg s-1(see Van Paradijs, Pennix, & Lewin, 1988), where we have taken the corresponding to a pure helium photosphere for a 1.4 neutron star, and the redshift of the photosphere to be zero when the peak flux is measured. We use the largest value because some variation in the peak flux in radius expansion bursts is to be expected, as the observed Eddington luminosity decreases when a lower fraction of helium is present in the photosphere, when there is any anisotropy in the burst emission, and when the redshift of the photosphere at its maximum observed expansion is larger. Our estimate places an upper limit to the distance to KS 1731260 of kpc. The previous estimate of the distance to KS 1731260 was derived from the flux from Burst 1 in the same manner as above by Smith, Morgan, & Bradt (1997). The interstellar absorption column may be variable by as much as a factor of two, and therefore is not a useful measure of the distance to the source (see (Barret, Motch, & Predehl, 1998).
The spectral parameters from three representative bursts — a large burst without radius expansion (Burst 3), a large burst with radius expansion (Burst 9), and a weak burst without radius expansion (of which we observe only one case, Burst 7) — are displayed in Figure 3. The apparent radius of the blackbody has been plotted assuming that the distance to KS 1731260 is 7 kpc. The radius expansion bursts tend to be shorter than the bursts without radius expansion (as indicated by in Table 2).
We have indicated the spectral state during which the bursts occurred by the numbers in Figure 1. The placement of the numbers indicates the colors of the persistent emission immediately before the burst, and a square has been drawn around the burst number if the burst exhibited radius expansion. All of the bursts which exhibit radius expansion episodes (Bursts 1, 2, 8, and 9) occurred while KS 1731260 was on the Banana Branch, with hard color less than 0.5, while all of the large bursts without radius expansion episodes (Bursts 3, 4, 5, and 6) occurred while KS 1731260 was in the Island State, with hard color greater than 0.6. The single small Burst 7 occurred on the banana branch, which is not surprising given its small and short decay time scale. This behavior was also seen in EXOSAT observations of other sources (e.g. (Van der Klis et al., 1990)).
Following Gottwald et al. (1986), in Figure 4 we have plotted the apparent radius during bursts from KS 1731260 (top panels) and the bolometric flux in the burst (bottom panels) as a function of apparent temperature. The numbers in the figure indicate the burst from which the data have been taken. We have only plotted points where the burst flux is greater than 15% of the peak flux from the burst, because at lower fluxes the uncertainty on the spectral parameters becomes large (see Figure 3). The panels on the left, for values of the persistent flux greater than erg cm-2 s-1, represent the bursts which occurred on the Banana Branch. The panels on the right, for values of the persistent flux less than erg cm-2 s-1, represent the bursts which occurred in the Island State.
A two-branch pattern in the vs. relationship is evident in bursts from the Banana branch (top-left panel of Figure 4), which is not present for the bursts from the Island State (top-right panel). The right-side ( keV) excursion to high km represents the radius expansion phase at the start of the burst (note that Burst 7 exhibits no radius expansion, and therefore does not follow this track), while the excursion at lower temperatures ( keV, km) represents an increase in the apparent emitting area in the tails of the fast bursts (e.g. Fig. 3b).
It is impossible to precisely determine the time interval between bursts and the ratio of energy released in the persistent to the bursting luminosity (), because KS 1731260 was occulted by the Earth for about a third of every 90 minute RXTE orbit, and the observed bursts occurred infrequently. We can only roughly estimate the rate with which bursts occurred and the values of during four intervals with more than 10 ks of exposure time over the course of a few days (see Table 1). The values that follow are uncertain by about a factor of two because of the small number of bursts detected. For 1997 October 28 to 29, the source was on the Banana Branch and one burst was observed during 13.9 hours of exposure, suggesting an approximate rate of 0.07 hr-1. Integrating both the persistent (Table 1) and bursting flux (Table 2) over the exposure time during this interval, we find . No bursts were observed during 13.9 hours of observations during the interval from 1998 July 31 to August 1, also on the Banana Branch, which is consistent with the single burst seen in the first interval. KS 1731260 was in the Island State for 1998 October 2 to 6, and the approximate burst rate was hr-1 with . During 1999 February 22 to 27 the source was again on the Banana Branch, and the burst rate was hr-1 with . The burst rate does not seem to show any correlation with the spectral state of the source, which suggests that some parameter other than the accretion rate determines the frequency with which bursts occur. On the other hand, the values of are at least a factor of six higher when KS 1731260 is on the Banana Branch () than when it is in the Island State (). This is consistent with the previous EXOSAT phenomenology as well, which pointed to higher values when the bursts were short and radius expansion was prevalent, and thus to more helium-dominated bursts.
We have attempted to determine whether bursts could have occurred regularly during the four time intervals above by assuming that they recur with times distributed in a Gaussian fashion about a mean time interval. We have determined the probability that we could have observed bursts at the times in Table 2 given recurrence intervals between 0.2 and 20 hours. Depending on the interval, we find that either (1) no constant mean recurrence time is consistent with the observed bursts (and lack thereof); or (2) the only consistent recurrence times are longer than our estimate of the burst times above, which would suggest that we were “lucky” to observe the bursts that we did. An alternative possibility is that bursts from KS 1731260 occur in clusters, similar to the behavior of Ser X-1 (Sztajno et al., 1983), 4U 173544 (Lewin et al., 1980; Van Paradijs et al., 1988), and 4U 163653 (Lewin et al., 1987).
2.3 Search for burst pulsations
In a uniform search for burst pulsations, we have produced power density spectra (PDS) for 1 s intervals for the first 15 seconds of the bursts (starting from the second before the burst rise), using data from the 2–20 keV energy range binned to a time resolution of s. We have searched these PDS over 5 Hz frequency intervals centered at 262, 524, and 1048 Hz for signals at the sub-harmonic, fundamental, and first harmonic of the signal observed by Smith, Morgan, & Bradt (1997) in the first burst. Our detection threshold power (99%-confidence) is 24.4 when normalized according to the criteria of Leahy et al. (1983), taking into account all of the examined bins. We then took into account the distribution of noise powers in the PDS, and inverted the function of Groth (1975) using the algorithm in the Appendix of Vaughan et al. (1994) to calculate either 1- uncertainties on measured powers, or 99% upper limits to the true powers when none was detected significantly. Assuming any signal power (or upper limit) is produced by a sinusoidal variation of amplitude , we can invert the relationship
where is the power in frequency bin , and is the Nyquist frequency of the PDS, in order to find the oscillation amplitude (Leahy et al., 1983). Table 3 reports the RMS amplitudes of the largest detected oscillations, or upper limits on oscillations derived from the largest observed power, for each of the bursts. Five signals have been detected at a frequency of 524 Hz, and no significant signals have been detected at the sub-harmonic or first harmonic. The signal in Burst 7 is significant with only 90%-confidence given our broad search parameters, but since there is a (much smaller) 0.2% chance that the signal could be due to noise in a search restricted to the first second of the burst rise, and since the significance of these pulsations has been confirmed by phase modeling (see below), we treat this signal as a detection. The RMS amplitude of the oscillation in Burst 7 is large only because the count rate in the rise of the burst is a factor of 2 smaller than the other bursts (compare Table 2).
A brief comparison of Table 3 and Figure 1 reveals a striking discovery. Bursts during which coherent oscillations were observed have been marked with a diamond in Figure 1. Along with Table 3, this figure reveals that all four of the burst signals that occur after the rise of the burst were found in bursts that exhibited radius expansion episodes (Bursts 1, 2, 8, and 9). As a signal is also found in the rise of Burst 7, all of the bursts seen on the Banana Branch exhibited coherent oscillations. On the other hand, none of the bursts in the Island State (Bursts 3, 4, 5, and 6) exhibited coherent oscillations (to the sensitivity of our search).
2.4 Characterization of burst pulsations
For the bursts with detected oscillations, we have examined the evolution of the burst pulsations by creating a dynamic power-density spectrum (Fig. 5). For these plots we have executed 4 s FFTs at 0.25 s intervals, oversampling the PDS by a factor of two to improve frequency resolution (see, e.g., Middleditch (1975); Chakrabarty (1996)) and applying a Welch window function (Press et al. 1992) to reduce the side-lobes on strong powers. For all bursts we have found that the strengths of the oscillations were enhanced by restricting our analysis to higher energy photons: for Burst 1 we select photons with energies above 3.6 keV, and for the remaining bursts we select photons with energies above 5.1 keV. Figure 5 shows the character of the frequency evolution in each case. In most cases contour levels represent powers that are powers of 10-1 in single-trial probability, starting with a 10% chance detection (where the signal is likely to be noise) at the outermost contour, and probablities of , , etc. for inner contours; in Burst 9, however, the pulsations are significantly stronger: the first contour is at a single-trial probability of , with further contours spaced by powers of 10-3.
For comparison purposes we also have provided, in the plots of Fig. 5, the 2–60 keV light curve of the bursts from Standard1 data (running from 0 to 24,000 PCA c s-1, full scale) and the burst blackbody radius as derived from our spectral fits (see above; a distance of 7 kpc is assumed). In Bursts 1, 2, 8, and 9 the burst pulsations commenced when the blackbody radius dropped below 10 km; in Bursts 7 and 8 a short set of oscillations occurred in the rise of the burst. Finally, we have plotted the frequency evolution as derived from our phase models (see below; approximate plus or minus one-sigma ranges are indicated), which confirms in more precise terms the overall picture given by the dynamic PDS.
We have observed frequency evolution in all cases, except during the rise of Bursts 7 and 8, when the duration of the signal is short, 1 s. The form of the frequency evolution in Bursts 1 and 9 is very similar: in both cases the frequency increases by approximately 0.5 Hz during the course of the burst decay, relaxing upwards in a quasi-exponential fashion. This behavior was not observed by Smith, Morgan, & Bradt (1997) because they created a single PDS every second, providing them with a frequency resolution of only 1 Hz. The frequency evolution we see in these bursts is strongly reminiscent of that seen in the burst sources 4U 172834 (Strohmayer et al., 1998b) and 4U 163653 (Strohmayer & Markwardt, 1999), although the magnitude of the fractional frequency shift is a factor of smaller.
Burst 2 shows the most complicated behavior, starting at a frequency of approximately 524 Hz and evolving towards 525 Hz in a sort of S-curve. Burst 8, in addition to showing pulsations on the burst rise, shows a substantial frequency decrease during the burst peak, joining the burst from 4U 163653 analyzed by Strohmayer (1999) and the additional burst from 4U 163653 analyzed by Miller (2000) as counterexamples to the spin-up behavior that initially seemed to characterize the burst oscillations.
2.5 Phase connection of burst pulsations
In order to make a quantitative study of the form of the frequency evolution, we have performed phase connection of the burst pulsations. The technique of phase connection is familiar from traditional radio (Manchester & Taylor 1977) and X-ray pulsar studies (e.g. Deeter, Pravdo & Boynton (1981), Kaspi, Chakrabarty & Steinberger (1999)), and allows for a precise characterization of the pulse train from a source even when individual pulses are not detectable in the data. Our phase connection procedure works as follows.
Beginning with the dynamic PDS, we identify the interval of strongest pulsations and their corresponding average frequency. We take each half-second of data from the burst, fold at the average frequency, test for the presence of significant modulation, and if sinusoidal modulation is present (with 90% confidence), cross-correlate the pulse profile with a sinusoid to determine the reference phase of the pulsation at the start of that half-second interval. We use twelve phase bins for our folded profiles; our results are not sensitive to this choice. The uncertainty in the reference phase is determined by Monte Carlo (MC) simulation: we randomly perturb the count rate for each phase bin within the range expected from Poisson counting noise and recalculate the reference phase 100 times for each phase point; our phase uncertainty is the standard deviation of these MC phases.
With reference phases and uncertainties in hand we connect the phases with a best-fit polynomial phase model. The accuracy of this model is then confirmed by epoch folding and phase referencing (i.e., the procedure described above) with respect to the model: a successful model, by accurately tracking the pulsations through their full evolution, will produce phase residuals scattered around zero, whereas an inaccurate model (where it evinces any modulation at all) will produce phase residuals evenly covering the (0.5, 0.5) interval past the point where the model breaks down. We take reference phases to lie between 0.5 and 0.5. Since the derived phase uncertainties are 0.10, chances that a 10-point phase model will serendipitously be “successful” by this criterion are entirely negligible. In some cases, the pulsations are strong enough that we can work with 0.25 s time intervals, and for the sake of better model constraints we do this for the pulsations during the rise of Bursts 7 and 8.
The above procedure can be iterated, as necessary, or applied to arbitrary phase models until a satisfactory chi-squared value is obtained. In our analysis we typically added terms until the model had the flexibility to accomodate the evolution seen in the dynamic PDS and, moreover, had a reasonable chi-squared value. Naturally, a (more or less) smooth polynomial evolution of the frequency is not guaranteed a priori; on the contrary, Strohmayer (1999) and Miller (2000) have shown that piecewise-linear frequency drift models — with occasional sudden jumps in — describe the frequency evolution in several bursts from 4U 163653 quite well. Nevertheless we have found polynomial models adequate for all of the KS 1731260 bursts. A detailed description of our phase models is presented in Table 4.
In order to determine the approximate one-sigma ranges shown in the plots of Figure 5, we have set each parameter of the fit (in turn) to its one-sigma limit as shown in the Table, minimized with respect to the remaining parameters, and calculated the frequency evolution throughout the pulsation interval, as derived from the fit. The full range in frequency sampled by each point in time, in the course of sampling the different fits, was saved and determined the confidence regions that we have plotted. Although this procedure falls short of the full exploration of space that would be required for exact limits, we feel that it captures the essence of the flexibility allowed with respect to the best-fit model. The flaws with our approximate method are most apparent in the plot for Burst 2, Figure 5(b), where the uncertainty in the frequency at intermediate times during the evolution is certainly greater than shown.
Inspired by the form of the frequency evolution shown in the dynamic PDS of Bursts 1 and 9 (Fig. 5), and by the work of Strohmayer & Markwardt (1999), we have also fit exponential-relaxation phase models to the data from these two bursts. Note that the final polynomial phase models for these bursts have four terms each (quadratic frequency evolution) so that we could pursue exponential models without sacrificing any degrees of freedom. We have found that the exponential-relaxation models, , provide fits as good as the polynomial models in both cases, with chi-squared values of 10.8 for 8 degrees of freedom (Burst 1) and 13.2 for 11 degrees of freedom (Burst 9), respectively. Full details of the exponential-relaxation fits are shown in Table 5.
The best fit values for the asymptotic frequencies of the burst pulsations are 524.61 and 524.48 Hz for Bursts 1 and 9 respectively. The coincidence of these two values (which are consistent at the 1.5 level) is remarkable, with the difference being equivalent to an orbital Doppler shift () of only 75 km s-1. This near-equality of asymptotic frequencies found using an exponential frequency evolution model has been observed in 4U 172834, 4U 163653, and 4U 1702429 as well (Strohmayer et al., 1998b; Strohmayer & Markwardt, 1999), which suggests that the model is physically meaningful.
Proceeding to a joint investigation of the two physically meaningful parameters of the exponential model, and , we present in Figure 6 the two-dimensional confidence region for and , as constrained by our exponential-relaxation model fits for Bursts 1 and 9. Note that values of the two other parameters, and (the phase of the pulsations at ), are sensitive to the exact start time of our phase model and hence depend on our instrument sensitivity.
Examination of Figure 6 reveals, first of all, that the fit parameters for Bursts 1 and 9 are consistent at better than 1, as the 1 confidence regions for the two bursts overlap near Hz, s.
Second, the figure shows that a - degeneracy weakens our constraints at large (, ). The sense of this degeneracy is that increasing both and moves the final approach to a constant frequency out to later times, and so will be allowed to the extent that the frequency is still increasing when the oscillations disappear. Since the pulsations in Burst 1 are weaker than those in Burst 9, especially at late times, the problem is more acute for this burst. Nevertheless, in examining the plot we may draw some conclusions. First, if the values for the two bursts are in fact equal (or nearly equal), then the values for the bursts must also be nearly equal, within 10%. Alternatively, if the values for the two bursts are in fact different, whether because of an intrinsic change in the pulse frequency or because of orbital Doppler effects, then the values for the bursts are also likely to be different.
2.6 Application of phase models
The phase models in Table 4 demonstrate full coherence of the burst pulsations from KS 1731260 over the duration of the intervals we model. The longest of these intervals are: for Burst 1, 9.75 s or 5111 cycles; for Burst 2, 8 s or 4194 cycles; and for Burst 9, 9.0 s or 4718 cycles. With successful phase models for the burst pulsations we may address a number of issues.
First, we can make sensitive tests for the presence of harmonics and sub-harmonics of the burst pulsations. We searched first for significant modulation at twice the main burst frequency. By multiplying the phases derived from our phase model by two, and integrating through the burst pulsation intervals indicated in Table 4, we have found evidence at the 2.1 level for a modulation at the first harmonic of the 524 Hz pulsations. The average power of this modulation, over all the intervals we have modeled, is 1.9% that of the main signal. We then searched for and found no evidence for modulation at the second and third harmonics of the main signal; 2 upper limits are 2.3% and 1.7% the power of the main signal, respectively.
We then searched for a sub-harmonic of the main signal by multiplying our derived phases by 0.5; as Miller (1999) points out, we must also account for the possibility of half-phase offsets at the points of connection between different burst intervals. Since the signals from Bursts 1 and 9 are significantly stronger than the signals in the other bursts, it is possible that the increased number of trials required to connect all of the intervals could offset the increased sensitivity provided by coherent phase connection of those intervals. Therefore we have performed this search in two stages. In the first stage, we tested for a sub-harmonic in the coherent connection of Bursts 1 and 9 only (two trials): we did not detect significant (95%-confidence) modulation in either connection, and can place a 2 upper limit on the strength of a sub-harmonic in these bursts, relative to the main signal, of 5.5%. Note that the sub-harmonic detected by Miller (1999) in the burst-rise pulsations from 4U 163653 was on average 19% the power of the main signal.
In the second stage of the sub-harmonic search we connected all six of the burst pulsation intervals together, accounting for all possible combinations of half-phase offsets (32 trials): we did not detect significant modulation in any connection, and place a two-sigma upper limit on the average power of a sub-harmonic across all these intervals of 3.9% that of the main signal. At the same time we tested for the presence of modulation at 1.5 times the main burst frequency, and can place a two-sigma upper limit on the average power at that frequency of 4.4% that of the main signal.
The last two points of the phase model for Burst 2 may be used to derive a “peak frequency” for the pulsations in this burst of 525.080.18 Hz. Although this frequency is not as well constrained as the asymptotic frequencies of Bursts 1 and 9, it is higher than the Burst 9 at a 3.2 level of confidence, and requires a relative Doppler shift of 340100 km s-1 to explain, if the we measure in fact corresponds to the spin frequency of the neutron star – since the burning layer may expand to produce lower frequencies, but cannot “contract” to produce higher ones.
For the rest of our analysis we concentrate on the pulsations from Bursts 1 and 9, which have the highest signal-to-noise. We have folded data with s time resolution in five energy channels (starting at 3, 5, 7, 10, and 13 keV) from Bursts 1 and 9 about the polynomial phase models. Fitting a sinusoid to the folded profile in each of five energy bands, we measure the strength of the oscillation and the phase offset in each band. The reduced chi-squared values for the sinusoidal fits were less than 1.3 for all energy bands. We have found that the RMS amplitude of the burst oscillation increases monotonically with energy for both bursts; the sense of this increase is shown in Figure 7.
The measured phase of the oscillations in different energy bands provides marginal evidence for a soft phase lag in the 7–9 keV and 10–13 keV bands relative to the 3–5 keV band in Burst 1 (1.50.3 and 1.20.33 radians, respectively), and none in Burst 9. Computing the Fourier phase lag for a signal at 524 Hz (with 1 Hz frequency resolution) without adjusting for the polynomial phase model, we have found a marginally significant hard lag of 0.40.2 radians between the 5–7 keV and 7–25 keV bands in Burst 9, and none in Burst 1. Given these ambiguous detections, we do not feel our measurements are significant evidence of a phase lag in the pulsed signal.
Finally, we have been able to accurately characterize the evolution of the strength of the pulsations over the course of the bursts (Fig. 8). Without an accurate phase model, the strength of the pulsations would otherwise be very difficult to measure when they first appear and their frequency is changing the fastest. It appears that the strength of the burst pulsations (relative to the burst flux) in Burst 1 are consistent with a 7% RMS modulation for most of the burst, rising to a maximum of 10% before disappearing at the end; in Burst 9, the data show a significant increase at the start of the pulsations, and are then consistent with a more or less constant 8% RMS modulation for the duration of the pulsations. In both bursts, the pulsations are initially detected at a lower level of 3% RMS.
We have calculated the strength of the oscillations in the other bursts where they are detected, although we do not present the results as figures: the pulsations in Burst 2 increase from % RMS to % RMS over the course of the interval when pulsations are detected; those in Burst 7 are consistent with % RMS throughout the 0.75 s of detected pulsations; those in Burst 8 have % RMS at start, decreasing to % before disappearing.
Figure 8 also shows our phase model fits and residuals for Bursts 1 and 9, presented in the form of a “phase loss” plot — with the running phase compared to that for a constant-frequency pulsation at the fitted asymptotic frequency . According to our models, the burst pulsations lose 3.9 cycles compared to the constant in Burst 1, and 2.8 cycles compared to the (different) constant in Burst 9. Note that due to the - degeneracy in the fits, these values are not well constrained from above (especially for Burst 1): our two-sigma upper limits on the total phase loss are 19.4 and 4.3 cycles for Bursts 1 and 9, respectively.
3 Discussion
Our results allow us to address a number of important aspects of the phenomenology of type I X-ray bursts and their burst pulsations.
3.1 Two populations of type I X-ray bursts
The nine bursts that we have observed from KS 1731260 divide into two populations, as shown in Table 2 and Figure 1. When the source is in the Island State and the persistent flux is low, bursts have relatively broad maxima (as measured by the time until the start of the burst decay), long decay time scales (), large fluences, and no evidence for radius expansion (Bursts 3, 4, 5, and 6); following Gottwald et al. (1986) we call these slow bursts. When the source is on the Banana Branch and the persistent flux is high, the peaks of bursts are sharper, the bursts are shorter, radius expansion episodes are present, and burst fluences are smaller (Bursts 1, 2, 8 and 9); we call these fast bursts. Burst 7 is particularly weak, but still exhibits the short decay, narrow maximum, and small characteristic of fast bursts. When we compare the ratio of the energy released in the persistent luminosity to that in type I X-ray bursts, , we find yet another distinction: the slow bursts which occur in the Island State correspond to an , while the fast bursts which occur on the Banana Branch correspond to higher .
The decrease in burst duration with increasing accretion rate is consistent with the global relationship which Van Paradijs, Pennix, & Lewin (1988) reported for their sample of 10 LMXBs. Note however that they found burst properties to span a continuum between the slow and fast populations in a sample of many burst sources, and that KS 1731260 itself may display a continuum of bursting properties should the source be observed for a longer period of time at an intermediate value of the accretion rate as inferred from the color-color diagram (Figure 1). The work of Hanawa, Fujimoto, & Miyaji (1981) (see also Van Paradijs, Pennix, & Lewin (1988), Gottwald et al. (1986)) suggests that the fast bursts (and values of ) result from the burning of helium-rich material. The association between fast bursts and radius expansion has previously been noted by several authors (see, e.g., Gottwald et al. (1986) for EXO 0748676 and Lewin et al. (1987) for 4U 163653), and indicates that the nuclear energy of these bursts is released so rapidly that the Eddington luminosity is exceeded, causing substantial expansion of the neutron star’s photosphere.
Hanawa, Fujimoto, & Miyaji (1981) predict that helium-rich bursts should occur when the local accretion rate in the area responsible for the burst is low (Case 2 of Section 1, above). Although this may seem to be contradicted by our finding that fast bursts occur at relatively high accretion rates, the paradox can be resolved if accretion takes place over a larger fraction of the neutron star when the total accretion rate is high, such that the accretion rate per unit area is reduced (Bildsten 2000). Evidence for this hypothesis may be found in spectral fits to the burst emission. Gottwald et al. (1986) noted that the fitted blackbody radii during the tails of fast bursts from EXO 0748676 were systematically larger than the radii for the slow bursts and Bildsten (2000) showed that this is adequate to change the local accretion rate. Similarly, we find that the apparent radii in the tails of fast bursts from KS 1731260 are systematically larger than those of slow bursts (Figure 4); this behavior can be seen in the spectral evolution of Bursts 3 and 9 in Figure 3. If this difference in apparent blackbody radii reflects a physical increase in the area of the burst emission, that might explain why the properties of bursts observed at high total accretion rates are those expected for bursts occurring at a low local accretion rate.
The behavior of Burst 7 runs somewhat counter to this trend: although this burst has significantly less fluence than the other fast bursts, it exhibits a larger increase in blackbody radius during the tail of the burst. If a burst only ignites when sufficient material per unit area is accreted to produce the critical density and temperature, then larger burst areas should correspond reliably to larger burst fluences. On the other hand, if a burst occurred during the Earth occultation 25–75 minutes prior to Burst 7, then the observed burst would be similar to other weak bursts with short waiting times and relatively large apparent radii from 4U 170544 (Langmeier et al., 1987) and EXO 0748676 (Gottwald et al., 1986). These weak bursts may be triggered by unburnt nuclear fuel from the previous burst (Lewin et al., 1987; Fujimoto et al., 1987).
It is also possible that there is a systematic difference in the neutron star atmosphere or the accretion flow which causes the spectrum of bursts on the Banana Branch to systematically deviate from a blackbody due to electron scattering. London, Taam & Howard (1984, 1986) demonstrated that at luminosities close to the Eddington value, the ratio of the apparent temperature derived from a blackbody fit to the effective temperature of the emission region increases as increases. Since , and for a constant physical emission area , we have . Thus, as the burst cools, and decrease together, and will appear to increase (see also Sztajno et al. (1985)). If the anti-correlation between and in Figure 4 is indeed due to electron scattering, then the trend is not a probe of accretion onto the neutron star surface, but indicates that the atmosphere or immediate environment of the neutron star is fundamentally different in the Banana and Island states. However, the results of London et al. were originally considered important in explaining apparent super-Eddington temperatures in the peaks of radius-expansion bursts, and it is not clear whether the theory applies to the cooling tails of bursts, when the temperature is nearly a factor of two smaller. London, Taam, & Howard (1984, 1986) find that the opposite correlation between and holds at low .
3.2 Fast bursts show burst pulsations
It has previously been observed that coherent oscillations are not present in every burst from 4U 172834 and 4U 170243 (Markwardt, Strohmayer, & Swank, 1999), although no systematic study has been previously carried out to determine whether the properties of the bursts or persistent emission from those sources are correlated with the presence of detectable coherent oscillations. We find that in KS 1731260 this differentiation is strictly consistent with the two burst populations we identify: all of the fast bursts exhibit near-coherent oscillations and none of the slow bursts do (to limits of 10% RMS in any single second; see Table 2). However, it is worth differentiating the oscillations found in the rise of the bursts from those occurring in the burst tails, as it is more difficult to understand how the latter form. Only two instances of coherent oscillations in the burst rise are observed, so the question remains as to why some of the fast bursts exhibit burst-rise pulsations and others do not. Oscillations in the rise of bursts are not tied to radius expansion episodes, as the oscillations are observed in Burst 7 from KS 1731260 and in several bursts without radius expansion in 4U 172834 (Strohmayer, Zhang, & Swank, 1997). On the other hand, all of the oscillations which are observed in the tails of the bursts appear immediately after the contraction phase of a radius expansion episode (as first noted by (Smith, Morgan, & Bradt, 1997); no counter-example of coherent oscillations in the tail of a burst without radius expansion has been reported among the other sources to our knowledge). This suggests that the radius expansion episode leaves behind an anisotropy in the neutron star photosphere that resembles a rotating hot spot. In any case, the general association between fast bursts and coherent oscillations suggests that the process which produces the oscillations is related to the particularly intense helium-rich burning in these bursts.
3.3 Burst pulsations and the spin frequency
Our analysis of the burst pulsations raises some intriguing questions about the spin-frequency interpretation of the burst pulsations in KS 1731260. The best-fit values of the asymptotic burst pulse frequency for Bursts 1 and 9 are 524.61 and 524.48 Hz respectively, are consistent at the 1.5 level. The 0.13 Hz frequency difference could be produced by an orbital Doppler shift () of only 75 km s-1, well within the range of typical LMXB orbital parameters. However, the highest frequency of the oscillations in Burst 2 is greater than the Burst 9 at a 3.2 level of confidence, and requires a relative Doppler shift of 340100 km s-1 if the we measure in Bursts 1 and 9 in fact reflects the spin frequency of the neutron star. A 300 km s-1 Doppler shift is not inconceivable for an LMXB, but (assuming an inclination of as suggested by the lack of eclipses or dips, and a 1.4 neutron star with a 1 companion) would suggest a 1 h orbit for the most probable viewing geometry of the bursts— placing KS 1731260 in the shortest 10% of the LMXB orbital period distribution (White, Nagase, & Parmar, 1995). Unfortunately no optical companion to KS 1731260 has been found to date (Barret, Motch, & Predehl, 1998), and no orbital period is known for the binary. More information about the system, or a greatly expanded sample of bursts, will be necessary before the binary parameters can be constrained.
The fractional change of the oscillation frequency during Bursts 1, 2, and 9 (Figure 5) is within a factor of a few of the changes observed in 4U 172834 4U 170243, and Aql X-1(Strohmayer & Markwardt, 1999), (Zhang et al., 1998). Under the assumptions of the hot spot model, the fractional change in the frequency is directly proportional to the change in the radius at which the hot spot is observed. When angular momentum is conserved, , which for small and gives . For KS 1731260 a 1 Hz frequency drift corresponds to a of , or about 20 m for a neutron star with a 10 km radius.
Comparing the various time and length scales which we can infer for the bursts provides some insight into the origin of the oscillations. The change in the radius of the hot spot during the tails of the bursts ( m) is thought to just arise from the hydrostatic expansion of the nuclear burning layer (Strohmayer, Zhang, & Swank, 1997). However, the time for the nuclear energy released at the burning layer to diffuse through the neutron star atmosphere to the photosphere during a burst can also be as large as several seconds (Hanawa & Fujimoto, 1984). If the hot spot is moving with respect to the surface of the neutron star (and the atmosphere) more quickly than the signal from the hot spot can escape the atmosphere, the signal will be unobservable.
Cumming & Bildsten (2000) have shown that the smaller opacity of a helium rich shell reduces the thermal diffusion time through a helium rich atmosphere. In addition, they found that the time for the hot spot to drift relative to the surface of the neutron star (estimated from the inverse of the predicted frequency change) increases when more helium is present, because the higher mean molecular weight of helium prevents the burning layer from expanding as far. The combination of the two effects implies that, independent of the cause of the hotspot, the signal is more likely to be observed during a pure helium burst.
In Burst 8 we observe an episode of spin-down during the burst peak that is roughly comparable in duration and magnitude to the spin-down episode observed during Strohmayer (1999) Burst A from 4U 163653 (also discussed in Miller (2000)); see Figure 5(d). In this case, however, the spin-down is not accompanied by any evidence for late-time radius expansion, as was observed for Strohmayer’s Burst A; on the contrary, the entire spin-down episode occurs after the photospheric radius has contracted and settled to its minimum value of 8 km. This observation presents a challenge to the spin-frequency interpretation. Explaining the spin-down during Burst 8 under this model seems to require postulating a relatively consistent 7 m s-1 expansion of the burning layer over the 3 s interval of the pulsations, without any corresponding spectral evidence for this expansion. Naturally, a small expansion like this would not be seen directly in the blackbody radius of the spectral fits. However, some additional input of energy, relative to the more typical spin-up seen in Bursts 1, 2, and 9, is presumably required to power this expansion, and we see no evidence of this.
The amplitude of the burst oscillations we observe increases with photon energy (Figure 7) in a manner consistent with general-relativistic models of hot spots on the surface of a rotating neutron star (Miller & Lamb, 1998). These models allow larger oscillation amplitudes (20–80% for two hot spots, as the photon energy increases from 0–20 keV) than we observe, but this can be accounted for by allowing the hot spots on KS 1731260 to have a finite area on the neutron star surface, which will dampen the modulation (the intent of Miller & Lamb 1998 was to calculate upper limits on the pulse amplitudes, so point-source hot spots were assumed).
Phase connection of the pulsations in the bursts from KS 1731260 allows us to make sensitive tests for the presence of harmonics and sub-harmonics of the main signal. We find marginal evidence (2.1 level) for modulation at the first harmonic of the main 524 Hz signal with an average power 1.9% that of the main signal, and no evidence (95% confidence) for modulation at frequencies of 1/2 or 3/2 the frequency of the main signal; our 2 upper limits for the power of these components are 5.5% and 4.4% the power of the main signal, respectively. The sub-harmonic modulation in 4U 163653 found during oscillations in the burst rise has an average strength 19% that of the main signal (Miller, 1999), and is compelling evidence that the spin frequency of that neutron star is in fact half of the strongest burst frequency. This would be expected in beat frequency models, since . The strongest observed oscillations in KS 1731260 are in the burst tail, so it is possible that the small upper limit on the sub-harmonic content observed from this source (by a factor of 3) reflects greater symmetry in the hot spots present in the burst tail. However, the evidence we find for modulation at the first harmonic of 524 Hz suggests that it is more likely that Hz in KS 1731260, since 2% harmonic content might easily be produced by a pulse which deviates slightly from a sinusoidal profile. Should observations of further bursts from KS 1731260 strengthen the evidence for a harmonic, the case for in this source will be strengthened, and the beat frequency interpretation cast into doubt.
4 Conclusions
We have observed nine type I X-ray bursts from KS 1731260 with the RXTE PCA. We find that the bursts can be separated into two categories (Section 2.2, 2.3): fast bursts occur on the Banana Branch when the accretion rate is high, and generally exhibit short decay time scales, high peak flux, radius expansion episodes, and coherent oscillations. Slow bursts occur in the Island State at lower accretion rates, and have lower peak fluxes, higher fluences, and longer decay time scales, but exhibit no evidence of either radius expansion or coherent oscillations. The fast and slow bursts may occur when the nuclear fuel is rich in helium and hydrogen respectively (Sections 1.1 and 3.1).
We have analyzed the frequency evolution of the pulsations during the bursts by applying the technique of pulsar phase connection, which allows us to “count pulses” and thereby characterize the evolution uniquely (Section 2.5). We find that the frequency evolution during the peak and decay of the bursts exhibits a variety of behaviors, including a sharp spin-down in one burst (Burst 8) which challenges the attribution of the frequency evolution during bursts to expansion or contraction of an expanded burning layer. The frequency evolution during Bursts 1 and 9, separated by 2.6 years, extends for over 9 s in both cases and is consistent with nearly the same exponential-relaxation model, with a best-fit frequency difference of 0.130.09 Hz. The evolution of the oscillations in Burst 2 is more complicated, and the maximum frequency of the oscillation is greater than those modeled with exponentials by 0.60.2 Hz.
Phase connection of the burst pulsations allows us to make several precision tests of their properties (Section 2.6). We demonstrate the coherence of these pulsations (after accounting for their gross frequency evolution) for 5000 cycles. We find that the pulsations are spectrally hard in comparison to the burst emission, with the strength of the pulsations increasing monotonically with photon energy. Coherently summing the signals from all the bursts with detected pulsations, we find marginal (2.1) evidence for modulation at the first harmonic of the main pulse frequency at 524 Hz, with an average power equivalent to 1.9% that of the main signal. In combination with our upper limits on modulation at 1/2 or 3/2 the main pulse frequency (5.5% and 4.3% the power of the main signal, respectively), this suggests that the spin frequency in KS 1731260 is more likely to be 524 Hz than half that, as the measured frequency difference of the kHz QPOs ( Hz) might otherwise suggest.
References
- Ayasli & Joss (1982) Ayasli, S. & Joss, P. C. 1982, ApJ, 256, 637
- Barret et al. (1992) Barret, D. et al. 1992, ApJ, 394, 615
- Barret, Motch, & Predehl (1998) Barret, D., Motch, C., & Predehl, P. 1998, A&A, 329, 965
- Barret et al. (1999) Barret, D., Olvie, J. F., Boirin, L., Done, C., Skinner, G. K., & Grindlay, J. E. 1999, astro-ph/9911042
- Basinska et al. (1984) Basinska, E. M., Lewin, W. H. G., Sztajno, M., Cominsky, L. R., & Marshall, F. J. 1984, ApJ, 281, 337
- Bildsten (1995) Bildsten, L. 1995, ApJ, 438, 852
- Bildsten (1997) Bildsten, L. 1997, The Many Faces of Neutron Stars, R. Buccheri, J. Van Paradijs & M.A. Alpar (Eds), NATO ASI Series C, Vol. 515, pp. 337-368 (Kluwer Academic Publishers), astro-ph/9709094
- Bildsten (2000) Bildsten, L. 2000, to appear in “Cosmic Explosion” eds. S. S. Holt and W. W. Zhang (AIP: New York), astro-ph/0001135
- Bradt, Rothschild, & Swank (1993) Bradt, H. V. D., Rothschild, R. E., & Swank, J. H. 1993, A&AS, 97, 355
- Chakrabarty (1996) Chakrabarty, D. 1996, Ph.D. thesis, California Institute of Technology
- Clark et al. (1977) Clark, G. W., Li, F. K., Canizares, C., Hayakawa, S., Jernigan, G., & Lewin, W. H. G. 1977, MNRAS, 179, 651
- Cocchi et al. (1998) Cocchi, M., in’t Zand, J. J. M., Bazzano, A., Heise, J., Muller, J., Natalucci, L., & Ubertini, P. 1998, Nuclear Physics B (Proc. Suppl.), 69/1-3, 232
- Cumming & Bildsten (2000) Cumming, A. & Bildsten, L. 2000, submitted to ApJ
- Deeter, Pravdo & Boynton (1981) Deeter, J. E., Pravdo, S. H., Boynton, P. E. 1981, ApJ, 247, 1003
- Ford (1999) Ford, E. C. 1999, ApJ, 519, L73
- Fujimoto, Hanawa, & Miyaji (1981) Fujimoto, M. Y., Hanawa, T., & Miyaji, S. 1981, ApJ, 246, 267
- Fujimoto et al. (1987) Fujimoto, M. Y., Sztajno, M., Lewin, W. H. G., & Van Paradijs, J. 1987, ApJ, 319, 902
- Fushiki & Lamb (1987) Fushiki, I. & Lamb, D. Q. 1987, ApJ, 323, L55
- Groth (1975) Groth, E. J. 1975, ApJS, 29, 285
- Gottwald et al. (1986) Gottwald, M., Haberl, F., Parmar, A. N., & White, N. E. 1986, ApJ, 308, 213
- Hanawa & Fujimoto (1982) Hanawa, T., & Fujimoto, M. Y. 1982, PASJ, 34, 495
- Hanawa & Fujimoto (1984) Hanawa, T., & Fujimoto, M. Y. 1984, PASJ, 36, 199
- Jahoda et al. (1996) Jahoda, K., Swank, J. H., Giles, A. B., Stark, M. J., Strohmayer, T., Zhang, W., & Morgan, E. H. 1996, SPIE, 2808, 59
- Kaspi, Chakrabarty & Steinberger (1999) Kaspi, V. M., Chakrabarty, D., & Steinberger, J., 1999, ApJ, 525, 33
- Langmeier et al. (1987) Langmeier, A., Sztajno, M., Hasinger, G., Trümper, J., & Gottwald, M. 1987, ApJ, 323, 288
- Leahy et al. (1983) Leahy, D. A., Darbro, W., Elsner, R. F., Weisskopf, M. C., Sutherland, P. G., Kahn, S., & Grindlay, J. E. 1983, ApJ, 266, 160
- Lewin et al. (1980) Lewin, W. H. G., Van Paradijs, J., Cominsky, L., & Holzner, S. 1980, MNRAS, 193, 15
- Lewin, Van Paradijs & Taam (1993) Lewin, W. H. G., Van Paradijs, J., & Taam, R. E. 1993, Space Science Review, 62, 223
- Lewin et al. (1987) Lewin, W. H. G., Pennix, W. Van Paradijs, J., Damen, E., Sztajno, M., Trümper, J., & Van der Klis, M. 1987, ApJ, 319, 893
- London, Taam, & Howard (1984) London, R. A., Taam, R. E., & Howard, W. M. 1984, ApJ, 287, L27
- London, Taam, & Howard (1986) London, R. A., Taam, R. E., & Howard, W. M. 1986, ApJ, 306, 170
- Kuulkers & Van der Klis (1995) Kuulkers, E., & Van der Klis, M., 1995, ApJ, 450, 748
- Makishima et al. (1983) Makishima et al. 1983 ApJ, 267, 310
- Manchester & Taylor (1977) Manchester, R. N., & Taylor, J. H. 1977, Pulsars (San Fracisco: W. H. Freeman and Co.)
- Markwardt, Strohmayer, & Swank (1999) Markwardt, C. B., Strohmayer, T. E., & Swank, J. H. 1999, ApJ, 512, L125
- Méndez & Van der Klis (1999) Méndez, M. & Van der Klis, M. 1999, ApJ, 517, L51
- Méndez, Van der Klis, & Van Paradijs (1998) Méndez, M., Van der Klis, M., & Van Paradijs, J. 1998, ApJ, 506, L117
- Méndez et al. (1998) Méndez, M., Van der Klis, M., Wijndands, R., Ford, E. C., Van Paradijs, J., & Vaughan, B. A. 1998, ApJ, 505, L23
- Middleditch (1975) Middleditch, J. 1975, Ph.D. thesis, University of California, Berkeley, LBL Report No. 3639
- Miller (1999) Miller, M. C. 1999, ApJ, 515, L77
- Miller (2000) Miller, M. C. 2000, ApJ, submitted (astro-ph 9904093)
- Miller & Lamb (1998) Miller, M. C. & Lamb, F. K. 1998, ApJ, 499, L37
- Miller, Lamb, & Psaltis (1998) Miller, M. C., Lamb, F. K., & Psaltis, D. 1998, ApJ, 508, 791
- Murakami et al. (1980) Murakami et al. 1980, ApJ, 240, L143
- Osherovich & Titarchuk (1999) Osherovich, V. & Titarchuk, L. 1999 ApJ, 522, L113
- Predehl & Schmitt (1995) Predehl, P. & Schmitt, J. H. M. M. 1995, A&A, 293, 889
- Press et al. (1992) Press, W. H., Teukolsky, S. A., Vetterling, W. T. & Flannery, B. P. 1992, Numerical Recipes in C, 2nd Ed. (Cambridge: Cambridge University Press)
- Psaltis et al. (1998) Psaltis, D. et al. 1998, ApJ, 501, L95
- Smith, Morgan, & Bradt (1997) Smith, D. A., Morgan, E. H., & Bradt, H. 1997, ApJ, 479, L137
- Stella & Vietri (1999) Stella, L., & Vietri, M., 1999, Phys Rev Lett, 82, 17
- Strohmayer (1999) Strohmayer, T. E. 1999, ApJ, 523, L51
- Strohmayer & Markwardt (1999) Strohmayer, T. E. & Markwardt, C. B. 1999, ApJ, 516, L81
- Strohmayer, Swank, & Zhang (1998a) Strohmayer, T. E., Swank, J. H., & Zhang, W. 1998, Nuclear Physics B (Proc. Suppl.), 69/1-3, 129
- Strohmayer, Zhang, & Swank (1997) Strohmayer, T. E., Zhang, W., & Swank, J. H. 1997, ApJ, 487, L77
- Strohmayer et al. (1998b) Strohmayer, T. E., Zhang, W., Swank, J. H., White, N. E., & Lapidus, I. 1998, ApJ, 498, L135
- Strohmayer et al. (1996) Strohmayer, T. E., Zhang, W., Swank, J. H., Smale, A., Titarchuk, L., & Day, C. 1996 ApJ, 469, L9
- Strohmayer et al. (1998c) Strohmayer, T. E., Zhang, W., Swank, J. H. & Lapidus, I. 1998, ApJ, 503, L147
- Sunyaev (1989) Sunyaev, R. 1989, IAU Circ., 4839
- Sunyaev et al. (1990) Sunyaev, R. et al. 1990, Pis’ma Astron. Zh., 16, 136
- Sztajno et al. (1983) Sztajno, M., Bashinka, E. M., Cominsky, L. R., Marshall, F. J., & Lewin, W. H. G. 1983, ApJ, 267, 713
- Sztajno et al. (1985) Sztajno, M., Van Paradijs, J., Lewin, W. H. G., Trümper, J., Stollman, G., Pietsch, W., & Van der Klis, M. 1985, ApJ, 299, 487
- Sztajno et al. (1986) Sztajno, M., Van Paradijs, J., Lewin, W. H. G., Langmeier, A., Trümper, J., & Pietsch, W. 1986, MNRAS, 222, 499
- Van der Klis et al. (1990) Van der Klis, M., Hasinger, G., Damen, E., Pennix, W., Paradijs, J., & Lewin, W. H. G. 1990, ApJ, 360, L19
- Van der Klis (1995) Van der Klis, M. 1995, in X-ray Binaries, p. 252, Lewin, W. H. G., Van Paradijs, J., & Van den Heuvel, E. P. J. (Eds), Cambridge University Press
- Van der Klis (1997) Van der Klis, M. 1997 in The Many Faces of Neutron Stars, R. Buccheri, J. Van Paradijs & M.A. Alpar (Eds), NATO ASI Series C, Vol. 515, pp. 337-368 (Kluwer Academic Publishers), astro-ph/9710016 in The Proceedings of the Third William Fairbank Meeting, Rome, astro-ph/9812395
- Van der Klis (2000) Van der Klis, M. 2000, to appear in the Annual Review of Astronomy and Astrophysics, astro-ph/0001167
- Van der Klis et al. (1997) Van der Klis, M., Wijnands, R. A. D., Horne, K., Chen, W. 1997 ApJ, 481, L97
- Van Paradijs, Pennix, & Lewin (1988) Van Paradijs, J., Pennix, W., & Lewin, W. H. G. 1988, MNRAS, 233, 437
- Van Paradijs et al. (1988) Van Paradijs, J., Pennix, W., Lewin, W. H. G., Sztajno, M., & Trümper, J. 1988, A&A, 192, 147
- Vaughan et al. (1994) Vaughan, B. A. et al. 1994, ApJ, 435, 362
- White, Nagase, & Parmar (1995) White, N. E., Nagase, F., & Parmar, A. N. 1995, X-ray Binaries, p. 1, Lewin, W. H. G., Van Paradijs, J., & Van den Heuvel, E. P. J. (Eds), Cambridge University Press
- Wijnands & Van der Klis (1997) Wijnands, R. A. D. & Van der Klis, M. 1997, ApJ, 482, L65
- Zhang et al. (1998) Zhang, W., Jahoda, K., Kelley, R. L., Strohmayer, T. E., Swank, J. H., & Zhang, S. N. 1998, ApJ, 495, L9
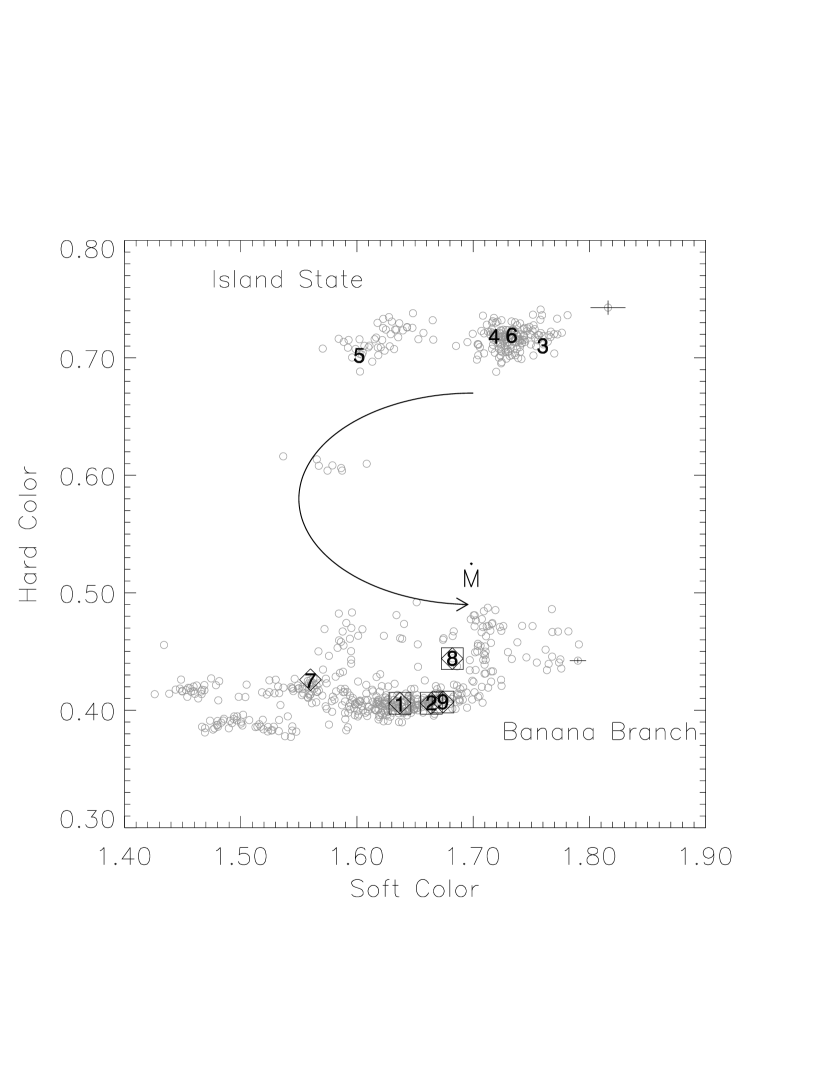


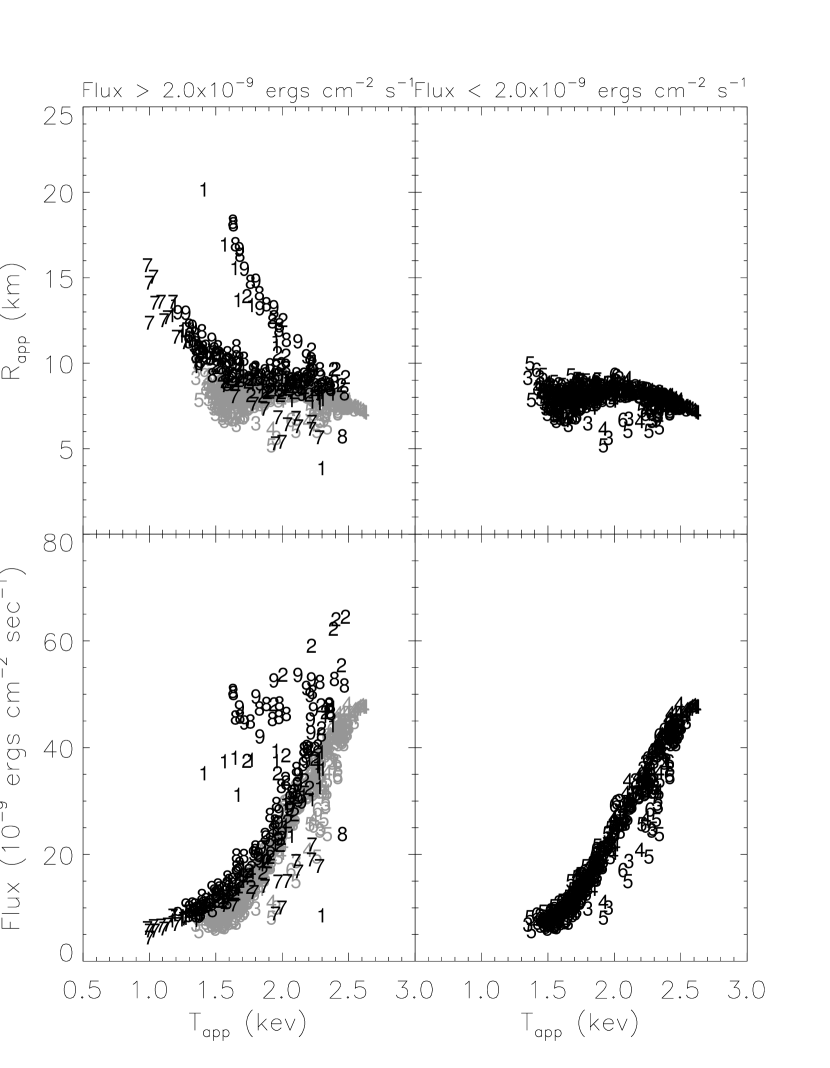
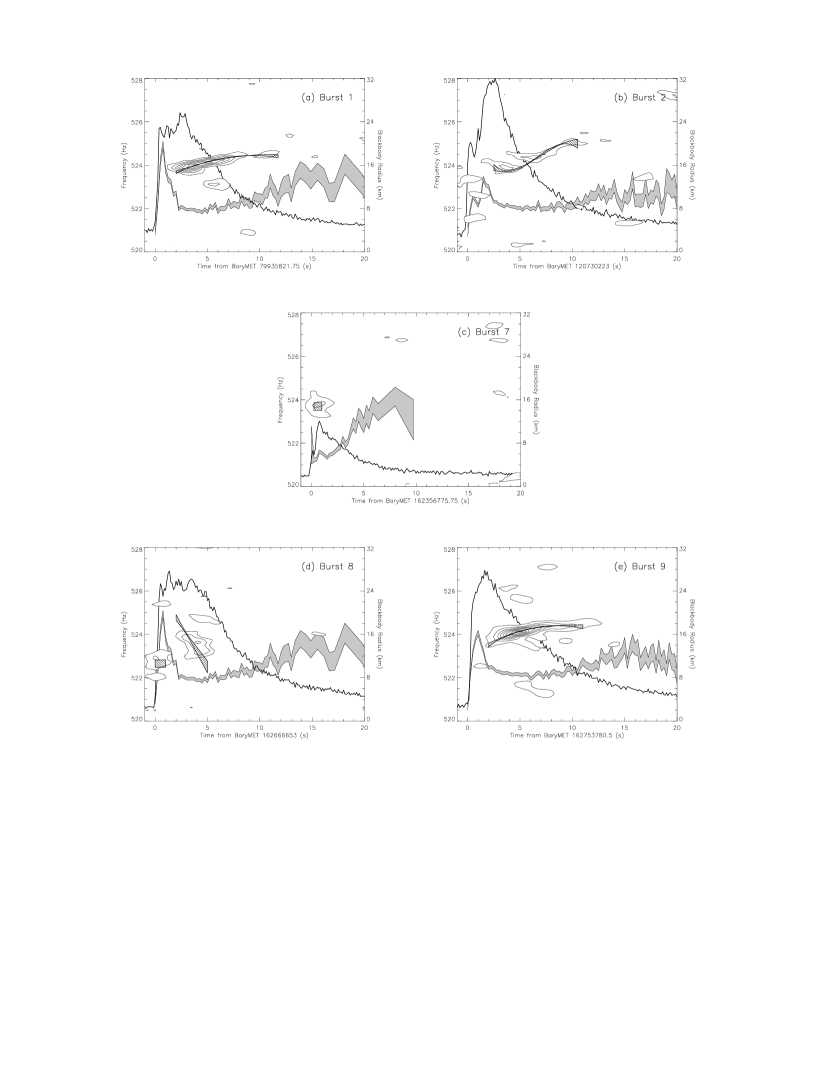
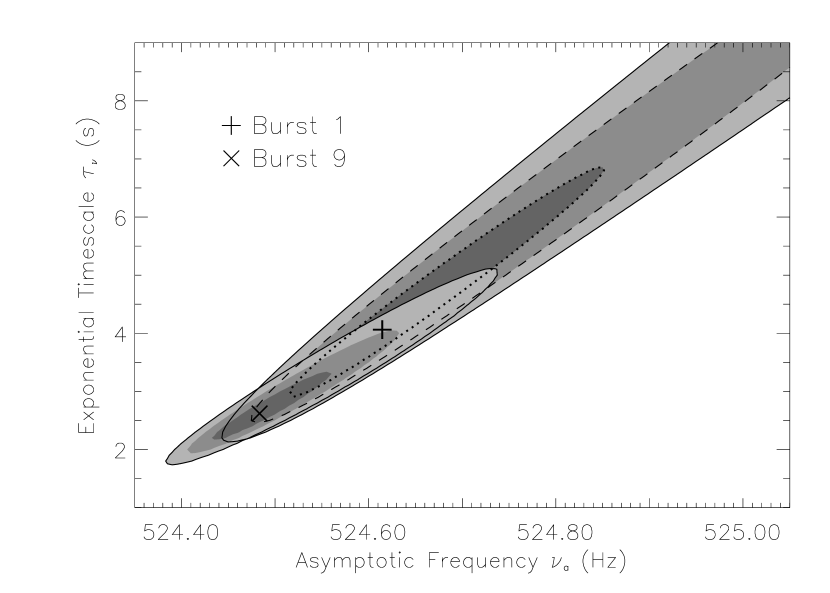


| Observation ID | Date | Start | End | Exposure | Count | Flux | Soft | Hard |
|---|---|---|---|---|---|---|---|---|
| UT | Time | Time | Time (s) | RateaaCounts per second per PCU | ()bberg cm-2 s-1between 2–18 keV. Uncertainty is approximately erg cm-2 s-1for all entries. | Color | Color | |
| 10416-01-01-00 | 1996 Jul 14 | 02:32:31 | 07:05:31 | 9960 | 552 | 6.38 | 1.63 | 0.40 |
| 10416-01-02-00 | 1996 Aug 01 | 16:53:56 | 20:51:56 | 9900 | 344 | 2.74 | 1.50 | 0.39 |
| 10416-01-03-00 | 1996 Aug 31 | 17:40:17 | 19:44:16 | 3540 | 405 | 4.73 | 1.54 | 0.38 |
| 20085-01-01-01 | 1997 Oct 28 | 22:12:38 | 03:41:39 | 13080 | 404 | 4.69 | 1.62 | 0.40 |
| 20085-01-01-02 | 1997 Oct 29 | 06:22:45 | 08:28:45 | 4320 | 467 | 5.37 | 1.65 | 0.41 |
| 20085-01-01-03 | 1997 Oct 29 | 18:00:34 | 20:00:33 | 4320 | 489 | 5.63 | 1.62 | 0.43 |
| 20085-01-01-00 | 1997 Oct 29 | 21:07:33 | 11:39:33 | 28260 | 505 | 5.85 | 1.71 | 0.46 |
| 30061-01-01-00 | 1998 Jul 31 | 11:26:08 | 15:17:07 | 9000 | 377 | 4.36 | 1.65 | 0.40 |
| 30061-01-01-01 | 1998 Aug 01 | 01:49:06 | 04:09:07 | 6480 | 381 | 4.42 | 1.53 | 0.42 |
| 30061-01-01-02 | 1998 Aug 01 | 06:47:02 | 17:18:02 | 22980 | 369 | 4.28 | 1.63 | 0.41 |
| 30061-01-01-03 | 1998 Aug 01 | 23:04:02 | 02:54:02 | 9480 | 369 | 4.28 | 1.64 | 0.41 |
| 30061-01-01-04 | 1998 Aug 02 | 08:32:00 | 09:07:56 | 2160 | 378 | 4.36 | 1.65 | 0.40 |
| 30061-01-02-00 | 1998 Oct 02 | 03:26:02 | 08:40:02 | 11040 | 106 | 1.26 | 1.73 | 0.72 |
| 30061-01-02-01 | 1998 Oct 02 | 13:01:58 | 14:01:58 | 3600 | 118 | 1.41 | 1.74 | 0.73 |
| 30061-01-02-02 | 1998 Oct 03 | 01:49:53 | 04:11:54 | 5100 | 103 | 1.23 | 1.73 | 0.71 |
| 30061-01-02-03 | 1998 Oct 03 | 05:44:53 | 09:14:53 | 7800 | 109 | 1.30 | 1.61 | 0.71 |
| 30061-01-02-04 | 1998 Oct 04 | 05:35:44 | 10:49:44 | 11880 | 107 | 1.29 | 1.69 | 0.71 |
| 30061-01-02-05 | 1998 Oct 05 | 16:13:32 | 17:12:33 | 3540 | 108 | 1.30 | 1.74 | 0.73 |
| 30061-01-02-06 | 1998 Oct 06 | 01:49:29 | 09:11:29 | 15360 | 115 | 1.37 | 1.73 | 0.72 |
| 30061-01-02-07 | 1998 Oct 08 | 10:12:10 | 10:47:10 | 2100 | 128 | 1.55 | 1.58 | 0.61 |
| 30061-01-03-00 | 1999 Feb 22 | 18:23:17 | 20:59:17 | 7380 | 271 | 3.22 | 1.46 | 0.42 |
| 40409-01-01-00 | 1999 Feb 22 | 23:46:17 | 05:00:17 | 9300 | 266 | 3.16 | 1.56 | 0.42 |
| 30061-01-03-01 | 1999 Feb 25 | 21:35:42 | 23:57:42 | 6060 | 322 | 3.76 | 1.62 | 0.41 |
| 30061-01-03-02 | 1999 Feb 25 | 23:59:42 | 00:12:42 | 780 | 313 | 3.65 | 1.62 | 0.41 |
| 30061-01-04-00 | 1999 Feb 26 | 15:08:47 | 20:58:48 | 13380 | 390 | 4.55 | 1.69 | 0.45 |
| 30061-01-04-01 | 1999 Feb 27 | 11:56:54 | 14:23:55 | 6840 | 389 | 4.51 | 1.61 | 0.44 |
| 30061-01-04-02 | 1999 Feb 27 | 15:08:56 | 17:35:56 | 6120 | 380 | 4.38 | 1.69 | 0.42 |
| Burst | Date | Radius | ||||||
|---|---|---|---|---|---|---|---|---|
| Number | UT | (s) | (s) | (s) | ( erg cm-2 s-1)aaBolometric flux (see text). | ( erg cm-2) | (s) | Expansion |
| 1 | 1996 Jul 14 04:23:42 | 3.25 | 4.0 | 4.08(8) | 4.6(1) | |||
| 11.0 | 9.4(6) | 3.24(7) | 6.6(2) | Y | ||||
| 2 | 1997 Oct 29 08:10:23 | 3.00 | 4.5 | 4.4(1) | 6.3(1) | |||
| 10.0 | 11.4(3) | 4.25(7) | 6.8(2) | Y | ||||
| 3 | 1998 Oct 02 07:34:54 | 3.75 | 9.0 | 11.0(1) | 4.4(1) | 7.01(7) | 15.9(4) | N |
| 4 | 1998 Oct 02 14:00:27 | 3.50 | 9.0 | 7.6(2) | 4.7(1) | |||
| 20.0 | 9.4(2) | 7.02(8) | 14.6(4) | N | ||||
| 5 | 1998 Oct 03 09:11:55 | 5.25 | 9.0 | 11.5(1) | 3.4(1) | 5.85(7) | 17.2(5) | N |
| 6 | 1998 Oct 06 03:26:58 | 2.75 | 9.0 | 9.11(6) | 4.4(1) | 6.78(7) | 15.1(4) | N |
| 7 | 1999 Feb 23 03:06:16 | 1.25 | 1.5 | 3.7(1) | 2.1(1) | 0.77(2) | 3.3(2) | N |
| 8 | 1999 Feb 26 17:10:53 | 1.50 | 5.0 | 4.01(9) | 5.3(1) | |||
| 10.0 | 9.2(2) | 4.57(7) | 8.6(2) | Y | ||||
| 9 | 1999 Feb 27 17:23:01 | 2.00 | 2.5 | 6.27(7) | 5.2(1) | |||
| 15.0 | 14.6(9) | 4.65(9) | 8.6(2) | Y |
Note. — The three times listed are the rise time of the burst (), the approximate starting time of the exponential decay measured from the start of the burst (), and the -folding time for the exponential decay of the burst ().
| Burst | Fundamental | Harmonic | Sub-Harmonic | TimeaaMeasured from the start time of the burst; see Table 2. | Signal | Radius |
|---|---|---|---|---|---|---|
| Burst | (% RMS) | (% RMS) | (% RMS) | Signal (s) | Duration (s) | Expansion |
| 1 | 11.1 | 5.9 | 2 | 3 | Y | |
| 2 | 6.9 | 6.1 | 4 | 2 | Y | |
| 3 | 9.2 | 9.2 | 9.9 | N | ||
| 4 | 6.6 | 8.0 | 8.7 | N | ||
| 5 | 8.9 | 7.8 | 9.0 | N | ||
| 6 | 8.0 | 7.2 | 6.7 | N | ||
| 7 | 13.3 | 8.9 | 0 | 1 | N | |
| 8 | 5.6 | 11.5 | 3 | 1 | Y | |
| 9 | 5.6 | 7.8 | 2 | 6 | Y |
Note. — Values with one-sigma error estimate represent percent RMS of the largest detected signal; upper limits represent the 90% confidence level of the percent RMS for non-detections.
| Burst | (s) | (cyc.) | (Hz) | (Hz s-1) | (Hz s-2) | (Hz s-3) | /dof |
|---|---|---|---|---|---|---|---|
| 1 | 2.00–11.75 | 0.410.05 | 523.670.06 | 0.200.04 | 0.0130.004 | 9.5/8 | |
| 2 | 2.5–10.5 | 0.360.05 | 523.900.14 | 0.300.16 | 0.150.04 | 0.0110.004 | 5.0/5 |
| 7 | 0.25–1.00 | 0.520.08 | 523.690.20 | 4.5 | 7e-5/1 | ||
| 8 | 0.00–0.75 | 0.980.07 | 522.630.21 | 5.4 | 0.01/1 | ||
| 8 | 2.0–5.0 | 0.880.07 | 524.760.13 | 0.720.14 | 4.6 | 7.0/2 | |
| 9 | 2.0–11.0 | 0.790.05 | 523.540.04 | 0.250.03 | 0.0190.003 | 13.3/11 |
Note. — Polynomial fits to the phase models for bursts with detected burst pulsations. Time is measured from the burst start (Table 2), uncertainties are one-sigma, and quoted upper limits are two-sigma limits on the absolute value of the coefficient.
| Burst | (cyc.) | (Hz) | (s) | (Hz) | (cyc.) | /dof |
|---|---|---|---|---|---|---|
| 1 | 0.410.04 | 524.61 | 4.1 | 0.960.04 | 3.9 | 10.8/8 |
| 9 | 0.840.06 | 524.48 | 2.6 | 1.060.05 | 2.8 | 13.2/11 |
Note. — Exponential-relaxation fits to the phase models for Bursts 1 and 9. Time intervals are the same as in Table 4. is the total phase loss relative to the asymptotic frequency, and is not an independent parameter of the fit (see text for details).