The Mid-Infrared Spectra of Interacting Galaxies: From ISO to SIRTF
Abstract
We present mid-infrared (5–16) images and spectra of a sequence of interacting galaxies, observed by ISOCAM. The galaxies were selected as being at progressive stages in the time evolution of a merging event, following what is known as Toomre’s “merger sequence”, and having no detected contribution from an active galactic nucleus (AGN) in their mid-infrared spectrum. To trace the intensity of the global star formation in those galaxies, we use the ratio of the 15 to 7 flux. Our analysis indicates that this ratio increases from 1 to 5 as galaxies move from the pre-starburst to the merging/starburst phase only to decrease to 1 again in the post-starburst phase of the evolved merger remnants. Moreover, we find that the variation of this ratio is well correlated with the one of the IRAS 25/12 and 60/100 flux ratios. The potential to test and improve upon these results using the Infrared Spectrograph (IRS) on board SIRTF is discussed.
keywords:
ISO – infrared: galaxies – galaxies: nuclei – galaxies: starburst1 INTRODUCTION
One of the major steps in the understanding of galaxy evolution was the realization that tails and bridges are the result of galaxy interactions ([\astronciteToomre & Toomre 1972]). It was also proposed by Toomre (1977) to use the morphology of the observed tidal features and the separation between the galaxies in order to create a “merging sequence” of 11 peculiar NGC galaxies, also found in the Arp atlas. Ever since, improvements in numerical modeling of the stellar and gaseous component in galaxies have clearly demonstrated that galaxy interactions cause large scale instabilities in the galactic disks leading to the formation of transient bars which drive the gas into the center of the galaxies ([\astronciteBarnes & Hernquist 1992]). Furthermore, numerous multi-wavelength studies of those systems (see Hibbard 1995; Schweizer 1998 and references therein) have been performed in effort to better understand phenomena such as starburst and AGN activity, as well as mass transfers and morphological transformations associated with interacting galaxies. One of the major quests in those studies remained the identification of observational characteristics which could be used as alternatives of assigning an “age” to the event of the interaction (i.e. [\astronciteSchweizer & Seitzer1993]). The discovery by IRAS of the class of luminous IR galaxies which harbor of obscured massive starbursts ([\astronciteSoifer et al.1986]) and the revelation later on that they are also interacting/merging systems ([\astronciteSanders et al.1988]), attracted further attention to this problem (see [\astronciteSanders & Mirabel1996] for a review).
In this paper we examine the global star formation activity in a sample of interacting galaxies as it becomes evident in the mid-infrared via the heating of the dust.
2 THE SAMPLE
The galaxies of our sample were part of the ISOCAM ([\astronciteCesarsky et al. 1996]) active galaxy proposal CAMACTIV (P.I. F. Mirabel). The galaxies were observed in the spectro-imaging mode with the Circular Variable Filter (CVF) or, for weaker sources, in the raster mode with broad band filters. Information on the whole CAMACTIC sample as well as on the observational techniques can be found in [*]thesis and [*]olivier. The standard data reduction procedures pertinent to ISOCAM data were followed resulting in a photometric accuracy of 20%.
The galaxies were selected with an apriori knowledge of their stage of interaction and also based on the fact that the AGN contribution is negligible in the mid-infrared ([\astronciteLaurent et al. 1999]). They form an evolution sequence from galaxies in early stages of interaction: NGC4676, NGC 3263, and NGC 520; to galaxies approaching a merger stage: NGC3256, NGC6240 and Arp220; and finally to the classified late merger remnants: NGC7252 and NGC3921. The selection process and details on the galaxies are beyond the scope of this paper and will be presented in [*]vassilis.
3 DISCUSSION
3.1 The ISO results
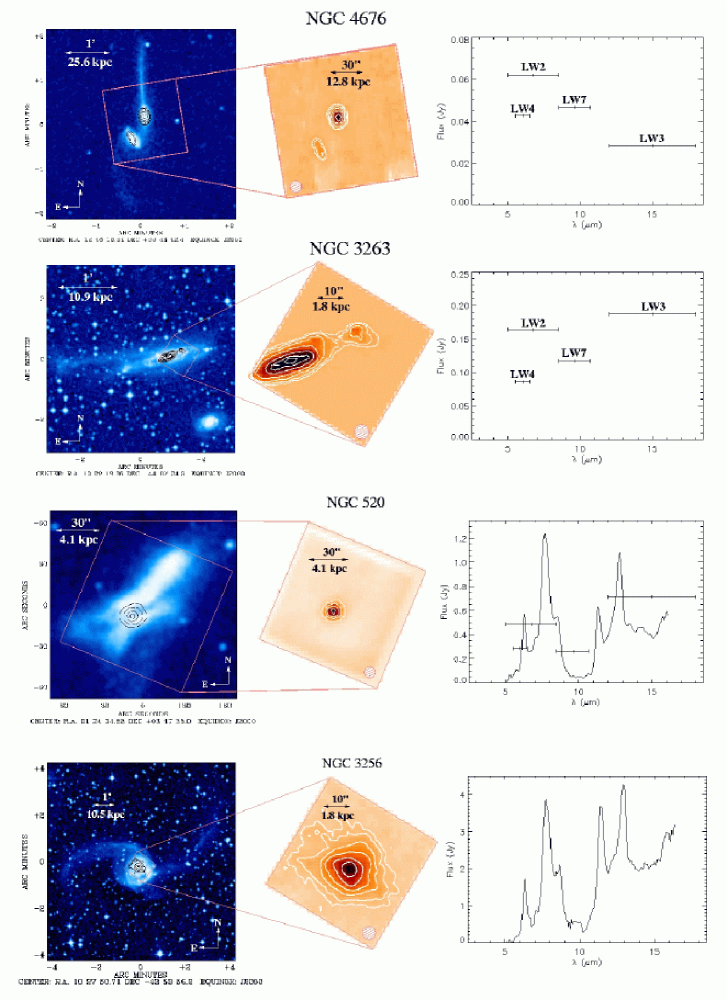
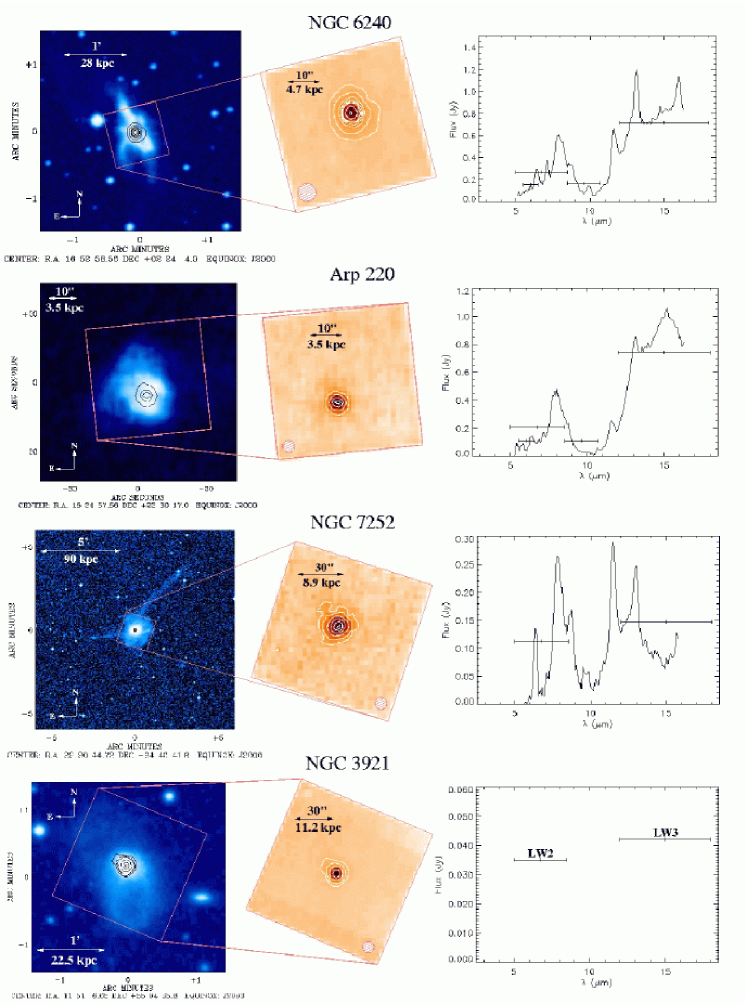
In Figures 1 and 2 we present mid-infrared images and integrated spectra of the galaxies in our sample. All galaxies show evidence of star formation activity as it’s indicated by the presence of the Unidentified Infrared Bands (UIBs) in their spectra ([\astronciteLéger & Puget1984]). Two trends became apparent from those figures:
As we move from early stage interactions to mergers the continuum at 12-16 m is rising very steeply. This continuum is attributed to Very Small Grains (VSGs) with radius less than 10 nm ([\astronciteDésert et al. 1990]), and is prominent in regions actively forming stars. It reaches its peak in NGC6240 and Arp220, which host massive starbursts, and progressively becomes flatter in post-starburst systems.
The fraction of the mid-infrared flux associated with the UIB features decreases when we reach the starburst face. This can be easily seen by observing the strength of the 7.7m feature. This could be due to the fact than in massive starbursts one has numerous young stars and their associated HII regions. As a result the filling factor of the photodissociation regions where UIBs form would decrease as well as the corresponding UIB emission.
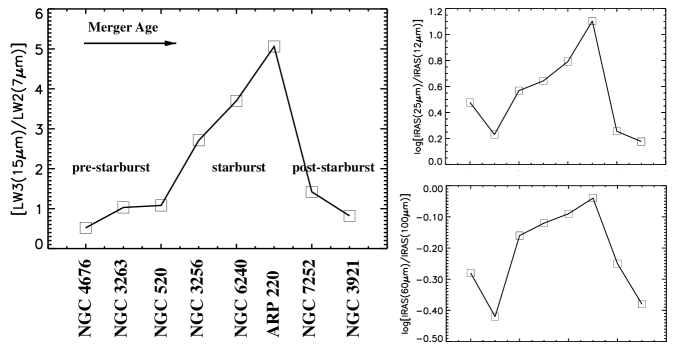
One can attempt to quantify this phenomenon by observing the variation of the global mid-infrared colors of the galaxies. We present the flux ratio the total broad band LW3(12-18 )/LW2(5-8.5 m) for our galaxies in Figure 3. This has been proposed as an indicator of the fraction of the VSG continuum to the UIB feature emission and it is close to 1 for quiescent star formation ([\astronciteBoselli et al.1998]). As we clearly see this ratio presents a monotonic variation with the intensity of the star formation activity in the galaxies.
We can also examine how the IRAS colors vary across the same sequence of galaxies. Of particular interest is the IRAS60/IRAS100 ratio since this indicates the location of the peak of the spectral energy distribution. The correlation of the ISOCAM LW3/LW2 diagnostic ratio with the IRAS colors is apparent. The only discrepant point is NGC4676, but this can be understood since the one of the galaxies has an old stellar population which can contribute to the mid-infrared emission ([\astronciteHibbard1995]).
This result suggests that even though the bolometric luminosity of interacting luminous infrared galaxies is found at , the study of the mid-infrared spectral energy distribution can be used to trace the location of the far-infrared peak. Moreover, the higher spatial resolution one can achieve in the mid-infrared ([\astronciteSoifer et al.2000]) would further facilitate the identification of the most active regions in the galaxies (ie. [\astronciteMirabel et al.1998])
3.2 The SIRTF/IRS contribution
Strong absorption by dust can distort the apparent morphology of interacting galaxies, hiding the main heating source and revealing to us only reprocessed radiation. Consequently, ISO estimates of the absorption using measurements of line strengths ([\astronciteLutz et al.1996]) may be biased towards lower limits. The use of the depth of the 9.6m silicate absorption feature could be an alternative, but as seen in Arp220 this feature can often be nearly saturated and the underlying continuum is poorly determined.
IRS, the infrared spectrograph ([\astronciteHouck et al.2000]) on board SIRTF, with a spectral coverage from 5.3 to 40 m will enable to address this issue. Improved estimates on the absorption could be obtained using the depth of both silicate absorption bands (at 9.6 and 18 m) and the shape of the mid-infrared continuum ([\astronciteDudley & Wynn-Williams1997]). Moreover, the superb sensitivity and good spatial and spectral resolution of IRS will allow us to further expand the diagnostic of Fig.3 in fainter more distant systems.
References
- [\astronciteBarnes & Hernquist 1992] Barnes J.E., Hernquist L.E., 1992, ARA&A 30, 705
- [\astronciteBoselli et al.1998] Boselli A., Lequeux J., Sauvage M., et al., 1998, A&A 335, 53
- [\astronciteCesarsky et al. 1996] Cesarsky C., Abergel A., Agnese P., et al., 1996, A&A 315, L32
- [\astronciteCharmandaris et al.2000] Charmandaris, V., Laurent, O., Mirabel, I.F., et al., 2000, (in preparation)
- [\astronciteDésert et al. 1990] Désert, F.-X, Boulanger, F., Puget, J.L., 1990, A&A, 237, 215
- [\astronciteDudley & Wynn-Williams1997] Dudley C.C., Wynn-Williams C.G., 1997, ApJ 488, 720
- [\astronciteHouck et al.2000] Houck J., van Cleve J., Brandl B., et al., 2000, this volume
- [\astronciteHibbard1995] Hibbard J., 1995, Ph.D. Thesis, Columbia Univ.
- [\astronciteLaurent1999] Laurent O., 1999, Ph.D. Thesis, Univ. Paris XI
- [\astronciteLaurent et al. 1999] Laurent, O., Mirabel, I.F., Charmandaris, V., et al., 1999, A&A. (submitted)
- [\astronciteLéger & Puget1984] Léger A., Puget J.L., 1984, A&A 137, L5
- [\astronciteLutz et al.1996] Lutz D., Genzel R., Sternberg A., et al., 1996, A&A 315, 137
- [\astronciteMirabel et al.1998] Mirabel I.F., Vigroux L., Charmandaris V., et al., 1998, A&A 333, L1
- [\astronciteSanders & Mirabel1996] Sanders D.B., Mirabel, I.F. 1996, ARA&A 34, 749
- [\astronciteSanders et al.1988] Sanders D.B., Soifer B.T., Elias J.H. et al. 1988, ApJ 325, 74
- [\astronciteSchweizer1998] Schweizer, F. 1998, in “Galaxies: Interactions and Induced Star Formation”, Saas-Fee Advanced Course 26, 105
- [\astronciteSchweizer & Seitzer1993] Schweizer F., Seitzer P., 1992, AJ 104, 1039
- [\astronciteSoifer et al.1986] Soifer B.T., Sanders D.B., Neugebauer G., et al., ApJ 303, L41
- [\astronciteSoifer et al.2000] Soifer B.T., Neugebauer G., Matthews, K., et al., ApJ in press (astro-ph/9911045)
- [\astronciteToomre 1977] Toomre A., 1977, in “The Evolution of Galaxies and Stellar Population”, eds. B.M. Tinsley & R.B. Larson, 401
- [\astronciteToomre & Toomre 1972] Toomre A., Toomre J., 1972, ApJ 405, 142