SN Ia Enrichment in Virgo Early-Type Galaxies from ROSAT and ASCA Observations
Abstract
We analyzed nine X-ray bright Virgo early-type galaxies observed by both ASCA and ROSAT. Through spatially resolved spectroscopy, we determined the radial temperature profile and abundances of Mg, Si and Fe for six galaxies. The temperature profiles are consistent with isothermal temperatures outside of a cooler region at the galaxy center. We present new evidence for iron abundance gradients in NGC4472 and NGC4649 and confirm the previous results on NGC4636. Mg and Si abundance gradients on average are flatter compared to those of iron and correspond to an underabundance of alpha-process elements at high Fe values, while at low iron, the element ratios favor enrichment by type II SNe. We explain the observed trend by the metallicity dependence of SN Ia metal production and present constraints on the available theoretical modeling for low-metallicity inhibition of SNe Ia (Kobayashi et al. 1998). Our results imply a cut-off metallicity in the range 0.07–0.3 solar and require a lower limit of 0.3 solar on the Fe contribution of SN Ia. We estimate an SN Ia rate at the centers of the brightest galaxies in our sample of SNU (supernova units). The rates inferred from optical searches should be corrected for the presence of “faint” SN Ia events, since these release limited metals and therefore do not contribute significantly to the measured metallicity in the X-ray gas. With this correction the present-epoch SN Ia rate in early-type galaxies is SNU (Cappellaro et al. 1997) and is therefore comparable with the X-ray estimates. A simple comparison shows the X-ray abundances we derive are still discrepant from optically determined values. We attribute this difference to the low spatial resolution of our X-ray measurements, radial gradients in the abundances and the importance of hydrodynamical effects, particularly the inflow of cooling gas, on the measured X-ray abundances.
Subject headings:
Galaxies: abundances — galaxies: elliptical and lenticular — galaxies individual: NGC4261, NGC4374, NGC4365, NGC4406, NGC4472, NGC4486, NGC4552, NGC4636, NGC4649 — galaxies: intragalactic medium — X-Rays: galaxies1. Introduction
X-ray observations of the hot interstellar gas in early-type galaxies provide a unique tool for the study of stellar metallicities and SN Ia rates within distances of a few effective radii from the galaxy’s center. Detailed comparison of the metallicities determined from X-ray and optical observations, as was done for NGC5846 (Finoguenov et al. 1999, hereinafter F99), demonstrates good agreement.
The abundance pattern detected through X-ray spectroscopy in low-mass systems like groups and early-type galaxies favors a dominance of SNe Ia in the enrichment of the hot gas in these systems (F99, Finoguenov & Ponman 1999, hereinafter FP99). During the early stages of elliptical galaxy formation, SN II products are likely to escape the galaxy, but be contained by the potentials of clusters of galaxies (see Fukazawa et al. 1998 for a recent compilation of X-ray data, hereinafter Fu98). The hot gaseous halos of ellipticals contain elements released via stellar mass loss, plus elements synthesized in SN Ia events, after the cessation of early star formation (e.g. Renzini et al. 1993), which is used to constrain the present-day SN Ia rate. In previous X-ray studies, though, limits on SN Ia activity generally were derived without regard to the metallicity of the progenitor stars. While optical searches find only a handful of SNe Ia in early-type galaxies (Cappellaro et al. 1997), through X-ray observations we can study the rate of SN Ia events as a function of the metallicity of the host galaxy.
This is the first Paper in our project to study the X-ray properties of Virgo galaxies, observed by ASCA. The main goal is to present the results of gas temperature and element abundance measurements, and to compare these with current observations and theoretical models. Our approach provides a full treatment of the instrumental effects, including PSF, as well as gas projection effects, on the derivation of the spatially resolved temperature and abundance structure. We consider separately the behavior of iron and some of the -process elements, that enables us to separate the contribution from different types of SN. Discussion of a number of important quantities, including the luminosity of the hard galactic component is postponed for the next paper, while we await the completion of our observational program on low-luminosity Virgo early-types, that should allow us to present the results for a complete optically selected sample.
This Paper is organized as follows: in section 2 we describe the X-ray analysis, where in subsections we discuss our measurements and comment on individual galaxies; in section 3 we attempt a detailed study of the abundance pattern, measured for our sample. Through a comparison of our results with abundance measurements for the stars in our Galaxy, as well as for the stellar population of cluster early-type galaxies, we propose a progenitor star metallicity dependence for SN Ia metal yields. In this context, we discuss the model for low-metallicity inhibition of SN Ia’s (Kobayashi et al. 1998).
2. Analysis of ROSAT and ASCA Observations
Since our observations are from the ROSAT and ASCA archives, most of the observational information is given elsewhere (e.g. Matsushita et al. 1997, Forman et al. 1993, Mushotzky et al. 1994, Awaki et al. 1994). A detailed description of the ASCA observatory, as well as the SIS detectors, can be found in Tanaka, Inoue & Holt (1994) and Burke et al. (1991). For the initial ASCA data reduction, we use the FTOOLS 4.1 package, in which changes in the instrumental parameters, such as gain and energy resolution are taken into account. To extract imaging information from ROSAT PSPC observations, we use the extended source software described in Snowden et al. (1994) with further references therein.
The combination of ROSAT and ASCA observations, utilized in the present research, makes use of ROSAT’s superior spatial resolution to overcome the difficulties caused by ASCA’s broad, energy dependent point spread function (PSF) in obtaining high quality spectral information. Moreover, in early-type galaxies, since the quantities we measure, in particular the gas temperature and elemental abundance, change rather rapidly with radius, the modeling must be with high spatial resolution. This imposes potential problems on the maximum-likelihood solution. In our regularization method, based on well-known general prescriptions (Press et al. 1992), we retain the spatially fine binning, but require a smoothness for the obtained solution. Details of this procedure are described elsewhere (F99, FP99). We adapted the XSPEC analysis package to perform the actual spectral fitting. Since the effects of the broad ASCA PSF introduces a correlation in the error estimation between adjacent spatial bins, instead of conventional error bars, we present the determination of the parameter uncertainty as a shaded area, while the estimation itself is similar to other studies and is based on the “one parameter of interest” method (Avni 1976) for every spatial point.
In all our spectral modeling, we use the MEKAL model (Mewe et al. 1985, Mewe and Kaastra 1995, Liedahl et al. 1995). For each galaxy, we determined abundances for Mg, Si and Fe, since only these spectral features are clearly seen in the data. In deriving the abundance data, we use the solar abundance table from Anders & Grevesse (1989), where elemental number abundances for O, Ne, Mg, Si, S, Ar, Ca, Fe, Ni relative to hydrogen are (85.1, 12.3, 3.8, 3.55, 1.62, 0.36, 0.229, 4.68, 0.179). We assume solar abundances for He and C. For our galaxy sample, we combined elements into five independent groups: Ne; Mg; Si; S and Ar; and Ca, Fe and Ni. O results are not presented, due to ASCA calibration uncertainties at low energies. We chose the energy interval 0.7–3.5 keV for the ASCA spectral analysis for all the galaxies, except M87. Since the galaxies have a characteristic temperature of 1.5 keV or less, the high-energy cut-off is used to reduce the effects of background subtraction. Modeling M87 is complicated by the presence of a cool (1.3 keV) component within a radius of kpc, in addition to the hotter gas at keV (a typical value within the 200 kpc radius, analyzed here). For the range of temperatures of the hotter component, the Fe L-shell lines are intense at the energies of Mg lines, while the Ne line becomes more separated from the Fe lines (e.g. Mushotzky et al. 1996). As a consequence, for M87 we determine the Ne abundance, but not the Mg. The energy interval, chosen for the spectral analysis of M87 is 0.7–7 keV. The S (K-shell) lines are intense in M87, so we also present results for S.
Due to the choice of low-energy cut-off in our analysis, the results are not sensitive to the presence of possible extra absorption and we freeze the value at the Galactic value (Stark et al. 1992).
All the ROSAT results, quoted in this paper were obtained using the Raymond-Smith plasma code (Raymond & Smith 1977) for spectral modeling. Temperature determinations obtained from this and the MEKAL code, used in our ASCA analysis, agree within 10–20 percent (see also Matsushita et al. 1997).
In our spectral analysis, we took special care to understand and subtract the Virgo cluster diffuse emission. When possible (except for NGC4472 and NGC4636), we estimated the background from the same observation, choosing background regions at a similar distance from the Virgo X-ray center (M87) as the galaxy. While galaxies are characterized by kTe <1.5 keV, the Virgo cluster emission is significantly hotter, keV, which makes this procedure robust.
A hard component at the centers of elliptical galaxies has been found in many ASCA observations (e.g. Matsumoto et al. 1997). Therefore in our spectral fits, we include an additional spectral component in the center with a fixed bremsstrahlung temperature of 6.5 keV and allow the normalization to vary. We will address the analysis of hard components in a follow-up paper.
The apparent problems with spectral analysis of the deep (100 ksec) ASCA observation of NGC4636, discussed by Matsushita et al. (1997) in terms of inadequacies in the available plasma codes, and by Buote (1999) in terms of systematic uncertainties in the calibration of the degrading SIS detectors, require care, particularly at the low energies. To address these problems, we introduce a 10 percent systematic error on the confidence level in the spectral band 0.7-1.5 keV. We also include a 5% rms flux uncertainty for wide energy bands that represents the uncertainty in ASCA’s effective area (e.g., Gendreau & Yaqoob 1997; Markevitch et al. 1998). We found that after introducing these systematic errors, we are able to reduce the to acceptable values. The systematic effects due to the uncertainty in ASCA XRT PSF data were estimated by performing the fits with different spatial binnings.
2.1. Temperature and abundance data

NGC4261 NGC4365 NGC4374
NGC4472 NGC4636 NGC4649
NGC4261 NGC4365 NGC4374
NGC4472 NGC4636 NGC4649
NGC4261 NGC4365 NGC4374
NGC4472 NGC4636 NGC4649
NGC4261 NGC4365 NGC4374
NGC4472 NGC4636 NGC4649
In Table 2.1 we summarize the basic X-ray and optical quantities for the galaxy sample. Col.(1) identifies the galaxy; (2) the adopted distance for km s-1 Mpc-1; (3) blue luminosity; (4) stellar mass to blue light ratio (values from Lauer 1995, scaled to the adopted distance). Columns (5–7) summarize our results from fitting the ROSAT surface brightness profiles for galaxies with the beta-model. Whenever a single component does not describe the profile, we introduce a second, which is found to have the same slope, but a different core radius (). When we do not resolve the core, we assume a value of 0.01′ for . Values for M86, given in columns (5–7) are derived from emission to the south-west of the galaxy. Col.(8) gives our estimation of the total mass within central 50 kpc.
X-ray and optical quantities of the sample
| NCG | D | ||||||
|---|---|---|---|---|---|---|---|
| # | Mpc | / | (′) | (′) | |||
| 4261 | 53 | 12.9 | 8 | 0.40 | 0.01 | — | 3.2 |
| 4365 | 17 | 2.8 | 16 | 0.61 | 0.47 | — | 3.9 |
| 4374 | 17 | 3.5 | 11 | 0.38 | 0.01 | — | 2.0 |
| 4406 | 17 | 4.3 | 12 | 0.36 | 0.44 | — | 2.1 |
| 4472 | 17 | 8.5 | 13 | 0.51 | 0.03 | 0.8 | 3.8 |
| 4486 | 17 | 6.6 | 14 | 0.49 | 0.38 | 3.7 | 5.7 |
| 4552 | 17 | 2.2 | 11 | 0.62 | 0.15 | — | 1.8 |
| 4636 | 17 | 4.8 | 16 | 0.46 | 0.26 | — | 2.0 |
| 4649 | 17 | 5.4 | 18 | 0.55 | 0.21 | — | 3.2 |
In spatially binning the data for our spectral analysis, we used a central bin of 1′ radius, that corresponds to the cusp of the ASCA PSF. The outer radius is determined by the extent of detectable emission. Logarithmic steps in radius were chosen to provide similar statistical quality in the parameters derived for different radii.
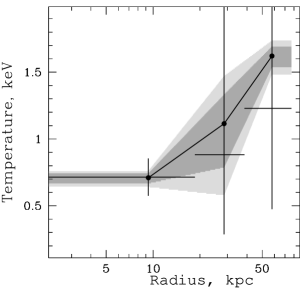
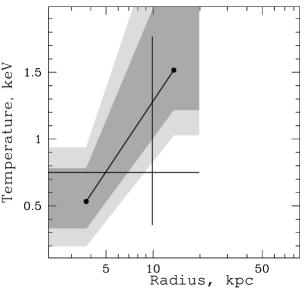
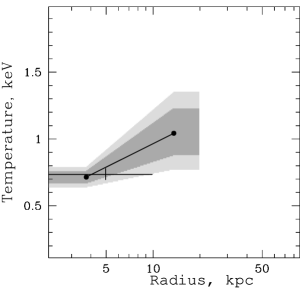
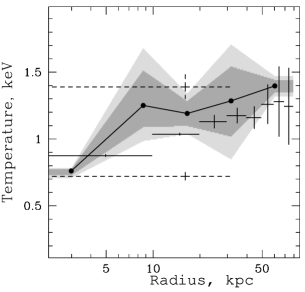
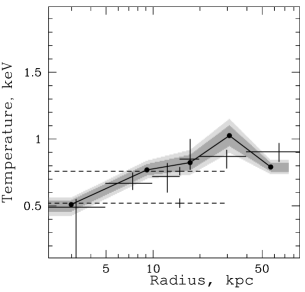
In Fig.2 we present the results on spatially resolved temperature estimations in our sample. A general behavior of the radial temperature profile, found in this and other studies, is the increase of the temperature from a central cool region, with sometimes a small decline in the temperature at large radii. This general picture describes NGC4472, NGC4636 and NGC4649.
ROSAT PSPC temperature determinations, presented in Fig.2 are taken from NGC4365: Jones et al. (1997); NGC4472: Forman et al. (1993); NGC4636: de-projected results inside 8′ (also allowing for a hard component in the center) plus a determination at 8–18′ radii for 20% cosmic abundance from Trinchieri et al. (1994); NGC4649: results, allowing for a hard component in the center, from Trinchieri et al. (1997). We provide ROSAT measurements for the center of NGC4261 (three inner points), and for NGC4374 and M86. All ROSAT errors correspond to 90% confidence limits.
For the ROSAT spectral analysis, we extract spectra with IRAF qpspec, which was upgraded for particle background estimation, as in Plucinsky et al. (1993). Since this approach precludes use of the 0.1–0.2 keV band in further spectral analysis, we analyze data only from the 0.2–2.0 keV energy band.
While ASCA and ROSAT temperature measurements are in remarkable agreement for all the galaxies, a comment should be made for NGC4261. It is one of the low-power radio galaxies from the sample of Worrall and Birkinshaw (1994), where a hard component is assumed, due to the AGN. In our ASCA analysis we included this component, yet our temperature seems to disagree with the ROSAT measurement at larger radii by Davis et al. (1995). To reconcile both measurements, the gas temperature for NGC4261 after an initial rise, should decline, as was measured for NGC5846 (F99).
ASCA SIS temperature measurements†
| Annulus (′) | Annulus (′) | ||
|---|---|---|---|
| NGC4365 | NGC4374 | ||
| 0.0—1.5 | 0.533 (0.33:0.78) | 0.0—1.5 | 0.715 (0.67:0.76) |
| 1.5—4.0 | 1.516 (1.22:2.35) | 1.5—4.0 | 1.043 (0.88:1.23) |
| NGC4472 | NGC4636 | ||
| 0.0—1.2 | 0.761 (0.73:0.77) | 0.0—1.2 | 0.510 (0.46:0.54) |
| 1.2—2.3 | 1.251 (1.09:1.51) | 1.2—2.5 | 0.769 (0.73:0.81) |
| 2.3—4.4 | 1.191 (1.10:1.28) | 2.5—4.5 | 0.824 (0.77:0.88) |
| 4.4—8.4 | 1.285 (1.02:1.54) | 4.5—8.0 | 1.026 (0.95:1.10) |
| 8.4—16. | 1.397 (1.35:1.44) | 8.0—15. | 0.791 (0.76:0.82) |
| NGC4261 | NGC4649 | ||
| 0.0—1.2 | 0.710 (0.67:0.74) | 0.0—1.2 | 0.776 (0.74:0.81) |
| 1.2—2.5 | 1.115 (0.79:1.33) | 1.2—2.3 | 1.190 (1.09:1.37) |
| 2.5—5.0 | 1.621 (1.54:1.69) | 2.3—4.3 | 1.254 (1.05:1.46) |
| 4.3—8.0 | 1.098 (0.83:1.35) | ||
| NGC4552 | |||
| 0.0—4.0 | 0.778 (0.73:0.82) | ||
-
†
Errors are given at 68% confidence level for one parameter of interest. MEKAL plasma code is used for spectral fitting.
Uncertainty in our measurements of the central temperature and abundance for NGC4365 does not allow us to distinguish between the different ROSAT results obtained by Jones et al. (1997) and Fabbiano et al. (1994). The former finds a central temperature of 0.75 (0.51–1.37) keV, when the abundance is a free parameter, while in the latter, the temperature is determined to be 0.2 (0.15–0.26) keV, when the abundance is fixed to Solar and a hard component is added.
We were able only to provide a single temperature determination for NGC4552, which is presented, along with measurements for other galaxies in Table 2.1.
The introduction of a “multi-phase” medium has been used to model the integrated ASCA spectra (Buote & Fabian 1998; Buote 1999). As is seen for NGC4636, NGC4472 and NGC4649 in Fig.2, NGC4406 (in Fig.2.1.3), NGC5846 (F99) and NGC5044 (FP99), this need arises from temperature gradients, previously resolved only by ROSAT and now also by ASCA.
ASCA SIS heavy element abundance measurements†
| Annulus (′) | |||
|---|---|---|---|
| NGC4261 | |||
| 0.0—1.2 | 0.216 (0.02:0.44) | 0.337 (0.11:0.59) | 0.308 (0.26:0.38) |
| 1.2—2.5 | 0.128 (0.00:0.37) | 0.190 (0.00:0.43) | 0.028 (0.00:0.17) |
| 2.5—5.0 | 0.062 (0.00:0.29) | 0.091 (0.00:0.23) | 0.196 (0.15:0.24) |
| NGC4365 | |||
| 0.0—1.5 | 0.257 (0.00:1.39) | 0.063 (0.00:1.41) | 0.688 (0.12:1.01) |
| 1.5—4.0 | 0.432 (0.01:1.15) | 0.127 (0.00:0.46) | 0.041 (0.00:0.15) |
| NGC4374 | |||
| 0.0—1.5 | 0.083 (0.00:0.22) | 0.307 (0.21:0.42) | 0.096 (0.07:0.13) |
| 1.5—4.0 | 0.249 (0.07:0.45) | 0.229 (0.05:0.42) | 0.000 (0.00:0.08) |
| NGC4472 | |||
| 0.0—1.2 | 0.321 (0.15:0.64) | 0.508 (0.33:0.81) | 0.296 (0.20:0.49) |
| 1.2—2.3 | 0.290 (0.08:0.52) | 0.610 (0.43:0.81) | 0.481 (0.35:0.68) |
| 2.3—4.4 | 0.187 (0.00:0.43) | 0.652 (0.48:0.89) | 0.533 (0.41:0.69) |
| 4.4—8.4 | 0.130 (0.00:0.41) | 0.581 (0.30:0.86) | 0.405 (0.14:0.66) |
| 8.4—16. | 0.107 (0.00:0.23) | 0.497 (0.41:0.57) | 0.265 (0.22:0.31) |
| NGC4552 | |||
| 0.0—4.0 | 0.120 (0.03:0.22) | 0.085 (0.01:0.17) | 0.049 (0.03:0.07) |
| NGC4636 | |||
| 0.0—1.2 | 1.044 (0.81:1.31) | 1.053 (0.84:1.29) | 0.456 (0.23:0.59) |
| 1.2—2.5 | 0.725 (0.56:0.91) | 0.888 (0.75:1.03) | 0.564 (0.48:0.65) |
| 2.5—4.5 | 0.408 (0.29:0.52) | 0.551 (0.44:0.65) | 0.383 (0.31:0.47) |
| 4.5—8.0 | 0.106 (0.00:0.24) | 0.325 (0.24:0.42) | 0.151 (0.11:0.20) |
| 8.0—15. | 0.037 (0.00:0.11) | 0.098 (0.06:0.15) | 0.088 (0.07:0.11) |
| NGC4649 | |||
| 0.0—1.2 | 0.063 (0.00:0.17) | 0.091 (0.02:0.18) | 0.117 (0.08:0.17) |
| 1.2—2.3 | 0.000 (0.00:0.18) | 0.139 (0.00:0.32) | 0.293 (0.19:0.48) |
| 2.3—4.3 | 0.000 (0.00:0.18) | 0.355 (0.15:0.53) | 0.164 (0.07:0.30) |
| 4.3—8.0 | 0.000 (0.00:0.22) | 0.644 (0.42:0.99) | 0.000 (0.00:0.15) |
-
†
Definition of the solar units is 3.8, 3.55 and 4.68 for the number abundance of Mg, Si and Fe relative to H. Errors are given at 68% confidence level for one parameter of interest. MEKAL plasma code is used for spectral fitting.
The problem posed by the Buote papers is whether the gas at the centers of galaxies is truly multiphase, or does it only appear multiphase as a result of projection and the coarse spatial resolution of ASCA. Spatially resolved measurements, that account for the gas projection effects, result in central temperatures for NGC4636, NGC4472, NGC4649, NGC5846, NGC5044 of 0.51 (0.42:0.56), 0.76 (0.71:0.78), 0.78 (0.71:0.83), 0.59 (0.56:0.62), and 0.52 (0.49:0.57) keV, respectively. By comparison, for these galaxies, the low temperatures in multiphase models are 0.52 (0.46:0.57), 0.72 (0.69:0.75), 0.67 (0.59:0.74), 0.63 (0.59:0.66), 0.70 (0.67:0.72) keV. For M86 the projected results give 0.70 (0.59:0.75) keV, while a multiphase analysis gives 0.60 (0.37:0.70). All errors are quoted on the 90 % confidence level. The temperature determinations are very similar, with the exceptions of NGC4649, where the “multiphase” value is slightly lower, and NGC5044 located at the center of an X-ray luminous group, where the “multiphase” temperature is higher. The latter can be explained by the pronounced, spatially extended cooling flow in NGC5044, where the majority of emission at 0.7 keV is identified in the spatially resolved analysis (cf FP99).
Since our measurements of central temperatures agree with ROSAT for the galaxies presented in this paper, and also agree with low temperatures from the two-component model of Buote (1999), there is presently no observational need for a multiphase component. However, the abundance determination in the central spatial bin is likely to be controversial. Precise abundance values for the central galaxy regions will remain a subject for discussion until XMM RGS results are available. However, because of these uncertainties, we exclude from further analysis our central abundance measurements for NGC4472, NGC4649 and NGC4406, that disagree with the Buote measurements.
For NGC4636 our systematic errors of 10 per cent are smaller than the 20 per cent systematic errors used by Matsushita et al. (1997) in their spectral analysis of the same observation. Nevertheless, their simplified treatment of the emission does not allow Matsushita et al. (1997) to resolve the central temperature component properly. Acceptable values are obtained in our spectral fitting. As shown in Fig.2 our temperature results agree well with the previous ROSAT determinations. The Matsushita et al. (1997) abundance results agree with ours, but disagree with those by Mushotzky et al. (1996). However, since our abundances are higher than those by Mushotzky et al. (1996), but lower than those by Matsushita et al. (1997), our 90 percent confidence area overlaps both measurements.
The complexity of the surface brightness and temperature distribution for NGC4406 complicates the spectral analysis. We devote a special section (2.1.3) to its analysis.
| Annulus (′) | , keV | ||||
|---|---|---|---|---|---|
| 0.0—2.0 | 1.320 (1.25:1.40) | 0.833 (0.78:0.88) | 0.541 (0.52:0.56) | ||
| 2.0—5.0 | 1.520 (1.45:1.60) | 0.692 (0.65:0.72) | 0.447 (0.43:0.46) | ||
| 2.0—5.0 | 2.459 (2.43:2.49) | 0.491 (0.45:0.53) | 0.658 (0.62:0.70) | 0.498 (0.46:0.54) | 0.477 (0.45:0.51) |
| 5.0—10. | 2.474 (2.44:2.51) | 0.434 (0.39:0.46) | 0.599 (0.56:0.63) | 0.375 (0.34:0.42) | 0.396 (0.37:0.43) |
| 10.—15. | 2.495 (2.48:2.51) | 0.392 (0.34:0.43) | 0.546 (0.51:0.58) | 0.257 (0.22:0.30) | 0.291 (0.28:0.30) |
| 40.—50. | 2.711 (2.58:2.85) | 0.795 (0.39:1.26) | 0.440 (0.23:0.66) | 0.338 (0.08:0.59) | 0.225 (0.16:0.29) |
-
†
Definition of the solar units is 12.3, 3.55, 1.62 and 4.68 for the number abundance of Ne, Si, S and Fe relative to H. Errors are given at 68% confidence level for one parameter of interest. MEKAL plasma code is used for spectral fitting.
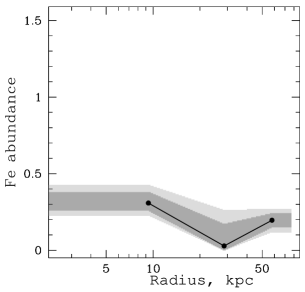
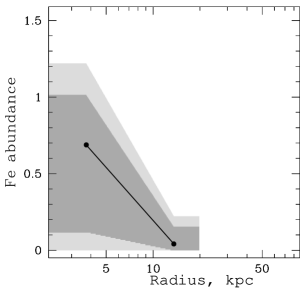
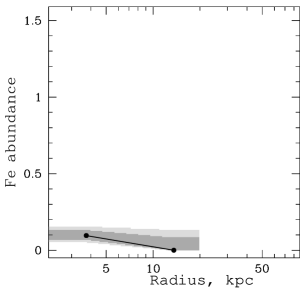
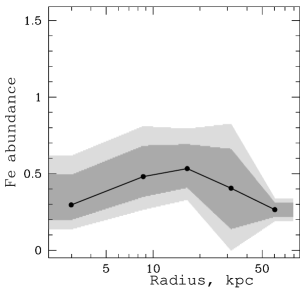
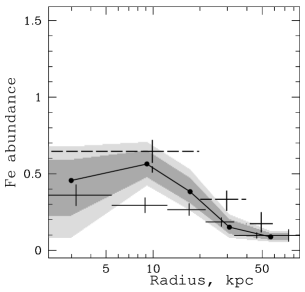
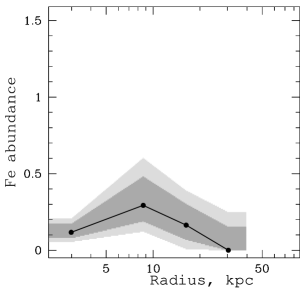
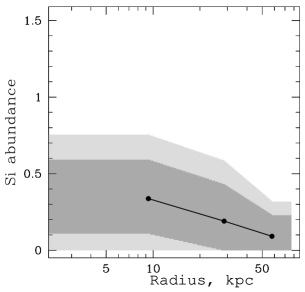
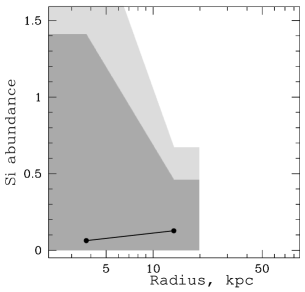
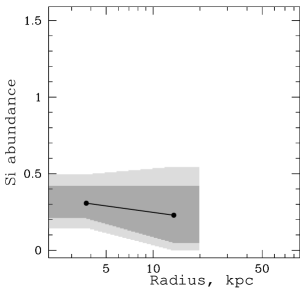
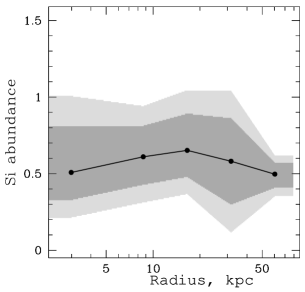
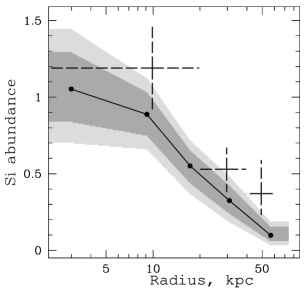
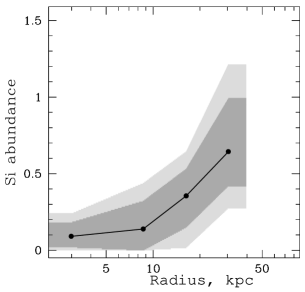
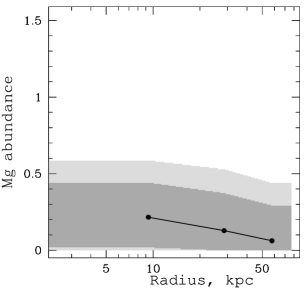
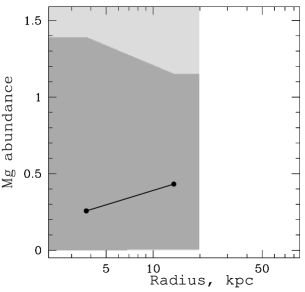
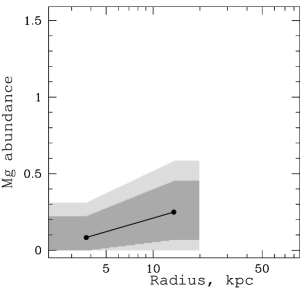
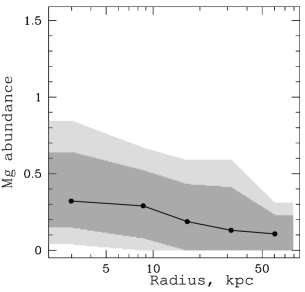
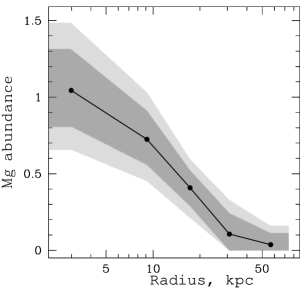
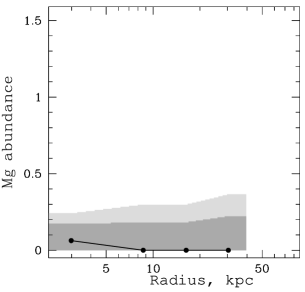
Abundance profiles of Mg, Si and Fe for NGC4472, NGC4636, NGC4649, NGC4261, NGC4374 and NGC4552 are presented in Figs.2, 4 and 4 and in Table 2.1. The central Fe abundance is less than 0.7 solar, when meaningfully constrained (this excludes NGC4365; see our abundance table definition). In most galaxies, the central iron abundance is higher than in the outskirts of the galaxy, where the abundance is always below 0.3 solar and in half the galaxies in this sample, below 0.1 of solar. Except for NGC4636 whose abundances decrease with radius, the radial abundance profiles of Mg and Si are consistent with being flat with averaged values of 0.5 solar for NGC4472 and lower for the rest of the galaxies. The ratio of -elements to iron is nearly constant with radius for NGC4261, NGC4374, NGC4552 and NGC4636, while this ratio increases with decreasing Fe abundance in NGC4472 and NGC4649.
Fe abundance gradients, although clearly established in NGC4636, NGC4472, and NGC4649, may not be a common feature. Therefore a question for future observations will be to resolve the gradients (or show their absence) in galaxies with low abundance, like M84. One difference, already seen, is that the inward increase in iron abundance for relatively high metallicity systems, always corresponds to an underabundance of alpha elements, while for galaxies with low iron abundance (e.g. M84), alpha-elements become overabundant.
Before addressing the overall implications of the abundance results, the following subsections discuss M87, M84 and M86 in detail.
2.1.1 M87
In our study of heavy element enrichment, M87 has a special place, being a cD galaxy at the X-ray center of the Virgo cluster. cD galaxies dominate the light within 200 kpc from the cluster center. Their stellar mass loss and gas mass can explain the observed heavy element abundance within the central 50 kpc region. Schindler, Binggeli and Boehringer (1999) studied two-dimensional galaxy distribution in Virgo and find that it centers aside from M87. Therefore, strong element abundance gradients for M87, presented in Fig.2.1.1, are characteristic of dead stellar population in M87 with extra metals added by SNe. Results from our analysis of M87 are summarized in Table 1. In addition to the ASCA observation centered on M87, we include a 40′ offset observation.
![[Uncaptioned image]](/html/astro-ph/0003202/assets/x25.png)
Abundance profiles for M87. Grey bars represent quantities derived from a cooler component. Error bars are shown at 90% confidence levels.
Although, a low temperature for the cool component could reflect the galaxy’s potential, the similarity in the abundance pattern between cool and hot components, observed in Si and Fe, probably indicates a cooling flow. However a detailed study of the link between dying stellar population of cD and both phases of X-ray emitting gas is needed to fully understand that. A study of the X-ray emission from M87 also was done in the PhD thesis of Matsumoto (1998), who identified two temperature components and suggested these were due to a multi-phase medium. Our results from 3-dimensional modeling show that the hot component does not exist in a detectable amount in the central spatial bin (inside 10 kpc), while the cool component is localized within 25 kpc, which restricts any multi-phase region to a 10–25 kpc shell.
We searched the ROSAT image for counterparts to a possible multi-phase shell. We found significant departures from spherical symmetry in the East, North-West and South-West directions from M87 center, within the radius of this shell (see Fig.2.1.1). For the brighter regions, spatially resolved spectroscopy with ROSAT/PSPC yields an average temperature of keV, using MEKAL code, while the remaining emission within has a temperature of keV (68% confidence intervals are cited). The temperatures differ at a confidence level better then 99%. The ROSAT determination for the hotter component is slightly lower then ASCA value, but still within the 90% error. Similar features, previously identified for e.g. NGC5044, were suggested to be cooling wakes, produced as the central galaxy, which is the focus of the cooling flow, moves in the cluster core. (David et al. 1994). The observations also are consistent with magnetic field confinement of the plasma (cf Makishima 1997). One could attempt to use the strong elemental abundance gradients observed M87 to distinguish between these two scenaria when high spatial resolution observations with at least CCD energy resolution are obtained by Chandra or XMM.
![[Uncaptioned image]](/html/astro-ph/0003202/assets/x26.png)
Wavelet-decomposition of the surface brightness map of M87 in the 0.5–2.0 keV energy band. Asymmetric features are seen between radii of from the center at a confidence level exceeding 99%. A white dot denotes the position of the X-ray peak at 187.704 +12.393 (RA Dec., J2000).
2.1.2 NGC4374 (M84)
NGC4374 is an E1 galaxy with a heliocentric velocity of 1026 km sec-1 and therefore probably lies within the core of the Virgo cluster. Previous X-ray analysis by Forman, Jones & Tucker (1985) showed the presence of the quasar 1222+131 2.4′ south-east of the center of M84. We used the position ( +12∘51′53.3′′, J2000, taken from Bowen et al. 1994) of the quasar to check possible boresight offsets within the ROSAT image. The measured X-ray position is +12∘52′00.60′′ (J2000), so ′′ and ′′ with a statistical error of 4′′. After applying a correction of ′′ and ′′, taken from ROSAT XRT/detector boresighting results (Briel et al. 1993), the positions agree within the uncertainties. The quasar spectrum, derived from ROSAT data is characterized by a power law with photon index 2.13 (1.98–2.27; 90% confidence) and F ph s-1 cm-2 keV-1. In modeling ASCA data, we subtract the quasar spectrum.
Our central abundance determination for M84 has a smaller error bar, compared to the analysis of Matsushita (1998). This results from different treatments of the hard component (she fits in an additional bremsstrahlung model, while we use ROSAT results for the quasar spectrum) and the larger systematic error adopted there.
Radio observations of M84 at 1.4 and 4.9 GHz show a large scale reversal in the magnetic field of the medium situated in front of the radio source (Laing & Bridle 1987). Although, this medium can contribute to the outer parts of the M84 diffuse X-ray emission, to estimate its emission we need spatially resolved spectroscopy on a 10′′ scale, which will be provided with Chandra observations.
2.1.3 Temperature and Abundance Structure in M86.
![[Uncaptioned image]](/html/astro-ph/0003202/assets/x27.png)
Optical image of M86 with wavelet-decomposed X-ray contours from a ROSAT PSPC observation. The image is 64 by 50 arcminutes. In addition to M86, emission is clearly seen from the galaxies M84, NGC4438/9 pair and NGC4388. North is towards the top, east is to the left.
NGC4438/9
M86 M84
NGC4388
![[Uncaptioned image]](/html/astro-ph/0003202/assets/x28.png)
Hardness ratio [R67-R45]/[R67+R45], derived from the ROSAT PSPC image. Adaptive smoothing was used with a minimal Gaussian width of 1′ (). For the range of kTe, Fe abundance, NH, typical for M86, this map represent the temperature distribution of X-ray emitting gas around the galaxy. The cooler regions include the galaxy central region and extend to the north-east and east with slightly increasing temperature. The hottest regions are to the west and south-west of M86. The picture also indicates the “temperatures” of the nearby galaxies, which are similar to the center of M86. Numbers indicate the regions chosen for spectral analysis. Temperature determinations are given in Table 2.1.3. Repeated numbers mean that spectral information was averaged for these points.
An X-ray study of M86 with Einstein (Forman et al. 1979) revealed a peak of emission centered on M86 and a “plume” extending north-west of the galaxy. Ram-pressure stripping of the hot gas from M86 as the galaxy traverses the Virgo cluster was suggested to explain the observed structure (Forman et al. 1979; Fabian, Schwartz & Forman 1980; Takeda, Nulsen & Fabian 1984). The Einstein spectrum of M86 was adequately represented by radiation from an optically thin hot plasma with kT=0.8 keV, although no estimate of the Fe abundance could be made (Forman, Jones & Tucker 1985).
Spatial analysis of the X-ray brightness of M86 from the ROSAT PSPC and HRI data was presented in Rangarajan et al. (1995; hereafter RWEF). In addition to the plume, they identified a southern extension (from the center to about 3′ to the south), a Void (to the north of the galaxy) and a north-eastern arm (extending from the center more than 5′ to the north-east). While the exact regions selected for spectral analysis by RWEF differ from ours, the core and plume are both analyzed in common and the results are in good agreement. In this section we concentrate on the temperature mapping of the diffuse emission around M86 and verify the results of our ROSAT analysis through detailed modeling of the ASCA SIS data.
In Figure 2.1.3 we present the optical image of the M86 field with contours from the wavelet-decomposition of the X-ray emission overlaid. At the center of M86, the cluster emission is less than 5% of the peak galaxy emission. The lowest contour shown around M86 is twice the cluster emission, at the eastern part of M86, closest to the cluster center. An X-ray plume extends 19′ north-west of the galaxy. Two outer contours of X-ray emission resemble optical light seen in Malin’s deep print (Malin 1981). Analysis of the optical image showed optical “blobs” in excess of the elliptical shape associated with the X-ray plume, that could be modeled as star formation regions within the cooling hot gas (Nulsen & Carter 1987). An alternate explanation by White et al. (1991) suggested that optical starlight scattered from stripped dust could explain the elliptical shape of the blue light from the plume and also the infrared emission.
In Figure 2.1.3 we present the (R67–R45)/(R67+R45) hardness ratio derived from the ROSAT PSPC image, overlaid on the X-ray surface brightness contours (the broad band R47 image), where Rnm means summing of images from Rn to Rm, as defined by Snowden et al. (1994). As was shown by Finoguenov (1997), for a temperature in the range 0.5–1.5 keV, and metal abundances exceeding 0.1 solar this ratio uniquely determines the gas temperature in a single-phase plasma. The four gray scale levels correspond to different temperatures with dark gray representing 0.7 keV and light gray the 1.0–1.1 keV interval. Cool regions include the galaxy center and its immediate environs (particularly to the north-east). The cool region extends eastward with slightly increasing temperature. The coolest region in the north-east extension is associated with an enhancement in the X-ray emission, referred to as the North-Eastern Arm in RWEF. The plume temperature structure is not uniform, but is instead cooler in the center toward M86 (immediately north of the galaxy). The hottest regions are those south-west of M86. The Figure also indicates the “temperatures” of the nearby galaxies.
With the spatial resolution of the ASCA SIS data, we identify only five regions in Figure 2.1.3, that correspond to ROSAT regions. We use the ROSAT image as input for the ASCA modeling. Results of the spectral analysis of the temperature structure in M86 from both ROSAT and ASCA are presented in Table 2.1.3. NH was fixed at the Galactic value of cm-2 (Stark et al. 1992).
Temperature structure in M86†
| # | ROSAT , keV | ASCA , keV | L‡ | Comments |
|---|---|---|---|---|
| 1 | 0.752 (0.73:0.78) | 0.600 (0.37:0.70) | 249 | center |
| 2 | 0.743 (0.71:0.78) | 0.691 (0.61:0.77) | 128 | the N-E Arm |
| 3 | 0.834 (0.79:0.87) | 131 | ||
| 4 | 0.937 (0.85:1.05) | 177 | East edge | |
| 5 | 0.867 (0.85:0.88) | 0.857 (0.80:0.89) | 223 | the Plume |
| 6 | 1.076 (1.05:1.10) | 1.034 (0.91:1.14) | 286 | S-W to N4406 |
| 7 | 1.075 (1.04:1.10) | 1.116 (0.98:1.17) | 200 | West edge |
| 8 | 0.871 (0.84:0.90) | 81 | ||
| 9 | 0.760 (0.72:0.80) | included in # 5 | 90 | plume center |
-
†
Errors are given at 90% confidence level for one parameter of interest. Raymond-Smith plasma code was used for ROSAT data, while MEKAL code was used to describe the ASCA data. Col.(1) points to the area of spectrum extraction denoted in Fig.2.1.3 with more comments in col.(5).
-
‡
ROSAT/PSPC flux in ergs cm-2 s-1 in the 0.5–2.0 keV band
Spectral variations in the plume, seen in the ROSAT hardness ratio map (Fig.2.1.3) are quantified by the difference of keV, found between spectral regions 9 and 5. In Table 2.1.3 we give results for the heavy element abundance measured in our ASCA analysis. Given the complex temperature structure of the M86 hot gaseous halo, these abundance determinations should be considered with caution. In summary, within our uncertainties, the abundances of Fe, Mg, and Si are each fairly uniform throughout M86, as well as the plume region.
ASCA SIS measurements of heavy element abundances in M86†
| # | |||
|---|---|---|---|
| 0.255 (0.14:0.46) | 0.489 (0.35:0.66) | 0.146 (0.08:0.23) | 1 |
| 0.266 (0.16:0.38) | 0.303 (0.14:0.42) | 0.098 (0.07:0.15) | 2 |
| 0.276 (0.18:0.37) | 0.440 (0.36:0.52) | 0.220 (0.19:0.25) | 5+9 |
| 0.334 (0.11:0.57) | 0.435 (0.25:0.66) | 0.148 (0.07:0.26) | 6 |
| 0.307 (0.09:0.53) | 0.246 (0.12:0.37) | 0.241 (0.20:0.29) | 7 |
-
†
Definition of the solar units is 3.8, 3.55 and 4.68 for the number abundance of Mg, Si and Fe relative to H. Errors are given at 68% confidence level for one parameter of interest. Col.(4) points to the area of spectrum extraction denoted in Fig.2.1.3. MEKAL code was used for spectral modelling.
3. Discussion
Before proceeding to the theoretical modeling, we should first adopt an appropriate abundance scale. Since abundance measurements in stars, as well as theoretical modeling, are usually given using an abundance table different from that used for X-ray analysis, we converted our results to units of (3.95, 3.55, 3.31) for the Mg, Si and Fe number abundance relative to H for use throughout this section.
3.1. Comparison of the elemental abundance in Virgo ellipticals with the stellar population in the Solar vicinity.
The abundance results presented here for a set of Virgo galaxies appear far from uniform. Some galaxies have uniformly low abundance, while values for others depend on the radius chosen for the measurement and are higher at the centers. A hint toward the unification of the presented data arises from the correlation of a low Fe abundance, either throughout the galaxy or in the outskirts, with an overabundance of alpha-process elements, such as Mg and Si studied here. In Fig.6 we plot the Mg and Si abundance vs Fe, omitting points with very large uncertainties and restricting values of Mg, Si and Fe to be above 0.1 solar. The observed trends of Mg vs Fe and the plot of Si vs Fe at low Fe are not parallel to lines of constant element ratios. As these plots show, for low Fe abundance, Mg and Si become overabundant. However, there is a difference between Mg and Si in that the Mg to Fe ratio is below the solar ratio at high values for iron. These plots suggest an increasing importance of SN Ia enrichment at solar metallicity, compared to 1/10 solar, with SN II enrichment dominant at low metallicities. Evidence for SN II prevalence at low metallicities arises primarily from the abundance data for NGC4374 and the outskirts of NGC4472 and NGC4649. The innermost M87 points for Si and Fe are plotted for comparison and show similar behavior.
Comparison of the X-ray determined abundance pattern for the ISM in elliptical galaxies with that of the stellar population in the Solar vicinity was suggested by the work by Wyse (1997) to search for any differences in the IMF and to constrain the role of SN Ia in element enrichment. The choice of stellar determinations for our Galaxy is limited by the absence of optical data on Si/Fe in early-type galaxies. Only a hint toward an overabundance of Mg/Fe is found from the optical line-index gradients by Kobayashi & Arimoto (1999). In Fig.6 we plot [Mg/Fe] vs [Fe/H] and [Si/Fe] vs [Fe/H] to compare the elemental abundances of Virgo ellipticals with optical measurements for stellar abundances in our Galaxy, as compiled by Timmes, Woosley, and Weaver (1997, see references therein).

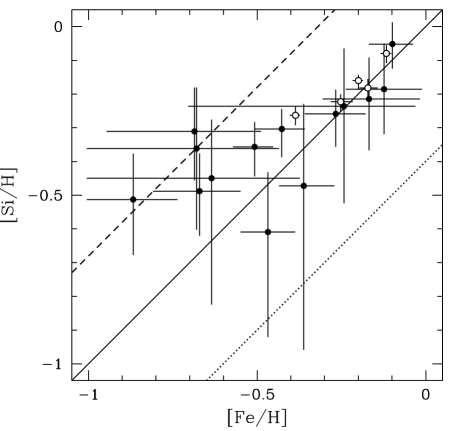
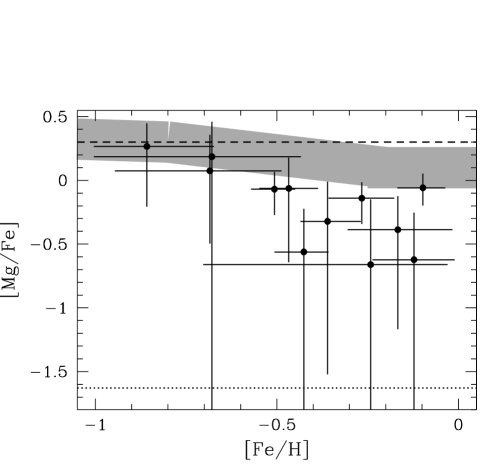
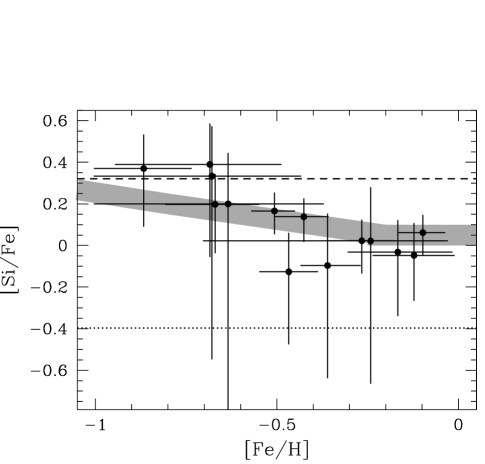
Fig.6 shows that measurements from different galaxies have little intrinsic scatter, despite the diversity in radial abundance profiles. Also, compared to the stellar data, at high Fe abundance, the Virgo X-ray sample demonstrates equal or even a higher SN Ia contribution, compared to the stellar data for our Galaxy (a spiral). However, in many theoretical studies, the abundance pattern of the stellar population in early-type galaxies is assumed to follow SN II yields. Thus, these observations show the importance of SN Ia’s in the chemical enrichment of the hot gas in ellipticals. To produce these results, we briefly discuss gas accretion (cf Brighenti & Mathews 1997), a prolonged duration of star formation (cf Martinelli et al. 1998; F99) and post-formation SN Ia activity.
Since the gas that is highly enriched by SNe Ia lies in the central regions of the galaxies, the likelihood of gas accretion to produce this effect is low. As for the feasibility of prolonged star formation in the central region, Martinelli et al. (1998) showed that, if the galaxy is not considered as one zone, the central galaxy region could have much longer star formation, accompanied by accretion of metal-poor gas toward the center. This scenario, however, would need to address the problem of matching the SN Ia rates adopted in the theoretical modeling with the current X-ray data. At present, most X-ray limits on abundances imply almost no post-formation SN Ia activity.
The merger hypothesis for the origin of the X-ray abundance gradients (Bekki 1998) may be more relevant for the galaxies with low iron abundance. Indeed, the best candidates for galaxy mergers from our sample, NGC4374 and NGC4552 (Schweitzer & Seizer 1992) have low Fe abundance and are good examples of the overabundance of alpha-process elements. While a much more detailed abundance study of galaxies from the Schweitzer & Seizer (1992) list is required to draw any firm conclusion, we mention that the observed tendency is in excellent agreement with differences expected between star formation vs merging scenario for galaxy formation.
3.2. A note on the comparison of X-ray abundance determinations with optical data on elliptical galaxies.
It is generally agreed that early type galaxies are currently passively evolving stellar systems, where significant star formation was cut off at early epochs by a galactic wind (e.g. Ciotti 1991, David et al. 1991). The large amount of hot gas presently found in E’s is attributed to stellar mass loss, and as such, should be characterized by stellar metallicity and stellar velocity dispersion, with supernovae supplying additional elements and energy into the interstellar medium. Previous works, where this scheme was adopted, met a mismatch between stellar abundances, derived via modeling of the optical measurements, and the tremendously low metallicities found in the X-ray gas, which imply both a low metal content in stars and a SN Ia rate that is lower than measured in optical searches (e.g. Arimoto et al. 1997).
Perhaps the first step towards resolving this apparent discrepancy was the discovery of strong abundance gradients in the stellar content of ellipticals (e.g. Carollo, Danziger and Buson 1993). Combining these results with the presence of gas inflow, Loewenstein & Mathews (1991) were able to explain the low X-ray abundances, although the problem of low SN Ia rate persisted. A similar conclusion was derived in our analysis of NGC5846 (F99).
The “apparent inconsistency” between optical and X-ray determinations, claimed by Arimoto et al. (1997), can be attributed to the neglect of significant differences in the spatial resolution of X-ray and optical observations. The “central” abundance value from X-ray measurements often corresponds to a 3′ radius region, compared to a region of only in the optical. In terms of overdensities it corresponds to a change by a factor of , which e.g. exceeds a difference between clusters of galaxies and clouds (see Cen & Ostriker 1999 for a discussion of crucial importance of equal overdensity in metallicity comparisons). Moreover, the complex temperature structure of the gas at the galaxy center often precludes precise abundance determinations at the center (Buote 1999, FP99). Even in cases when we are fairly confident in our abundance determinations, as e.g. NGC4374, the central region corresponds to 1′. An average optical abundance means a luminosity averaged value typically within a few arcseconds, while the metallicity of X-ray gas reflects mass-averaged metallicities from a dead stellar population, that has been heavily smoothed by the inflow motion of the gas in a cooling flow (cf Loewenstein & Mathews 1991).
Moreover, as Bazan & Mathews (1990) showed, the evolutionary tracks from Van den Bergh & Bell (1985) exhibit shorter main sequence lifetimes for low metallicity stars due to their higher luminosities, thus these low metallicity stars drop out faster from the “luminosity averaged” abundances while contributing more to the mass-loss averaged abundances. Modeling of the SN Ia rate should be adjusted to allow for this phenomena (F99).
An alternative explanation proposed by Arimoto et al. (1997) criticized the iron abundance determinations based on the Fe L-shell emission line complex. A major effort to understand this issue is presented in Phillips et al. (1999). As it follows from their work, for CCD-resolution spectroscopy in the temperature range around 1 keV, uncertainty of the MEKAL code does not exceed much the 10% level at 0.5–10 keV energy band. However, uncertainties increase strongly at softer energies and lower emission temperatures. Therefore, our adopted level of systematic uncertainties related to the usage of MEKAL code are justified. In addition, we note that the X-ray iron abundance determinations for middle-age SN Remnants in LMC, that also depend on the modeling of L-shell emission complex, are in very good agreement with optically determined values (Hughes, Hayashi & Koyama 1998). Despite a more complex ionization balance in SNR emission, this class of SNR exhibit a spectrum very similar to X-ray spectra of early-type galaxies, that can be understood in view of the sufficient ionization ages of these SNRs.
Another strong argument comes from the similarly low abundances of Si and Mg, as derived in the X-ray analysis of early-type galaxies. These are based on abundance determinations using K-shell lines, so the criticism of Arimoto et al. (1997) is not applicable. Once again, the negative abundance gradients in the stellar population and inflow motions of the X-ray emitting gas require that the X-ray abundance determination be lower in order to agree with the optical results.
3.3. Post-formation SN Ia rate in Virgo ellipticals
The low Fe abundance in NGC4374 (Loewenstein et al. 1994), implies strict limits on the SN Ia rate. This result, along with our abundance measurements that favor SN II production, suggests that at the observed distance from the galaxy center (which is always in excess of for this sample), the stellar population also has a low abundance and that no SN Ia enrichment is allowed. On the other hand, when a higher Fe abundance is observed (e.g. central parts of NGC4636, NGC4472), SN Ia enrichment becomes a necessity.
While the origin of the differences in enrichment pattern is probably due to the presence of a surrounding group potential for NGC4636 and NGC4472, the correlation of an overabundance of alpha-elements with low metallicity suggests metallicity dependent SN Ia rates. An example of related theoretical work is that by Worthey and Weaver (1995) on the metal yields from SN II as a function of metallicity. The only theoretical work discussing the SN Ia behavior, as a function of metallicity, is by Kobayashi et al. (1998). They considered a model for SN Ia progenitor system by Hachisu, Kato & Nomoto (1996) and concluded that no SN Ia occur at metallicities below 0.1 solar. This result provides a good explanation (however not a unique one) for the delay in SN Ia enrichment for Galactic stars. To examine this model, we perform a standard modeling of the X-ray data (as described e.g. in Loewenstein & Mathews 1991).
The X-ray derived abundances can be expressed as
| (1) |
where is the SN Ia rate in units of 1 event (100 yr)-1 /1010 (SNU), is the mass of iron released in each SN Ia event, and is the stellar mass loss, that we adopt as 3 (for the Salpeter IMF) or 5 (for the Arimoto & Yoshii IMF) sec-1 (following calculations by Mathews 1989). In this approximation, we implicitly assume that the SN Ia rate changes with time, similar to the stellar mass loss. Z denotes the metal considered. As was estimated in Arimoto et al. (1997), SN Ia rates found in optical measurements correspond to for the second term on the right of Eq.1, which we adopt.
Eq.1 is simply the ratio of metals released by SNe Ia and by stellar mass loss to the amount of hydrogen released by stellar mass loss (cf Loewenstein & Mathews 1991). As Davis & White (1996) discussed, the X-ray iron abundance is correlated with the strength of the gravitational potential, with SN Ia ejecta escaping from low-mass systems. Although the iron abundance increases with galaxy mass and, in fact even higher iron M/L is found in groups and even more in clusters (e.g. Renzini et al. 1993, FP99), to change the iron abundance (contrary to iron mass), the SN Ia ejecta should escape (or be stripped) preferentially. Otherwise the difference among the different systems is only the time for the gas to accumulate, which cannot explain the low iron abundance in currently adopted SN Ia models (Greggio & Renzini 1983), where the SN Ia rate evolves similar to stellar mass-loss rate (e.g. Loewenstein & Mathews 1991).
In our modeling we consider two different dependences of Si/Fe on Fe. In one we assume the dependence measured for the Galactic (spiral) stellar population. In the other, we assume a constant ratio, corresponding to the integrated yield from SNe II (using the Tsujimoto et al. 1995 yields from Gibson et al. 1997, where the adopted IMF slope was 1.35). The first assumption implies prolonged, yet ineffective star formation, while the second requires a very short period of star formation, so only the contribution from Type II SNe appears in the stellar pattern. Modeling the Mg data is not very sensitive to the choice of the stellar abundance pattern, while the Si data are already well described by the first assumption. Fig.7 demonstrates that a sharp change in the input of SNe Ia to the ISM, as a function of the progenitor metallicity, is required by the measurements of Mg and Si vs Fe abundance.
As seen from Fig.7, within the assumed model our data are sensitive to low rates of SN Ia, although they cannot place upper limits on the rate, contrary to the usual reference to X-ray abundance determinations (cf Loewenstein & Mathews 1991). Thus, in the current study, X-ray observations of early-type galaxies suggest a sharp decline in the SN Ia rate as a function of the progenitor star metallicity, and provide a lower limit on the SN Ia rate. Our results imply a cut-off metallicity in the range 0.07–0.3 solar. Lower values are ruled out by the low abundance in the X-ray gas, while the upper limit is determined by the change in the abundance pattern above 0.2 solar metallicity. To explain the difference in the Si/Fe ratios between M84 and the outskirts of NGC4472 and NGC4649 on one hand and the centers of NGC4472, NGC4649 and NGC4636 on the other, the model requires a lower limit of 0.3 solar on the Fe contribution from SN Ia.
![[Uncaptioned image]](/html/astro-ph/0003202/assets/x42.png)
SN Ia contribution to the iron abundance in NGC4472 (filled circles), NGC4636 (filled triangles), NGC4649 (filled squares) and M87 (open circles, values are given for both cold and hot components) at radii expressed in units of . Error bars are shown for 68 percent confidence level. The units of Fe abundance are relative to H in number.
Although any abrupt rise with radius in the metallicity of the X-ray gas will be smeared inward by the gas inflow, studies of the SN Ia rate as a function of radius can provide additional constraints. In the following we assume the stellar Si/Fe ratio corresponding to the SN II yields from Woosley & Weaver (1995) with reduced Fe yields ( Timmes et al. 1995; Prantzos & Silk 1998) and use our Si and Fe measurements to separate the contributions from different types of SN. In Fig.3.3 we present our estimates for the SN Ia contributions to the iron abundance in NGC4472, NGC4636, NGC4649 and M87 at radii expressed in units of (corresponding to 1.733′, 1.683′, 1.227′ and 1.766′, respectively). The average value among NGC4472, NGC4636, NGC4649 measurements within is solar (90 per cent confidence), which is consistent with the estimate for M87 itself. Beyond , the SN Ia contribution to the iron abundance is less than 0.3 solar. If we use the Arimoto & Yoshii IMF values, we find SN Ia rates for individual galaxies of SNU for NGC4472, SNU for NGC4636, for NGC4649 and for M87 (uncertainties are at the 90 percent confidence level). These can be compared with the SN Ia rate of SNU from SN Ia searches (Cappellaro et al. 1997). We scale our calculations to the km s-1 Mpc-1, used in their work and assume 0.4 of Fe is released by each SN Ia event (compared to the usually assumed iron mass of 0.7, Arimoto et al. 1997), which increases our estimates for SN Ia rates from the X-ray abundances (as well as usage of reduced SN II Fe yields). Our choice for estimating stellar mass loss corresponds to a flat IMF, that also favors higher SN Ia rates.
Quite interestingly, not all SN Ia found in optical searches are similar. The estimated rate of 0.05 SNU applies to the “faint” SN Ia (Cappellaro et al. 1997). If we neglect these as a source of metals, then the effective SN Ia rate would be SNU. We note that to compare with the optical rate, one should average the SN limits over all the galaxies from the complete sample. Thus, if low-luminosity galaxies have lower SN Ia rates compared to the bright cluster members, then SN Ia optical magnitude-limited searches will be biased toward detecting the higher rates. From the current optical data on SN Ia rates, we conclude that these are consistent with X-ray measurements for bright early-type galaxies.
We conclude that models, in which the SN rate (or yields) depend on metallicity, can solve the long standing problem of low X-ray limits on SN Ia rates compared to those derived from optical searches (cf Arimoto et al. 1997 and references therein). In addition, the model of Kobayashi et al. (1998) employed here, has predictions for high redshift SN Ia searches that could be directly tested in the future. The sample of galaxies studied here consists of optically bright galaxies. An important test for the SN Ia models could be made through X-ray studies of optically faint galaxies, that are presently assumed to have both low metallicities and an underabundance of alpha elements.
4. Conclusions
We performed spatially resolved spectroscopy for a sample of nine early-type galaxies in Virgo using X-ray observations from ROSAT and ASCA. Careful treatment of the galaxy’s X-ray emission reveals a temperature structure consisting of a cool central region and an outward increase in temperature, similar to earlier results. With the ASCA SIS we determine the radial distribution of Mg, Si and Fe. Declining iron abundances with radius are found for NGC4472, NGC4649 and confirmed for NGC4636. Profiles of Mg and Si are on average flatter than for iron, leading to an underabundance of alpha-process elements at the centers of these galaxies. The low iron abundance of NGC4374, found in earlier ASCA studies (Loewenstein et al. 1994) is confirmed by our analysis, with a detection of the corresponding overabundance of alpha-process elements.
We compare the [Mg/Fe] and [Si/Fe] vs [Fe/H] dependences for our sample with the stellar pattern of the Galaxy and conclude that SN Ia enrichment is important for the hot gas in early-type galaxies.
We compare the abundance measurements for our sample with the implications of the low-metallicity inhibition of the SNe Ia, proposed by Kobayashi et al. (1998). We conclude that within this model it is possible to solve the long-standing problem of high SN Ia rates implied in the optical searches compared with the lower X-ray upper limits. In terms of this model, our data characterize the SN Ia rate by a cut-off in the progenitor star metallicity in the range 0.07–0.3 solar and a lower limit on SN Ia rate corresponding to an Fe abundance of 0.3 solar (corresponding to 0.04 SNU for galaxies in our sample).
Adopting an average SN II element pattern for the stellar population in our sample, we illustrate the radial input of SN Ia ejecta into the X-ray gas. Our estimates for the SN Ia rate at the centers of our brightest galaxies give value of SNU. The rates inferred from optical searches should be corrected for the presence of “faint” SN Ia events, since these release little metal and therefore are not “detected” in the X-ray spectra. With this correction the present-day SN Ia rate in early-type galaxies is SNU (Cappellaro et al. 1997) and is therefore comparable with the X-ray estimates.
This work was supported by the Smithsonian Institution and NASA grant NAG5-2588. AF thanks Prof. Chugai, Prof. Makishima and Dr. Matsushita for their discussion of the results presented in this paper. Authors thank the anonymous referee for pointing out to a necessity of a discussion regarding the optical/X-ray abundance determinations.
References
- (1) Anders E. and Grevesse N. 1989, Geochimica et Cosmochimica Acta, 53, 197
- (2) Arimoto N., Matsushita K., Ishimaru Y., Ohashi T., Renzini A., 1997, ApJ, 477, 128
- (3) Avni Y. 1976, ApJ, 210, 642
- (4) Awaki H., Mushotzky R., Tsuru T., Fabian A.C., Fukazawa Ya. et al. 1994, PASJ, 46,L65
- (5) Bekki K., 1998, ApJ, 504, 50
- (6) Biretta J., Owen F. and Hardee P. 1983, ApJ (Letters), 274, L27
- (7) Bowen D.V., Osmer S.J., Blades J.C., Tytler D., Cottrell L., Fan X.-M. and Lanzetta K.M. 1994, AJ, 107, 461
- (8) Brighenti F., Mathews W. G. 1998, ApJ, 495, 239
- (9) Briel U.G., Hasinger G., Voges W. et al. , 1993, The ROSAT Users’ Handbook
- (10) Buote D., Fabian A. 1998, MNRAS, 298, 811
- (11) Buote D., 1999, MNRAS, 309, 685
- (12) Burke B.E., Mountain R.W., Harrison D.C., Bautz M.W., Doty J.P., Ricker G.R. and Daniels P.J., 1991, IEEE Trans., EED-38, 1069
- (13) Cappellaro E., Turatto M., Tsvetkov D., Bartunov O., Pollas C., Evans R. and Hamuy M. 1997, A&A, 322, 431
- (14) Cen R. and Ostriker J. 1999, ApJ (Letters), 519, L109
- (15) David L., Jones C., Forman W. and Daines S. 1994, ApJ, 428, 544
- (16) Davis D.S., Mushotzky R.F., Mulchaey J.S., Worrall D.M. and Birkinshaw M. and Burstein D. 1995, ApJ, 444, 582
- (17) Dressler A. 1980, ApJ, 236, 351
- (18) Fabian A.C., Schwarz J. and Forman W. 1980, MNRAS, 192, 135
- (19) Fabbiano G., Kim D.-W. and Trinchieri G. 1994, ApJ, 429, 94
- (20) Finoguenov A., 1997, PhD thesis, Moscow Institute of Physics and Technics
- (21) Finoguenov A., Jones C., Forman W. and David L., 1999, ApJ, 514, 844
- (22) Finoguenov A. and Ponman T., 1999, MNRAS, 305, 325
- (23) Forman W., Schwarz J., Jones C., Liller W. and Fabian A. 1979, ApJ (Letters), 234, L27
- (24) Forman W., Jones C., Tucker W. 1985, ApJ (Letters), 293, 102
- (25) Forman W., Jones C., David L., Franz M., Makishima K. and Ohashi T. 1993, ApJ (Letters), 418, L55
- (26) Fukazawa Y., Makishima K., Tamura T., Ezawa H., Xu H. et al. 1998, PASJ, 50,187
- (27) Gendreau, K., & Yaqoob, T. 1997, ASCA Newsletter, # 5 (NASA/GSFC)
- (28) Gibson B.K., Loewenstein M. and Mushotzky R.F. 1997, MNRAS, 290, 623
- (29) Greggio L., Renzini A. 1983, A&A, 118, 217
- (30) Hachisu I., Kato M. and Nomoto K. 1996, ApJ (Letters), 470, L97
- (31) Hughes J., Hayashi I. & Koyama K. 1998, ApJ, 505, 732
- (32) Jones C., Stern C., Forman W., Breen J., David L. and Tucker W. 1997, ApJ, 482, 143
- (33) Kobayashi C., Tsujimoto T., Nomoto K., Hachisu I., Kato M., 1998, ApJ, 503, 155
- (34) Laing R.A. and Bridle A.H. 1987, MNRAS, 228, 557
- (35) Lauer T.R. 1985, ApJ, 292, 104
- (36) Liedahl D.A., Osterheld A.L. and Goldstein W.H. 1995, ApJ (Letters), 438, L115
- (37) Loewenstein M. and Mathews W.G. 1991, ApJ, 373, 445
- (38) Loewenstein M., Mushotzky R.F., Tamura T., Ikebe Y., Makishima K., Matsushita K., Awaki H. and Serlemitsos P.J. 1994, ApJ (Letters), 436, L75
- (39) Makishima K. 1997, Proc. of ASCA 3-d Ann. Symp., Tokyo, (Ed. F. Makino, K. Mitsuda), p.137
- (40) Malin D.F., 1981. Am. asrt. Soc. Photo-Bull, No.27, 4.
- (41) Markevitch, M., Forman, W. R., Sarazin, C. L., & Vikhlinin, A. 1998, ApJ, 503, 77
- (42) Martinelli A., Matteucci F. and Colafrancesco S. 1998, MNRAS, 298, 42
- (43) Mathews W.G. 1989, AJ, 97, 42
- (44) Matsumoto H., Koyama K., Awaki H., Tsuru T., Loewenstein M. and Matsushita K. 1997, ApJ, 482, 133
- (45) Matsumoto H. 1998, PhD thesis, Kyoto University
- (46) Matsushita K., Makishima K., Rokutanda E., Yamasaki N., Ohashi T. 1997, ApJ (Letters), 488, L125
- (47) Matsushita K. 1998, PhD thesis, University of Tokyo
- (48) Mewe R., Gronenschild E.H.B.M. and Oord G.H.J. 1985, A&A (Supplement Series), 62, 197
- (49) Mewe R. & Kaastra J. 1995, Internal SRON-Leiden report
- (50) Mushotzky R.F., Loewenstein M., Awaki H., Makishima K., Matsushita K. and Matsumoto H. 1994, ApJ (Letters), 436, L79
- (51) Mushotzky R.F., Loewenstein M., Arnaud K.A., Tamura T., Fukazawa Y., Matsushita K., Kikuchi K. and Hatsukade I. 1996, ApJ, 466, 686
- (52) Nulsen P.E.J. and Carter D. 1987, MNRAS, 225, 939
- (53) Phillips K., Mewe R., Harra-Murnion L., Kaastra J., Beiersdorfer P., Brown G., Liedahl D. 1999, A&A (Supplement Series), 138, 381
- (54) Plucinsky P.P., Snowden S.L., Briel U.G., Hasinger G. and Pfeffermann E. 1993, ApJ, 418, 519
- (55) Prantzos N. and Silk J. 1998, ApJ, 507, 229
- (56) Press W.H., Teukolsky S.A., Vetterling W.T., Flannery B.P. 1992, Numerical recipes in FORTRAN
- (57) Rangarajan F.V.N., White D.A., Ebeling H., Fabian A.C. 1995, MNRAS, 277, 104
- (58) Raymond J. and Smith B. 1977, ApJ (Supplement Series), 35, 419
- (59) Renzini A., Ciotti L., D’Ercole A., Pellegrini S. 1993, ApJ, 419, 52
- (60) Schindler S., Binggeli B. and Boehringer H., 1999, A&A, 343, 420
- (61) Schweizer F. and Seitzer P. 1992, AJ, 104, 1039
- (62) Snowden S.L., McCammon D., Burrows D.N. and Mendenhall J.A. 1994, ApJ, 424, 714
- (63) Stark A., Gammie C., Wilson R., Bally J., Linke R. et al. 1992, ApJ (Supplement Series), 79, 77
- (64) Takeda H., Nulsen P.E.J. and Fabian A.C. 1984, MNRAS, 208, 261
- (65) Thielemann, F.-K., Nomoto, K. & Hashimoto, M. 1993 Origin and Evolution of the Elements. (ed. N.Prantzos, E.Vangioni-Flam & M. Cassé). Cambridge Univ. Press, 297
- (66) Timmes F., Woosley S., Weaver T. 1995, ApJ (Supplement Series), 98, 617
- (67) Trinchieri G., Kim D.-W., Fabbiano G. and Canizares C.R.C. 1994, ApJ, 428, 555
- (68) Trinchieri G., Fabbiano G. and Kim D.-W. 1997, A&A, 318, 361
- (69) Tsujimoto T., Nomoto K., Yoshii Y., Hashimoto M., Yanagida S. and Thielemann F.-K. 1995, MNRAS, 277, 945
- (70) White D.A., Fabian A.C., Forman W., Jones C. and Stern C. 1991, ApJ, 375, 35
- (71) Woosley, S.E. & Weaver, T.A. 1995, ApJS, 101, 181
- (72) Worrall and Birkinshaw M. 1994, ApJ, 427, 134
- (73) Wyse R.F.G. 1997, ApJ, 490, L69