AGN in their Cosmic Environment
University Denis-Diderot, F-75005 Paris \sameaddress1 \sameaddress1 \secondaddressDSM/DAPNIA/SAp, CE Saclay, F-91191 Gif sur Yvette \sameaddress1 \sameaddress1
X-ray emitting-absorbing media in Seyfert 1 galaxies
Abstract
Seyfert galaxies have been shown to exhibit a large variety of features in their X-ray spectra from which the environment of the central engine can be deduced. We focus on the two following aspects: the Warm Absorber, mainly responsible of the soft X-ray properties, and the reprocessing/reflecting plasma medium at the origin of the iron K fluorescent line.
The physical parameters and the location of the so-called Warm Absorber (WA), a photoionized medium along the line of sight to the nuclear region, are more strongly constrained by optical coronal lines than by the oxygen edges observed in the soft X-rays and produced by the WA. The photoionization models also predict the intensities of the X-ray emission lines which are going to be detected with the new generation of X-ray satellites.
An alternative model to the relativistic accretion disc is proposed to explain the profile of the X-ray iron K line observed in the Seyfert 1. This line can be formed in the framework of a quasi-spherical accretion of optically thick clouds. An optically thick photoionization code coupled with a Monte-Carlo code has been developed to compute the entire spectrum from the IR to the hard X-rays for a close geometry with a large covering factor. The multiple Compton reflections allow to reproduce the redshifted broad iron line as detected in several Seyfert 1 galaxies and in MCG-6-30-15.
1 Main X-ray properties of AGN
All types of AGN are bright X-ray emitters and a large number has been discovered after their optical identification with an X-ray source. A large fraction of their high luminosity, due to the release of gravitational energy in the central regions, is radiated in the X-rays ( 20 to 30 % for Seyfert 1 and 10% for quasars (see review by Mushotzky et al. 1993)). In this paper, X-ray properties of Seyfert 1 only are discussed. The shape of the X-ray spectrum above 2 keV is schematically described by a power law (photon index of -1.7) with a high energy cut-off at 100 keV, and below 1 keV it is absorbed by a warm medium. It also exhibits a hump at 20 keV and a soft X-ray excess, particularly strong in narrow line Seyfert 1 galaxies. A broad emission iron line at 6.4 keV is also often seen (Fabian et al. 1995).
The X-ray emission is rapidly variable: variations on a timescale of a few hours are often detected in Seyfert 1 and down to 100 s in MCG-6-30-15 (e.g. Yaqoob et al. 1997). Such short timescales indicate emitting regions smaller than 1013 cm. The detection of a strong correlation between the UV and the X-rays with a small or even null lag might favor an origin of the UV due to the reprocessing of the X-rays from a source close to the black hole. However this simple scenario is in conflict with recent observations of the two sources NGC 7469 (Nandra et al. 1998) and NGC 5548 (Chiang et al. 1999). On longer timescales several objects including some Narrow Line Seyfert 1 galaxies have exhibited two brightness states with different spectral shape, similarly to galactic black hole candidates (f.i. 1H0419-577, Guainazzi et al. 1998). Several phenomenological models have been proposed to account for the bulk of the X-ray emission such as the disk-corona model, the standard irradiated model, the dense blob model and the dilute cloud model (see review by Collin & Dumont 1996).
2 The Warm Absorber
2.1 Spectral characteristics
About half of the Seyfert 1 show absorption edges at 0.8 keV identified either to O vii (0.74 keV) and/or O viii (0.87 keV) (Reynolds 1997). In addition a few emission lines have been detected in the X-rays (O vii, O viii, Fe-L, Ne ix) and in the UV (Ne viii, O vi). These features reveal the presence of partially or totally photoionized medium located in the central regions, the so-called Warm Absorber (WA).
2.2 Constraints brought by coronal lines
With the aim of determining the physical parameters of the WA and its location,
we have constrained the range of possible values of these parameters by
confronting the predictions of models with observational data
(Porquet et al. 1999).
The absorption edges and the resonance lines beeing almost insensitive
to the density in the range 104 - 10cm-3, we have used
optical coronal lines
([Fe X], [Fe XIV]) to constrain this parameter.
Pure
photoionisation models and hybrid models (radiative plus collisional
processes with fixed temperature) have been investigated for a large grid
of parameters. Model computation is done by coupling two codes, one computing
the thermal and ionisation structure of photoionised optically thin clouds
(PEGAS), the other code (IRIS) computing detailed multi-wavelength spectra
of these clouds (Dumont & Porquet 1998). The incident
spectrum is that
described by Laor et al. (1997). The ionisation state of the WA depends
of the ionisation parameter
where L is the
bolometric luminosity (erg s-1),
R the distance from the illuminated side of the cloud to the
central source and nH the density, assumed to be constant.
A covering factor of 0.5 was chosen,
consistently with the proportion of Seyfert 1 showing soft X-ray absorption
edges. Input parameters are the column density NH, the
density nH, the parameter and the ionisation
process/temperature.
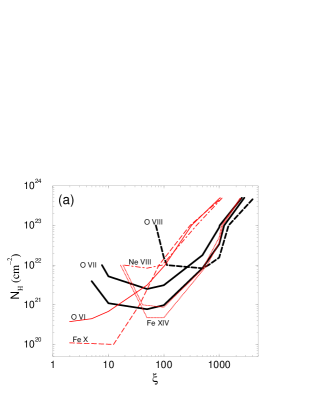
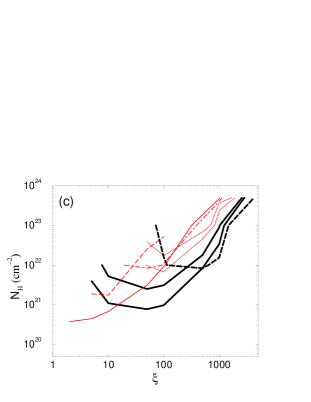
Figure 1 is an illustration of the constraints brought by
the observational features on the above physical parameters. Average
values of the optical
depths and the equivalent widths are derived from the literature.
Models giving rise to coronal lines stronger than observed are
ruled out.
This confrontation of the predictions with the typical WA features and coronal
lines observed in Seyfert 1 and also with those of the peculiar object
MCG-06-30-15
leads to the two following main conclusions (Porquet et al. 1999). First
the density of the warm absorber should be cm-3. Second, a
two-zone
model is favoured, with an inner region located at a similar distance
as the BLR ( cm) and responsible of the O viii edge,
and an outer one associated with the O vii edge, in agreement
with results found by Otani et al. (1996) for MCG-6-30-15 based on
variability studies.
2.3 Diagnostics based on soft X-ray lines
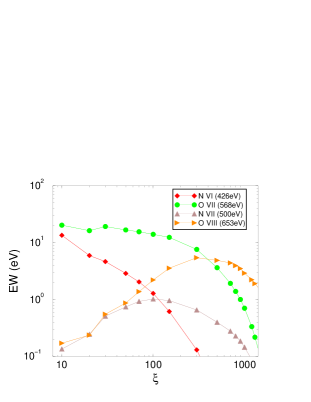
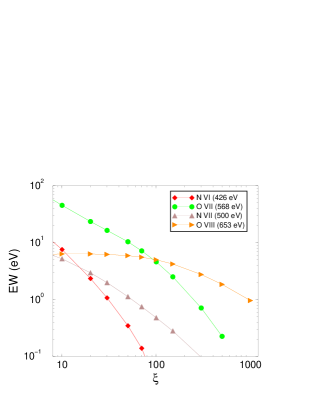
Additional information will be soon available from the new generation of X-ray satellites (Chandra, XMM, Astro-E) which will allow the detection of emission lines thanks to their unprecedented high spectral resolution.
Figure 2 illustrates the strong influence of the ionisation parameter on the equivalent widths (EW) of the main soft X-ray resonance lines. The EW have been computed both in the case of a pure photoionisation model and in a hybrid case for a fixed temperature of 106 K. In the first case, the O vii line is the strongest line over a wide range of parameter values while the O viii line dominates at high ( 400 erg.cm.s1). For the hybrid model, the O vii line becomes dominant for a lower value ( 100) (Porquet et al. 1998). However it should be noted that these results strongly depend on the turbulence velocity and on the functional form of the escape probability chosen to compute the line intensity, which depends on the fact that the redistribution in the line is partial or not.
3 The Iron K fluorescent line
3.1 Main characteristics
A broad Fe line has been detected in 14 among 18 Seyfert 1 galaxies observed with ASCA (Nandra et al. 1997), peaking at 6.4 keV ( neutral iron), with a typical equivalent width of 150 eV and showing an asymmetric profile with an extended red wing. The line intensity decreases for high X-ray luminosity.
3.2 Modeling
To account for the Compton hump at 20 keV, all models require the presence of a reflecting cold or mildly ionized medium illuminated by a hard X-ray continuum (typically with an energy power law index of -1), most probably originating from thermal Compton up-scattering of soft seed photons. The iron line is produced by fluorescence following the photoelectric absorption at the Fe K edge energy. Two main explanations have been proposed to explain the red wing : either the effects of gravitational and Doppler shifts or multi-Compton down-scattering. The relativistic diskline model (Fabian et al. 1989) has been applied to different individual objects (Nandra et al. 1997, Iwasawa et al. 1996). It consists of a thin disk illuminated by a hot corona or a central point source. It can account for the Fe line profile in a Schwarzschild geometry or in a Kerr geometry for specific observations (such as during a flare observed in MCG-6-30-15 (Iwasawa et al. 1999)), but provided that the emissivity is defined by a power law function of radius R-α, being a free parameter, and assuming a line at 6.4 keV. An inclination angle of and a reflection factor close to 1 are requested. However this model relies on our knowledge of the very inner parts of the disc which is still uncertain as far as instabilities probably alter the density and ionisation structure.
3.3 Multi Compton reflection in a closed geometry
The Compton broadening has been first suggested as an alternative model by Czerny et al. (1991) to explain the Fe line in NGC 3227. However cold material only produces a narrow red shoulder. A broad red wing requires repeated scattering, which are expected to occur in an ionised medium (Fabian et al. 1995). Broadening of an intrinsic narrow Fe line, transmitted through a highly ionized Thompson thick cloud, has been proposed by Misra and Kembhavi (1998). This model has been ruled out by Reynolds & Wilms (1999) for MCG-6-30-15 from the continuum variability timescale and the absence of an observed soft excess. Here we describe a different approach for which multiple scatterings arise in a closed shell geometry, ensuring an amplification of the radiation inside the cloud system and thus the presence of highly photoionised clouds (Abrassart, 1998). The context of this model is the quasi-spherical accretion model proposed by Collin-Souffrin et al. (1996). The line profile and spectral continuum are computed by coupling a transfer code (TITAN) adapted to Thomson-thick media and a Compton scattering Monte-Carlo code (NOAR). A detailed description of these codes is found in Dumont et al. (1999). Iterations are done between both codes until convergence between the ionisation state and the spectral energy distribution inside the shell. The Compton code provides the transfer code with the local Compton gains and losses and with an amplified ’effective’ primary (Abrassart & Dumont 1999). Reciprocally the temperature and ionisation structure are provided by the transfer code.


We have applied this model to the intensively observed source MCG-6-30-15. Abrassart (1998) showed that in order to ensure a Compton hump strong enough, as shown by RXTE data, cold material is requested while the red wing requires the presence of ionised material. A high covering factor () is needed. This model also applies to the ASCA data at higher spectral resolution than the RXTE ones. A satisfactory fit is obtained for the 1994 SIS observations, using an incident spectrum described by the average AGN distribution derived by Laor et al. (1997), a high covering factor of 0.9, and clouds of different ionisation states (30% highly ionized (=30000 erg.cm.s-1) and 70% near neutral (=300)) (see fig. 3). The red wing of the iron line is well reproduced while the model predicts an excess of highly ionised Fe emission at 6.9 keV which could be suppressed with an even more highly ionised medium. The presence of a two-phase medium might be the result of a disk disruption leading to a high density contrast.
4 Perspectives
X-ray emission in AGN is a powerful tool to investigate the very close environnement of the putative black hole. As shown above, while present data cannot univocally constrain the origin of the Fe K line and the physical parameters of the warm absorber medium, the present/near-future generation of X-ray satellites (Chandra, XMM, Astro-E) will offer an unprecedented high spectral resolution and a much higher sensitivity. This will provide an unique opportunity to give access to the soft X-ray emission lines expected to arise from the WA. However this detailed observational information should be supplemented with theoretical improvement (precise computation of X-ray atomic data, computation of realistic disc structure, non-stationary hydrodynamics models including possible shocks).
Variability studies on short timescales of the intensity and of the profile of the Fe K line are crucial to unambiguously confirm the existence of an accretion disc, to determine the spin of the black hole and to derive the ionisation structure of the innermost regions. But the richness of the data will place greater demands on computations (such as which still suffers from the lack of a consistent model accounting for the complete UV, soft and hard X-ray spectral distributions.
References
- [1] Abrassart, A., 1998, in Proc. of the 32nd COSPAR Scientific Assembly held in Nagoya, Japan, Adv. in Space research, vol. 25 in press.
- [2] Abrassart, A. & Dumont, A.-M., 1998, in Proc. of the First XMM workshop on “Science with XMM”, held in Noordwijk, The Netherlands, M. Dahlem (ed.), URL http://astro.estec.esa.nl/XMM/news/ws1/ws1_papers.html
- [3] Chiang J., Reynolds, C.S., Blaes, O.M., et al., 2000, submitted to ApJ (astro-ph/9907114)
- [4] Collin-Souffrin, S., Dumont, A.-M., 1996, in Proc. of the Workshop “Accretion Disks”, Eds E. Meyer-Hofmeister & H. Spruit, Springer, p216.
- [5] Collin-Souffrin, S., Czerny, B., Dumont, A.-M., Zycki, T., 1996, A&A, 314, 393
- [6] Czerny B., Zbyszewska, M., Raine, D. 1991, in “Iron line diagnostics in X-ray sources”, Ed. A. Treves, p226
- [7] Dumont A.-M. , Abrassart, A., Collin, S., 1999, submitted
- [8] Dumont, A.-M., Porquet, D., 1998, in “Structure and Kinematics of Quasar Broad Line regions”, Eds C.M. Gaskell et al., ASP Conf. Series, vol. 175, p19
- [9] Fabian, A.C, Rees, M.J., Stella, L. et al., 1989, MNRAS, 238, 729
- [10] Fabian, A.C, Nandra, K., Reynolds, C.S., et al., 1995, MNRAS, 277, L11
- [11] Guainazzi, M., Comastri, A., Stirpe, G.M., et al. 1998, A&A, 339, 327
- [12] Iwasawa, K., Fabian, A.C., Reynolds, C.S., et al., 1996, MNRAS, 282, 1038
- [13] Iwasawa, K., Fabian, A.C., Young, A.J., et al. 1999, MNRAS, 306, L19
- [14] Laor, A., Fiore, F., Elvis, M. et al. 1997, ApJ, 477, 93
- [15] Misra, R., Kembhavi, A.K. 1998, ApJ, 499, 205
- [16] Mushotzsky, R.F., Done, C., Pounds, K.A. 1993, ARAA, 31, 717
- [17] Nandra, K., George, I.M., Mushotzky, R.F., Turner, T.J., , Yaqoob, T. 1997, ApJ, 477, 602
- [18] Nandra, K., Clavel, J., Edelson, R.A., et al., 1998, ApJ, 505, 594
- [19] Otani, C., Kii, T., Reynolds, C.S. et al. 1996, PASJ, 446, L137
- [20] Porquet, D., Dumont, A.-M., 1998, in “Structure and Kinematics of Quasar Broad Line regions”, Eds C.M. Gaskell et al., ASP Conf. Series, vol. 175, p19.
- [21] Porquet, D., Dumont, A.-M., Mouchet, M. 1998, in Proc. of the First XMM workshop on “Science with XMM”, held in Noordwijk, The Netherlands, M. Dahlem (ed.), URL http://astro.estec.esa.nl/XMM/news/ws1/ws1_papers.html
- [22] Porquet, D., Dumont, A.-M., Collin, S., Mouchet, M. 1999, A&A, 341, 58
- [23] Reynolds, C.S. 1997, MNRAS, 286, 513
- [24] Reynolds, C.S., Wilms, J., 2000, ApJ, in press (astro-ph/9912120)
- [25] Yaqoob, T., McKernan, B., Ptak, A., Nandra, K., Serlemitsos, P.J., 1997, apJ, 490, L25
- [26]