The Sombrero galaxy ††thanks: Based on observations taken with the Canada-France-Hawaii Telescope, operated by the National Research Council of Canada, the Centre National de la Recherche Scientifique of France, and the University of Hawaii, and observations with the NASA/ESA Hubble Space telescope obtained at the Space Telescope European Coordinating Facility, jointly operated by ESA and the European Southern Observatory.
Abstract
We present the results of new 3D TIGER spectroscopic observations and archived HST/WFPC2 and NICMOS images of the central region of M 104. The [N ii]+H images reveal the presence of a nuclear spiral structure, and the gaseous kinematics in the central arcsecond shows evidence for kinematical decoupling of the central peak. A straight nuclear dust lane, with a weak symmetric counterpart, is seen in the and colour maps. These results hint for the presence of a strong nuclear bar, that would be located inside the inner Linblad resonance of the large-scale bar discussed by Emsellem (Ems95 (1995)).
Key Words.:
Galaxies: individual: M 104 – Galaxies: evolution – Galaxies: kinematics and dynamics – Galaxies: nuclei – Galaxies: photometry – Galaxies: stellar content1 Introduction
This is the third of a series of papers dealing with optical observations of the Sombrero galaxy (M 104, NGC 4594). We report here the results of 3D spectroscopy of the nuclear region of M 104 with the TIGER instrument, in the 6750/460 Å spectral domain, which includes the [N ii]6548,6583, H and [S ii]6717,6731 emission lines. This 3D dataset is used in combination with archived images acquired with the Wide Field and Planetary Camera 2 (WFPC2) and the Near Infrared Camera and Multi-Object Spectrometer (NICMOS) on board the Hubble Space Telescope (HST), to study the nuclear regions of this galaxy. This paper is organised as follows: Sect. 2 presents the observations and the data reduction; Sect. 3 shows the results; and Sect. 4 contains a brief discussion of the nature of the observed nuclear structures.
Throughout this paper, we will use a distance to M 104 of 8.8 Mpc (Ciardullo et al. Ciar93 (1993)), yielding an intrinsic scale of 43 pc.arcsec-1. We will also use a systemic (heliocentric) velocity of 1080 km s-1, infered from the two-dimensional stellar velocity field (Emsellem et al. Ems96 (1996), hereafter Paper 2), and a value of 84° (°) for the inclination of the galaxy (Paper 2).
2 Observations and data reduction
2.1 HST/WFPC2 and NICMOS imaging
From the Space Telescope/European Coordinating Facility (ST/ECF) archive at the European Southern Observatory, we have retrieved WFPC2 and NICMOS images of M 104 in four bands: F547M, F658N, F814W, and F160W. Their total integration times were 1340, 1120, 1600, and 128 seconds, respectively. The data reduction was performed using the ST/ECF pipeline, with the most recent calibration data.
The images were flux calibrated, rotated to the cardinal orientation (north up, east to the left), and corrected for geometric distorsion. An emission-line image ([N ii]+H) has been constructed by subtracting the F814W image from the on-band F658N image. Colour maps, similar to and , were also constructed, using the F547M, F814W and F160W images111The map has already been presented by Pogge et al. (Pogge99 (1999)) and Kormendy et al. (Korm96 (1996)). Note that in Kormendy et al. (Korm96 (1996)), the FOS apertures in their Fig. 1 are on the wrong side (east and west are reversed)..
2.2 TIGER spectrography
We obtained a total of 1.5 hour integration on the centre of M 104 using the TIGER 3D spectrograph (Bacon et al. Bacon95 (1995)) at the Canada France Hawaii telescope, in April 1996. The spectral domain (6750/460 Å) includes the [N ii]6548,6583, H and [S ii]6717,6731 emission lines. The spectral sampling was 1.5 Å per pixel, with a spectral resolution of 3.5 Å FWHM. The data reduction was performed using a dedicated software (Rousset Rousset92 (1992)). The spatial sampling was per lens, with a (seeing limited) spatial resolution of . Subtraction of the stellar continuum was achieved via a library of stellar and galactic spectra using a procedure which will be detailed in a forthcoming paper (Emsellem et al. in preparation).
To improve the spatial resolution of this data set, we have used a Richardson-Lucy algorithm (Richardson 1972; Lucy 1974) to deconvolve each velocity slice of our continuum subtracted data cube. The point-spread function used in this deconvolution was obtained by comparing the emission-line image derived from the TIGER data cube and the HST emission-line image. We limited the number of iterations to 40 and the spatial resolution after deconvolution is , with a new spatial sampling of per pixel.
The emission lines present in our spectra have been fitted using the FIT/SPEC software (Rousset Rousset92 (1992)) to reconstruct maps of the ionised gas distribution and kinematics. Except when explicitely mentioned, we only present results obtained by fitting a single Gaussian profile for each individual emission line, with all lines constrained to share the same velocity shift and width. Excellent fits were obtained, even for the nuclear emission-line profiles, despite their extended wings (e.g. see Fig. 3 in Kormendy et al. Korm96 (1996), hereafter K+96).
3 Results
3.1 Ionised gas distribution and kinematics
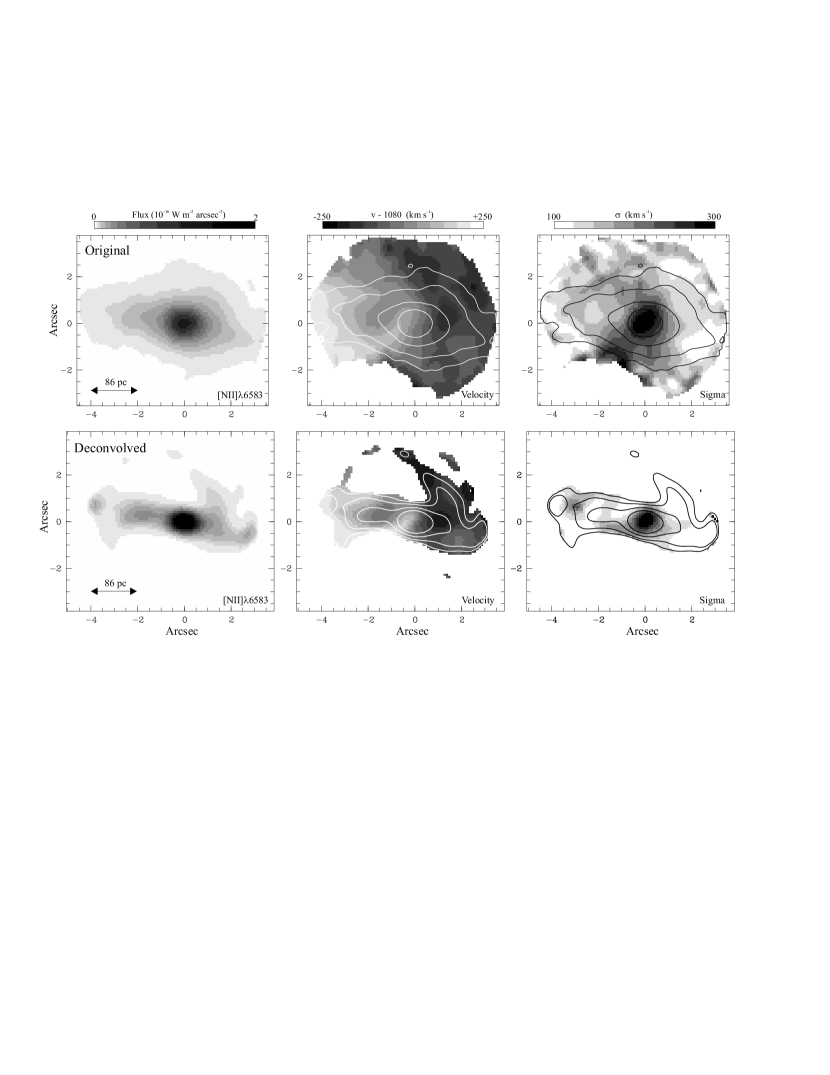
In Fig. 1, we present maps of the [N ii]6583 line intensity, centroid velocity and velocity dispersion (the latters being common to all fitted lines). The centre of the field has been defined as the location of the maximum line intensity, which coincides for all observed lines. The ionised gas distribution derived from our deconvolved data cube agrees with that obtained in the HST [N ii]+H image (Pogge et al. Pogge99 (1999)), and exhibits three prominent features: a bright core, two roughly symmetric spiral-like structures, and a curved extension northwest of the nucleus.

The spiral structures harbor velocities significantly lower than the circular velocities predicted by the multi-Gaussian expansion model of M 104 (Paper 2). Similar behavior has been noticed for gas between 10 and 50″ from the nucleus (Rubin et al. Rubin85 (1985)), as well as in nuclear FOS spectra (K+96). A cut of the velocity map along the major axis of the galaxy (Fig. 2), shows the presence of a strong velocity gradient close to the nucleus, with extrema of and km s-1, located (18 pc) east and (48 pc) west of the centre, respectively. These extrema are followed by an abrupt decrease of the velocity modulus, which reaches minima (60 pc) east and (100 pc) west of the nucleus, before increasing again. The kinematics of the ionised gas inside 1″ (43 pc) is thus decoupled from that of the gas in the spiral arms. This decoupling is also present in the datacube before deconvolution. After deconvolution, the velocity gradient in the central arcsecond is larger on the eastern side than on the western side.
The velocity dispersion is centrally peaked, reaching a value of 380 km s-1 in the deconvolved data. From their high spatial resolution FOS data, Nicholson et al. (Nich98 (1998)) obtained larger central velocity dispersions, of 540 and 390 km s-1 for [N ii] and H, respectively. However, this discrepancy can easily be accounted for by the difference in spatial resolution and the fact that we did not attempt to model the [N ii] and H lines separately. Note also that the central velocity dispersion for the gas in our deconvolved data is similar to the stellar one from K+96 (FOS data).
3.2 Colour map and dust distribution
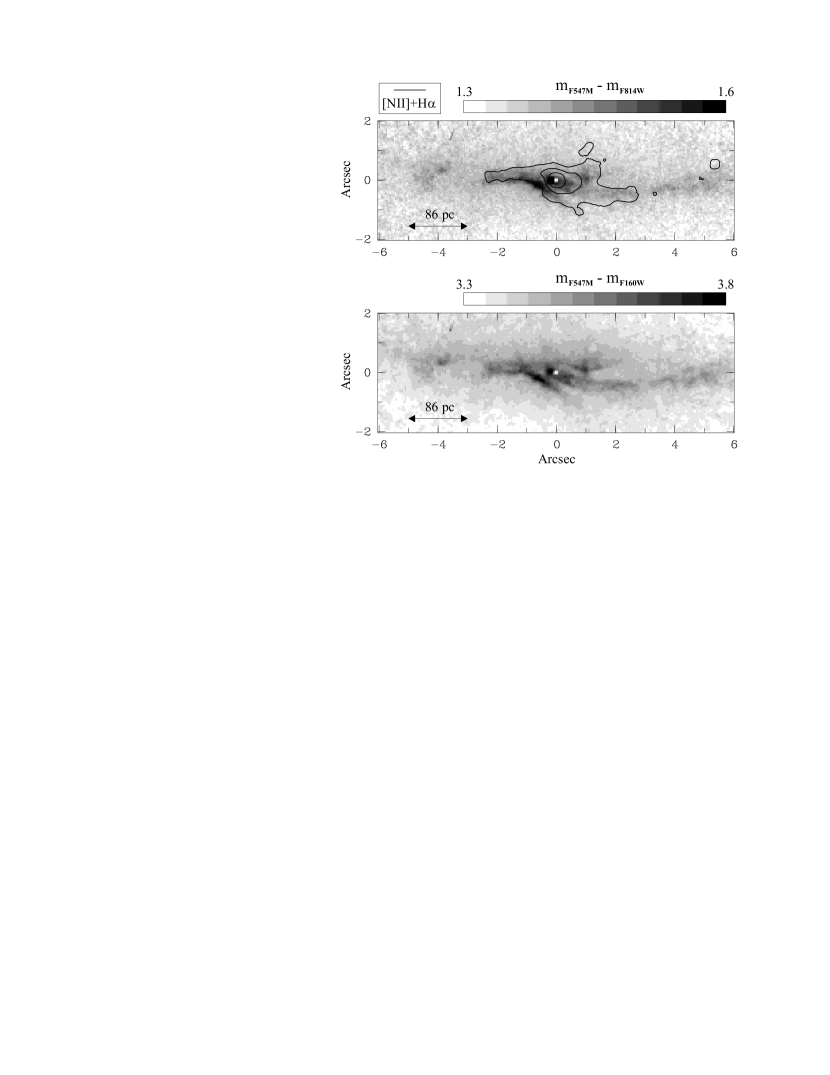
The colour maps (Fig. 3) outline the (patchy) dust structures present in the central region of M 104. As already pointed out in Paper 1, there is a straight-line dust lane southeast of the nucleus. It has a projected length ( pc). Taking a minimum inclination of 82° for the galaxy and assuming that this dust lane lies in the equatorial plane of the galaxy, this yields a deprojected length pc. The associated reaches 0.2 mag, corresponding to an apparent AV 0.5 mag (for ). Especially in the colour map (Fig. 3, bottom panel), there is a hint for the existence of a symmetric, though much fainter, extinction feature on the northern side of the nucleus.
Last, the nucleus of the galaxy appears extremely blue (local difference of 0.3 mag) compared to its surroundings. It is unlikely that this feature is an artifact222We checked that it is still present after harmonisation of the spatial resolutions in the F547M, F814W, and F160W images., as already mentioned in K+96.
4 Discussion
Recently, Regan & Mulchaey (Regan99 (1999)) argued that nuclear bars may not be the primary agent for the fueling of active galactic nuclei (AGN) and suggested nuclear spirals as an alternative mechanism. Martini & Pogge (MP99 (1999)) also analysed visible and near-infrared HST images of a sample of 24 Seyfert 2 galaxies and found that 20 of these exhibit nuclear spirals (with only 5 clear nuclear bars). Physical processes involved in the formation of such spirals are not clear yet, although acoustic instabilities have often been mentioned as a possible mechanism in non self-gravitating nuclear discs (Montenegro et al. MYE99 (1999), Elmegreen et al. Elm+98 (1998), and references therein). In M 104 (classified as a liner), kiloparsec-scale spiral arms are indeed present but a straight dust lane is also found closer to the nucleus: it is a specific signature of strong bars with inner Lindblad resonance (Athanassoula Lia92 (1992)). If it actually traces a nuclear bar, this dust lane should have a symmetric counterpart on the other side of the nucleus. There is indeed a hint for such a feature (see Sect. 3.2) but it is rather weak. However, this weakness could be attributed to the fact that this second dust lane would be located on the far (north) side of the galaxy.
To test this hypothesis, we computed the effect of the presence of two symmetric dust filaments using the luminosity density model of M 104 of Emsellem (Ems95 (1995), Paper 1 hereafter). We assumed the filaments to be in the equatorial plane of the galaxy (10° from end-on), and their characteristics were set to ensure that the mean extinction for the southern filament was consistent with the observations. The model predicts that the apparent extinction should rapidly decrease northward, with apparent mag or , north of the nucleus (for ). These are upper limits since dust scattering and clumpiness would tend to significantly reduce these values. For these extinction levels, we indeed expect the northern filament to be barely detectable in our colour maps.
The observed kinematics would also fit naturally into the strong nuclear bar picture. The fact that overall the velocities are small compared to the predicted circular velocities, obviously argue for the presence of strongly non-circular motions. The velocity profile in the spiral features could be explained by the combination of the streaming motions and projection effects as the spiral curves around the nucleus and becomes perpendicular to the line-of-sight. If the nuclear bar hypothesis is correct, the existence of offset straight dust lanes also requires the presence of an inner Linblad resonance (ILR), and an extended orbit family (e.g. Athanassoula & Bureau Lia99 (1999), hereafter AthB99). This would explain the observed kinematical decoupling between the gas in the nucleus and in the spiral arms, as clearly illustrated in the models of AthB99. The observed asymmetry in the central velocity gradients agrees also qualitatively with the predictions made by AthB99, when dust is included (see their Fig. 10 with e.g. °). We should however keep in mind that significant differences exist between the gas distribution, as observed in the core of M 104, and as idealised in the model of AthB99.
The presence of a large-scale bar has already been suggested in Papers 1 and 2 (pattern speed of 120 km s-1 kpc-1 for a distance to M 104 of 8.8 Mpc). The mass model predicted a strong ILR for this primary bar, located roughly 20″ from the nucleus. The secondary nuclear bar discussed in this letter would then be well inside this resonance. From the extension and orientation of the central dust lanes, we can roughly estimate a semi-major axis of pc (10″), and an orientation of approximately 10° from end-on333See Gerhard Ger89 (1989) for this bar. The location of the corotation can be estimated from the relation (AthB99, is the Lagrangian radius), yielding a value of 12″. This is right where the transition region between the inner and outer disks occurs (Seifert & Scorza Seifert96 (1996)). More detailed modelling is needed to accurately estimate its pattern speed.
If there are clearly some hints of the presence of a nuclear bar in M 104, as discussed above, it is also clear that additional information are needed to confirm or infirm its existence. In particular, the main support for the nuclear bar scenario comes from the presence of the straight, southern dust filament, which could actually be much further from the nucleus than we assumed (e.g. if it is outside the equatorial plane of the galaxy). In the same way, the kinematical decoupling of the central regions could alternatively be due to, e.g. a nuclear keplerian disk. The answer to this should come soon, from HST/STIS observations of M 104. These high spatial resolution data will allow detailed comparison between the observed PVDs and the gaseous kinematics predicted by various models (nuclear bar, keplerian disk). Emission lines in the infrared, where dust is less problematic, could also be very valuable to understand the gas distribution and kinematics in more details.
Acknowledgements.
PF acknowledges support by the Région Rhône-Alpes under an Emergence fellowship.References
- (1) Athanassoula, E., 1992, MNRAS 259, 345
- (2) Athanassoula, E., Bureau, M., 1999, ApJ 522, 699 (AthB99)
- (3) Bacon, R., et al., 1995, A&AS 113, 347
- (4) Ciardullo, R., Jacoby, G. H., Tonry, J. L., 1993, ApJ 419, 479
- (5) Elmegreen, B. G., Elmergreen, D. M., Brinks, E., Yuan, C., Kaufman, M., Klarić, M., Montenegro, L., Struck, C., Thomasson, M., 1998, ApJL 503, 119
- (6) Emsellem, E., 1995, A&A 303, 673 (Paper 1)
- (7) Emsellem E., Bacon R., Monnet G., Poulain P., 1996, A&A 312, 777 (Paper 2)
- (8) Gerhard, O., 1989, in the Proc. of Dynamics of dense stellar systems, Toronto, Cambridge Univ. Press, 61
- (9) Kormendy, J., Bender, R., Ajhar, A. et al., 1996, ApJ 473, 91 (K+96)
- (10) Lucy, L. B., 1974, AJ 79, 745
- (11) Martini, P., Pogge, R. W., 1999, AJ 118, 2646, in press
- (12) Montenegro, L. E., Yuan, C., Elmegreen, B. G., 1999, ApJ 520, 592
- (13) Nicholson K. L., Reichert, G. A., Mason, K. O. et al., 1998, MNRAS 300, 893
- (14) Pogge, R. W., Maoz, D., Ho, L. C., Eracleous, M., 1999, ApJ 532, in press
- (15) Regan, R. W., Mulchaey, J. S., 1999, AJ 117, 2676
- (16) Rubin, V. C., Burstein, D., Ford, W. K., Jr., Thonnard, N, 1985, ApJ 289, 81
- (17) Richardson, W.H., 1972, J. Opt. Soc. Am. 62, 55
- (18) Rousset, A., 1992, PhD Thesis, Univ. de Saint-Etienne
- (19) Seifert, W., & Scorza, C., 1996, A&A 310, 75