Galactic Contamination in the QMAP Experiment
Abstract
We quantify the level of foreground contamination in the QMAP Cosmic Microwave Background (CMB) data with two objectives: (a) measuring the level to which the QMAP power spectrum measurements need to be corrected for foregrounds and (b) using this data set to further refine current foreground models. We cross-correlate the QMAP data with a variety of foreground templates. The 30 GHz Ka-band data is found to be significantly correlated with the Haslam 408 MHz and Reich and Reich 1420 MHz synchrotron maps, but not with the Diffuse Infrared Background Experiment (DIRBE) 240, 140 and 100m maps or the Wisconsin H-Alpha Mapper (WHAM) survey. The 40 GHz Q-band has no significant template correlations. We discuss the constraints that this places on synchrotron, free-free and dust emission. We also reanalyze the foreground-cleaned Ka-band data and find that the two band power measurements are lowered by 2.3% and 1.3%, respectively.
Subject headings:
cosmic microwave background – diffuse radiation – radiation mechanisms: thermal and non-thermal – methods: data analysis1. INTRODUCTION
Quantifying Galactic emission in a cosmic microwave background (CMB) map is interesting for two different reasons. On one hand, the CMB is known to be a gold mine of information about cosmological parameters. Taking full advantage of this requires accurate modeling and subtraction of Galactic foreground contamination. On the other hand, the high fidelity maps being produced as part of the current CMB gold rush offer a unique opportunity for secondary non-CMB science. This includes a greatly improved understanding of Galactic emission processes between 10 and GHz.
This paper is motivated by both of these reasons. The QMAP experiment (Devlin et al. 1998; Herbig et al. 1998; de Oliveira-Costa et al. 1998b, hereafter dOC98b) is one of the CMB experiments that has produced a sky map with accurately modeled noise properties, lending itself to a cross-correlation analysis with a variety of foreground templates. We present such an analysis in §2 and §3, then compute the corresponding correction to the published QMAP power spectrum measurements in §4 and finish by discussing the implications for Galactic foreground modeling in §5.
2. METHOD
The multi-component fitting method that we use was presented in detail in de Oliveira-Costa et al. 1999 (hereafter dOC99), so we review it only briefly here. The joint QMAP map from both flights consists of (Ka-band, 26 to 36 GHz) and (Q-band, 36-46 GHz) measured sky temperatures (pixels) . We model this map as a sum of CMB fluctuations , detector noise and Galactic components whose spatial distributions are traced in part by external foreground templates. Writing these contributions as -dimensional vectors, we obtain
| (1) |
where is an matrix whose rows contain the various foreground templates convolved with the QMAP beam (i.e., would be the observation if the sky had looked like the foreground template), and is a vector of size that gives the levels at which these foreground templates are present in the QMAP data.
We treat and as uncorrelated random vectors with zero mean and the matrix as constant, so the data covariance matrix is given by
| (2) |
where
| (3) |
is the CMB covariance matrix and is the QMAP noise covariance matrix (a detailed description of the calculation of is presented in dOC98b). We use a flat power spectrum normalized to a K (dOC98b). We model the QMAP beam as a Fisher function with FWHM for Ka-band and for Q-band, which gives a .
Since our goal is to measure , both and act as unwanted noise in equation (1). Minimizing yields the minimum-variance estimate of ,
| (4) |
with covariance matrix
| (5) |
The error bars on individual correlations are therefore . This includes the effect of chance alignments between the CMB and the various template maps, since the CMB anisotropy term is incorporated in .
3. BASIC RESULTS
We cross-correlate the QMAP data with two different synchrotron templates: the 408 MHz survey (Haslam et al. 1982) and the 1420 MHz survey (Reich 1982; Reich and Reich 1986), hereafter Has and R&R, respectively. To study dust and/or free-free emission, we cross-correlate the QMAP data with three Diffuse Infrared Background Experiment (DIRBE) sky maps at wavelengths 100, 140 and 240 (Boggess et al. 1992) and with the Wisconsin H-Alpha Mapper (WHAM)666 Details also at http://www.astro.wisc.edu/wham/. survey (Haffner et al. 1999). For definiteness, we use the DIRBE 100 channel when placing limits below since it is the least noisy of the three DIRBE channels. Three of our templates are shown together with the Ka-band QMAP map in Figure 1. Most of our interesting results come from the QMAP Ka-band, since the Q-band was substantially noisier (the opposite was true for the Saskatoon experiment – see de Oliveira-Costa et al. 1997, hereafter dOC97).
Before calculating the correlations, we convolve the template maps with the QMAP beam function. We also remove the monopole and dipole from both the templates and the QMAP maps. As a consequence, our results depend predominantly on the small scale intensity variations in the templates and are insensitive to the zero levels of the QMAP data and the templates.
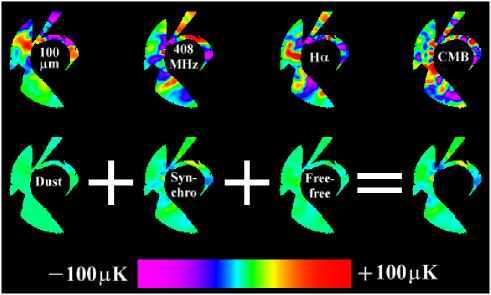
Table 1 shows the coefficients and the corresponding fluctuations in antenna temperature in the QMAP data (, where is the standard deviation of the template map). Statistically significant () correlations are listed in boldface. Note that the fits are done jointly for templates. The DIRBE, Haslam and correlations listed in Table 1 correspond to joint 100Has fits, whereas the R&R numbers correspond to a joint 100R&R fit. Only the two synchrotron templates are found to be correlated with the Ka-band, while no correlations are found for the Q-band. Repeating the analysis done for two different Galactic cuts (20∘ and 30∘) indicates that the bulk of this contamination is at latitudes lower than 30∘.
| & | Maps(a) | [K](d) | ||||
|---|---|---|---|---|---|---|
| All Sky | 100m | -3.5 6.9 | -0.5 | 3.1 | -10.821.4 | |
| Ka-band | Has | 6.6 2.6 | 2.5 | 4.3 | 28.411.2 | -2.8 |
| R&R | 0.3 0.1 | 2.6 | 141.4 | 42.414.1 | -2.6 | |
| 14.6 9.5 | 1.5 | 1.0 | 14.6 9.5 | |||
| All Sky | 100m | -1.7 5.4 | -0.3 | 3.9 | -6.721.4 | |
| Q-band | Has | 0.7 2.8 | 0.2 | 6.1 | 4.217.2 | -2.7 |
| R&R | -0.05 0.09 | -0.6 | 182.3 | -9.416.3 | -3.0 | |
| -6.0 11.2 | -0.5 | 1.1 | -6.311.8 | |||
| Has | 6.1 2.7 | 2.3 | 2.2 | 13.9 6.2 | -2.8 | |
| Ka-band | R&R | 0.3 0.1 | 2.2 | 82.5 | 24.010.9 | -2.7 |
| Has | 4.1 5.2 | 0.8 | 1.4 | 5.8 7.4 | -2.9 | |
| Ka-band | R&R | 0.4 0.3 | 1.2 | 28.6 | 10.5 8.9 | -2.6 |
(a) The DIRBE and Haslam correlations listed in this table
correspond to joint 100Has fits, whereas
the R&R numbers correspond to a joint 100R&R
fit;
(b) has units K(MJy/sr)-1 for the 100m
template, K/K for the Has template, K/mK for
the R&R template and K/R for the template;
(c) has units of the templates;
(d) .
As in dOC97, de Oliveira-Costa et al. 1998a (hereafter dOC98a) and dOC99, the cross-correlation software was tested by analyzing constrained realizations of CMB and QMAP instrument noise. From 1000 realizations, we recovered unbiased estimates with a variance in excellent agreement with equation (5). As an additional test, we computed and obtained in all cases. Including a synchrotron template lowered by a significant amount (18 for R&R and 9 for Has), whereas adding the other templates resulted in insignificant reductions .
4. IMPLICATIONS FOR CMB
The lower right map in Figure 1 shows , i.e., our best fit estimate of the foreground contribution to the QMAP Ka-band. To quantify the foreground contribution to the published QMAP power spectrum measurements, we repeat the exact same analysis described in dOC98b after subtracting out this map, i.e., with the map replaced by .
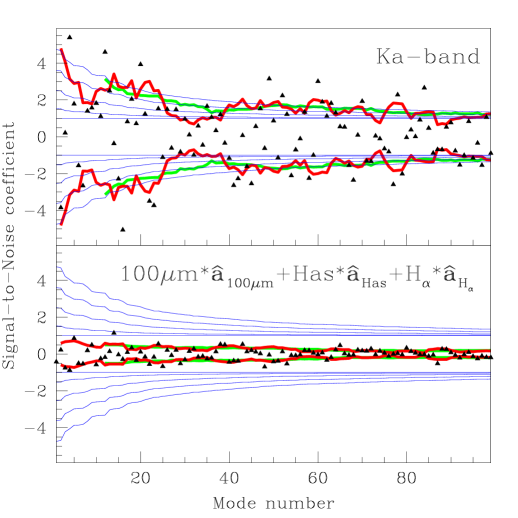
The dOC98b band powers were computed by expanding the map in signal-to-noise () eigenmodes (Bond 1995; Bunn and Sugiyama 1995), weight vectors that solve the generalized eigenvalue equation
| (6) |
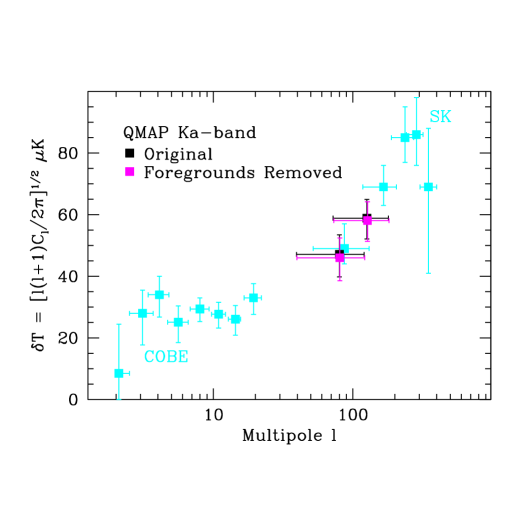
When the ’s are sorted by decreasing eigenvalue , they tend to probe from larger to smaller angular scales. The expansion coefficients are shown in Figure 2, and are seen to be substantially smaller for the foregrounds than for the CMB. As described in dOC98b, we obtain a statistically independent power estimate from the square of each mode and then average these individual estimates with inverse-variance weighting to obtain the band power estimates listed in Table 2 and shown in Figure 3. The Ka-band (30 GHz) band powers are seen to drop by less than a few percent when the foreground signal is subtracted, whereas the Q-band (40 GHz) contamination is too small to quantify. The Ka-band correction is slightly smaller on small angular scales: 1.3% instead of 2.3%. This is expected, since diffuse Galactic foregrounds are expected to have a redder power spectrum than the CMB.
As a side benefit, our statistically significant detection of foregrounds allowed an independent confirmation of the QMAP pointing solution. We reanalyzed the QMAP data set with the pointing solution offset by in azimuth, and found the highest correlations for the original pointing.
| Flight | Band | before | after | ||
|---|---|---|---|---|---|
| 1+2 | Ka | 81 | 41 | 47 | 46 |
| 1+2 | Ka | 127 | 55 | 59 | 58 |
5. IMPLICATIONS FOR FOREGROUND MODELING
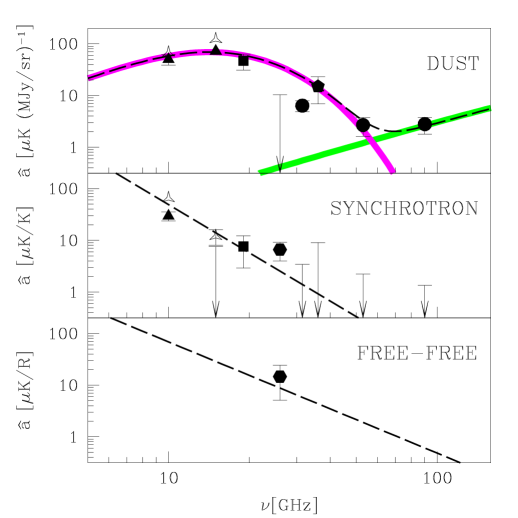
Figure 4 shows a compilation of measured correlations between foreground templates and CMB maps at various frequencies. Comparisons are complicated by the fact that the foreground level depends strongly on galactic latitude via . We therefore plot instead, i.e., the factor giving the frequency dependence of emission per unit foreground. Such measurements were used to normalize recent foreground models such as those of Bouchet & Gispert (1999) and Tegmark et al. (1999). Below we discuss how our QMAP results affect such models.
5.1. Synchrotron
Writing the frequency dependence as and recalling that the correlation coefficients are, by definition, KK for Has at 408 MHz and mKK for R&R at 1420 MHz, we obtain the spectral index limits for the Ka–Has correlation and for the Ka–R&R correlation. These values are slightly steeper than the canonical sub-GHz slope of (Davies et al. 1998; Platania et al. 1998), but consistent with a steepening of the spectrum of cosmic ray electrons at higher energies (Rybicki and Lightman 1979).
The relatively high QMAP synchrotron signal seen in Figure 4 could be interpreted as slight spatial variability of the frequency dependence (Tegmark 1999), but may also have other explanations. For instance, the worst striping problems in the Haslam map are right around the North Celestial Pole, which may have caused Saskatoon to underestimate the true synchrotron level there (dOC97).
5.2. Spinning dust & free-free emission
An important question is whether the DIRBE-correlated signal seen by so many experiments (see Figure 4, top) is due to dust-correlated free-free emission (Kogut et al. 1996) or spinning dust grains (Draine & Lazarian 1998). The turndown at low frequencies suggests a spinning dust interpretation (dOC99), but an analysis using improved Tenerife data (Mukherjee et al. 2000) may have re-opened this question777 As seen in Figure 4, the Mukherjee et al. results for also shown a turndown between 15 and 10 GHz. Figure 7 in their paper looks different because it is an average including data down to . This may still be consistent with spinning dust being the worst foreground for the (Galaxy cut) MAP data, since free-free emission is believed to be more concentrated in the Galactic plane than dust. . Our present results cannot settle the issue, but offer a few additional clues.
If free-free emission is responsible for the correlation, then substantial emission would be expected as well. Figure 4 (bottom) shows the expected correlation for the case of K gas (Bennett et al. 1992). It is seen that the -correlation, although marginal at best, is consistent with the theoretical curve. Moreover, Table 1 shows that the limit on the dust-correlated emission is low enough to be compatible with a free-free origin (i.e., with the K -correlated component).
To clarify this issue, we computed the correlation between the dust and maps. As described in dOC99, eq. (5) shows that we can interpret as the covariance between the various templates with dimensionless correlation coefficients . Like in dOC99, the DIRBE maps were found to be almost perfectly correlated, and essentially uncorrelated () with the radio maps. The Has and R&R maps are correlated with for . As a new result, we obtain a marginal correlation between the DIRBE maps and the template. Since the statistical properties of these maps are not accurately known, we computed error bars by repeating the analysis with one of the templates replaced by transformed maps, rotated around the Galactic axis by multiples of 5∘ and/or flipped vertically and/or horizontally. The actual correlation was found to be larger than 85% of these, showing that the correlation is not significant at the level: R/MJy sr-1 . This result is significantly smaller than that recently found by Lagache et al. (2000) for their DIRBE–WHAM correlation done in a different region of the sky, but compatible with other marginal dust– correlations (McCullough 1997; Kogut 1997).
This poor correlation is a challenge for the pure free-free hypothesis, which maintains that microwave emission traces dust because dust traces free-free emission. A cross-correlation analysis with large frequency and sky coverage will hopefully be able to unambiguously determine the relative levels of free-free and dust emission in the near future.
We would like to thank Matias Zaldarriaga for encouraging us to complete it. Support for this work was provided by the Packard Foundation, NSF grants PHY 92-22952 & PHY 96-00015, and NASA grant NAG5-6034. We acknowledge the NASA office of Space Sciences, the COBE flight team, and all those who helped process and analyze the DIRBE data.
REFERENCES
Bennett, C.L., Smoot, G.F., Hinshaw, et al. 1992, ApJ, 396, L7
Boggess, N.W., et al. 1992, ApJ, 397, 420
Bond, J.R. 1995, Phys.Rev.Lett., 74, 4369
Bunn, E.F., Sugiyama, N., 1995, ApJ, 446, L49-52
Fran ois R. Bouchet, F.R., and Gispert, R. 1999 astro-ph/9903176
Davies R.D., Watson, R.A., and Gutierrez, C.M. 1998, MNRAS, 278, 925
de Oliveira-Costa, A., et al. 1997, ApJ, 482, L17 (dOC97)
de Oliveira-Costa, A., et al. 1998a, ApJ, 509, L9 (dOC98a)
de Oliveira-Costa, A., et al. 1998b, ApJ, 509, L77 (dOC98b)
de Oliveira-Costa, A., et al. 1999, ApJ, 527, L9 (dOC99)
Devlin, M. et al. 1998, ApJL, 509, L69
Draine, B.T., and Lazarian, A. 1998, ApJ, 494, L19
Haffner, L.M. et al. 1999, ApJ, 523, 223
Haslam, C.G.T., et al. 1982, A&AS 47, 1
Herbig, T. et al. 1998, ApJL, 509, L73
Kogut, A. 1997, AJ, 114, 1127
Kogut, A., et al. 1996, ApJ, 464, L5
Lagache, G. et al. 2000, astro-ph/9911355
McCullough, P.R. 1997, AJ, 113, 2186
Mukherjee, P. et al. 2000, astro-ph/0002305
Platania, P., et al. 1998, ApJ, 505, 473
Reich, W. 1982, A&AS, 48, 219
Reich, P., and Reich, W. 1986, A&AS, 63, 205
Rybicki, G. B. and Lightman, A. P. 1979, Radiative Processes in Astrophysics, Wiley & Sons, p.174
Tegmark, M. et al. 1999, astro-ph/9905257