Redshifts of CLASS Radio Sources
Abstract
Spectroscopic observations of a sample of 42 flat-spectrum radio sources from the Cosmic Lens All-Sky Survey (CLASS) have yielded a mean redshift of with an RMS spread of , at a completeness level of . The sample consists of sources with a 5-GHz flux density of mJy, making it the faintest flat-spectrum radio sample for which the redshift distribution has been studied. The spectra, obtained with the Willam Herschel Telescope (WHT), consist mainly of broad-line quasars at and narrow-line galaxies at . Though the mean redshift of flat-spectrum radio sources exhibits little variation over more than two orders of magnitude in radio flux density, there is evidence for a decreasing fraction of quasars at weaker flux levels. In this paper we present the results of our spectroscopic observations, and discuss the implications for constraining cosmological parameters with statistical analyses of the CLASS survey.
keywords:
cosmology: gravitational lensing1 Introduction
The number of gravitational lens systems found in systematic surveys provides a strong constraint on cosmological models, especially those with a cosmological constant (Kochanek 1996a; Falco, Kochanek and Muñoz 1998, hereafter FKM; Helbig et al. 1999). Statistical analyses of lens surveys currently give a 2 upper limit on the cosmological constant in flat models (+=1) of (FKM). These constraints are consistent with those obtained from Type Ia supernovae (eg. Perlmutter et al. 1999).
Conducting a lens survey at radio frequencies has several advantages. Most importantly, radio lens searches do not suffer from the observational biases that plague optical surveys, particularly those due to dust extinction in the lensing galaxy. In addition, a survey of compact radio sources with the Very Large Array (VLA) provides maps with consistently high resolution () and dynamic range (), allowing lens systems with even large component flux density ratios () to be easily identified in most snapshot observations. The short integration time required for such sources ( seconds) means that large samples can be mapped in any given observing run.
The drawback of radio lens surveys is that they are conducted in flux density ranges where there is little information on the source redshift distribution. Complete redshift surveys of radio sources exist only for those with 300 mJy (eg. the CJ samples, Henstock et al. 1997; and the Parkes Half-Jansky Flat-Spectrum Survey (PHFS), Drinkwater et al. 1997). The Cosmic Lens All-Sky Survey (CLASS; Myers et al. 2000), the largest and most successful lens survey to date, has a flux density limit of mJy. Kochanek (1996b) showed that a lack of redshift information at these flux levels will lead to serious systematic uncertainties in the derived cosmological constraints. FKM attempted to address this problem with three samples of flat-spectrum radio sources selected from the MIT-Greenbank Survey (Stern et al. 1999) and the Jodrell-VLA Astrometric Survey (JVAS; Patnaik et al. 1992; Browne et al. 1998; Wilkinson et al. 1998; King et al. 1999). The 5-GHz flux density ranges of these samples were , and mJy, respectively. They found a mean source redshift of , with a decreasing fraction of identified quasars at weaker flux levels, falling to less than of sources at 100 mJy.
To extend the spectroscopic study of flat-spectrum radio sources to even weaker flux densities, a program of redshift determination for a small sample of CLASS sources was undertaken. The aim was to obtain information on the redshift distribution of the unlensed sources in CLASS. The same source population comprises the “parent” sample of lensed sources in the JVAS survey. This paper describes the selection and observation of the CLASS optical sample and discusses some preliminary results.
2 Sample Selection
The selection of the CLASS spectroscopic sample was made from the GB6 5-GHz radio survey (Gregory et al. 1996). Those sources within the flux density range 25 mJy 50 mJy in the sky regions , and , (B1950.0) were selected. To restrict the sample solely to flat-spectrum sources, the Westerbork Northern Sky Survey (WENSS; Rengelink et al. 1997) at 327 MHz was used to determine two-point spectral indices for the GB6-selected sample. Due to the size of the GB6 beam () compared to that of WENSS (), the correlation was limited to those sources within two arcminutes of the GB6 pointing position. Sources with two-point spectral indices between 327 MHz and 5 GHz of (where ) were selected. In addition, those sources detected in the GB6 survey but not in the WENSS survey were included in the sample, since they are likely to have inverted spectra that decrease rapidly towards lower frequencies, and therefore fall below the WENSS 327-MHz limiting flux density of 18 mJy.
Only those sources that had previously been observed and detected in the CLASS VLA observations of 1994 and 1995 were selected for the final sample. By including this restriction in the sample definition, accurate VLA radio positions could be used to identify the sources on the Palomar Sky Survey (POSS). The result of this selection process was a sample of 42 radio sources from CLASS.
3 Observations
Observations were carried out with the William Herschel Telescope (WHT) at La Palma and the ISIS Spectrograph. The ISIS detector uses a pixel CCD, with a 24m pixel size. The ISIS R158 red and blue gratings were used, dispersing light into red and blue orders covering the wavelength range from 3000–10000Å. The observations took place over four nights from 1997 August 2–5. A total of 40 CLASS objects were observed. The remaining two objects (0157+41 and 1715+57) were identified with bright galaxies that had previously determined redshifts in the literature.
Each source was observed for 200–600 seconds over the first two nights. The fainter sources for which no emission lines were readily detected were followed up during the next two nights with integrations of up to 5400 seconds. The slit width used varied from to depending on the observing conditions. Overall the weather was very good with little dust or cloud cover, and an average seeing of . The majority of the targets were visible on the finder-TV, and were identified using bright nearby objects on finding charts generated from POSS. However, approximately one-third of the sources were not visible and had to be located by “blind offsetting”, which resulted in a detection rate of . Misidentifications due to crowding are negligible.
4 Data Reduction and Analysis
The data were analyzed with the IRAF111 IRAF is distributed by the National Optical Astronomy Observatories, which are operated by the Association of Universities for Research in Astronomy Inc. under cooperative agreement with the National Science Foundation. data reduction package. First the bias level was removed from the data frames using the overscan region of the chip and bias frames. Flat-fielding was then performed. The curvature of the two-dimensional data frames was traced, and the one-dimensional spectra were extracted.
The extracted spectra were wavelength-calibrated using a single Cu-Ne/Cu-Ar arc for each of the two wavelength orders. The arcs were selected from the end of each observing run, to minimize the effects of shifts in the wavelength scale. The spectra were flux-calibrated using observations of spectrophotometric standard stars (Oke and Gunn 1983). This was done by determining a sensitivity function relating counts to flux density as a function of wavelength, which was then applied to the spectra. An observation of BLLac was performed and the spectra were normalized by the featureless spectrum.
The flux-calibrated spectra were trimmed to remove the wavelength extremes where the sensitivity is low and hence where the spectra are noisy and badly calibrated. The two orders were then combined to give spectra covering the wavelength ranges 3300–6100Å and 6300–8300Å.
The majority of the sources show one or more emission or absorption lines. The remaining spectra which show no obvious lines can be divided into two categories: those that have insufficient signal-to-noise to show any reliable features, and those that have relatively good signal-to-noise but show no distinguishing lines and hence have BLLac-type spectra.
For the spectra with more than one identified line, the source redshift was determined from an unweighted mean of the redshifts of the individual lines. The error on the redshift was calculated from a combination of the mean errors from the Gaussian fitting procedure on the emission and absorption lines. In the few cases where only one line was identified, the redshift is simply the line redshift, and its error simply the error derived from the line fitting. In addition, a systematic uncertainty due to the wavelength calibration should be folded into the error on the redshift. This is of the order 5–10Å for the different spectra, which is roughly the same level of error associated with the fitting. This source of uncertainty has not been included in the quoted redshift errors.
5 Results
Table 1 lists the name, radio position, GB6 5-GHz flux density, total exposure time, redshift, spectral type (galaxy or quasar), and identified emission and absorption lines for each of the 42 sources in the CLASS sample. Plots of the individual spectra are available at the CERES homepage.222 http://www.jb.man.ac.uk/ceres1
Assuming all tentative redshifts to be correct, the CLASS sample has a mean redshift of and an RMS spread of 0.95, at a completeness level of . Fig. 1 shows the mean redshifts for a variety of samples of flat-spectrum radio sources, spanning more than two orders of magnitude in flux density. There appears to be little evidence for a decrease or increase in the mean redshift of such sources with decreasing radio flux.


The CLASS optical sample includes 19 quasars, 8 galaxies and 15 unidentified sources. Four of the unidentified sources were clearly detected and two were weakly detected in the red only. Fig. 2 shows a histogram of the redshifts obtained for the CLASS sample. The sources are strongly segregated into quasars with broad emission lines at and narrow-line galaxies at .
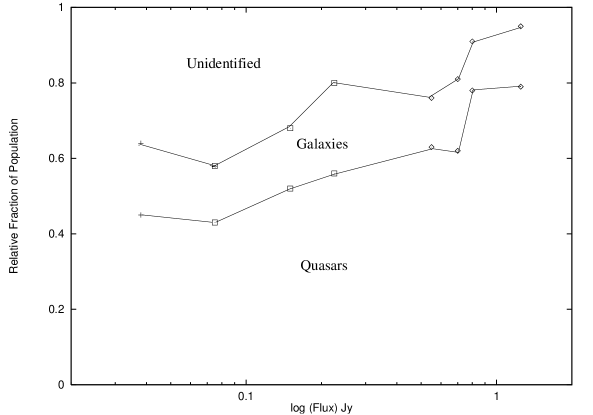
The relative fractions of quasars and galaxies in various flat-spectrum samples are plotted in Fig. 3. In the brightest samples, approximately of the sources are quasars. At the lower flux densities of the CLASS sample, quasars comprise less than of the sources. The fraction of identified low-redshift galaxies remains quite constant at from mJy to Jy. This may indicate that the unidentified sources at low flux densities are drawn from a different population than the identified galaxies, and are perhaps at a higher redshift. If this is the case, the six unidentified sources that were detected may have lines beyond the long wavelength cut-off of our spectra, while the remaining sources are just too faint to be detected at their redshifts.
Sources that are lensed into the CLASS survey come from an even fainter parent sample of flat-spectrum sources, typically in the 5–30 mJy range. If the above trends continue down into this regime, with fewer quasars and more galaxies, one would expect to see lensed extended emission from the host galaxies in CLASS lens systems. This is consistent with the detection of arcs in the optical and infrared images of several JVAS and CLASS lenses (MGJ0414+0534, Falco et al. 1997; B1359+154, Rusin et al. 2000; B1933+507, Marlow et al. 1999; B1938+666, King et al. 1998). Each of these lensed objects is at , which may bolster the argument that the unidentified sources in the CLASS optical sample are galaxies at high redshift.
6 Discussion
The number of gravitational lens systems found in a well-defined sample of sources can place strong limits on the cosmological constant. This is done by comparing the observed lensing rate with the predictions of various cosmologies. The optical depth for lensing depends both on the cosmological parameters and the redshifts of the sources being studied. Systematic uncertainties in the statistical analyses of radio lens surveys are therefore created by the paucity of data on the redshift distribution of unlensed sources fainter than 300 mJy.
Recently Helbig et al. (1999) analyzed the lensing rate in the JVAS statistical sample, which includes four lenses and approximately 2300 radio sources. At confidence, the lower and upper limits on in a flat universe are and , respectively. These results are consistent with other recent measurements of , both from lensing statistics and alternate cosmological probes such as Type Ia supernovae (Perlmutter et al. 1999). Helbig et al. assumed that the redshift distribution of the JVAS survey was identical to that of the CJ surveys, which were done at a higher flux density level. A similar assumption is harder to justify for CLASS, which searches for lensing among sources that are fainter than the CJ sample by more than an order of magnitude.
Future statistical analyses of CLASS require a determination of the redshift distribution of flat-spectrum radio sources down to the mJy level. Our current results only partially address this issue. The measured redshifts of the CLASS sources appear to be consistent with those of brighter radio samples (). However, the mean redshift may change once completeness is improved, and the nature of the currently unidentified sources is determined.
An underestimate of the mean redshift of the unlensed source population would lead to a overestimate of the cosmological constant, and vice versa. Consequently, the uncertainty in the redshift distribution of the CLASS sample permits large variations in the expected number of lenses for a given cosmological model. This is nicely illustrated by Kochanek (1996b). For radio luminosity functions constrained to produce four JVAS lenses, the mean redshift of a 50 mJy source varies from 0.4 for , to 1.9 for , to almost 4.0 for in a flat universe. Although these are extreme values, they underscore the importance of understanding the source redshift distribution when using the observed lensing rate as a probe of the cosmology.
At this time, the constraints on cosmological parameters from the radio and optical lens surveys (and other tests) appear consistent, suggesting that the observational uncertainties are not overwhelming. The CLASS survey, however, pushes down into a lower flux density regime in which very little is known about the source redshift distribution. Therefore, a reliable and complete spectroscopic study of flat-spectrum radio sources for the entire flux density range from 30–300 mJy must be obtained if CLASS is to fulfill its promise as a cosmological tool. To this end, a new program of spectroscopic observations is currently being undertaken by the CLASS/CERES collaboration at La Palma.
Acknowledgements.
We thank Emily Xanthopoulos for making the spectra available online. This research is based on observations made with William Herschel Telescope operated on the island of La Palma by the Isaac Newton Group in the Spanish Observatorio del Roque de los Muchachos of the Instituto de Astrofisica de Canarias. This research also made use of the NASA/IPAC Extragalactic Database (NED) which is operated by the Jet Propulsion Laboratory, Caltech, under contract with the National Aeronautics and Space Administration. The National Radio Astronomy Laboratory is a facility of the National Science Foundation operated under cooperative agreement by Associated Universities Inc. This research was supported in part by European Commission TMR Programme, Research Network Contract ERBFMRXCT96-0034 “CERES”.References
- [1] Browne, I.W.A., Wilkinson, P.N., Patnaik, A.R., Wrobel, J.M., 1998, MNRAS, 293, 257
- [2] Drinkwater, M.J., Webster, R.L., Francis, P.J., Condon, J.J., Ellison, S.L., Jauncey, D.L., Lovell, J., Peterson, B.A., Savage, A., 1997, MNRAS, 284, 85
- [3] Falco, E.E., Lehar, J., Shapiro, I.I., 1997, AJ, 113, 540
- [4] Falco, E.E., Kochanek, C.S., Muñoz, J.A., 1998, ApJ, 494, 47
- [5] Gregory, P.C., Scott, W.K., Douglas, K., Condon, J.J., 1996, ApJS, 103, 427
- [6] Helbig, P., Marlow, D., Quast, R., Wilkinson, P.N., Browne, I.W.A., Koopmans, L.V.E., 1999, A&AS, 136, 297
- [7] Henstock, D.R., Browne, I.W.A., Wilkinson, P.N., McMahon, R.G., 1997, MNRAS, 290, 380
- [8] King, L.J., Jackson, N., Blandford, R.D., Bremer, M.N., Browne, I.W.A., de Bruyn, A.G., Fassnacht, C.D., Koopmans, L., Marlow, D., Wilkinson, P.N., 1998, MNRAS, 295L, 41
- [9] King, L.J., Browne, I.W.A., Marlow, D.R., Patnaik, A.R., Wilkinson, P.N., 1999, MNRAS, 307, 225
- [10] Kochanek, C.S., 1996a, ApJ, 466, 638
- [11] Kochanek, C.S., 1996b, ApJ, 473, 595
- [12] Marlow, D.R., Browne, I.W.A., Jackson, N., Wilkinson, P.N., 1999, MNRAS, 305, 15
- [13] Myers, S.T., et al., 2000, AJ, in preparation
- [14] Oke, J.B., Gunn, J.E., 1983, ApJ, 266, 713
- [15] Patnaik, A.R., Browne, I.W.A., Wilkinson, P.N., Wrobel, J.M., 1992, MNRAS, 254, 655
- [16] Perlmutter, S. et al., 1999, ApJ, 517, 565
- [17] Rengelink, R.B., Tang, Y., de Bruyn, A.G., Miley, G.K., Bremer, M.N., Roettgering, H.J.A., Bremer, M.A.R., 1997, A&AS, 124, 259
- [18] Rusin, D., Hall, P.B., Nichol, R.C., Marlow, D.R., Richards, A.M.S., Myers, S.T., 2000, ApJL, in press (astro-ph/9911420)
- [19] Stern, D., Dey, A., Spinrad, H., Maxfield, L., Dickinson, M., Schlegel, D., Gonzalez, R.A., 1999, AJ, 117, 1122
- [20] Wilkinson, P.N., Browne, I.W.A., Patnaik, A.R., Wrobel, J.M., Sorathia, B., 1998, MNRAS, 300, 790
| Source | R.A. | Decl. | Flux | Integ. | Redshift | Q/G | Line ID |
|---|---|---|---|---|---|---|---|
| (J2000) | (J2000) | (mJy) | (s) | ||||
| (1) | (2) | (3) | (4) | (5) | (6) | (7) | (8) |
| 0103+43 | 01 03 28.08 | 43 22 59.5 | 41 | 1800 | – | – | Detected/ |
| Featureless | |||||||
| 0105+39 | 01 05 09.30 | 39 28 15.3 | 48 | 3000 | (0.083) | G? | [OII]? |
| H? | |||||||
| 0106+44 | 01 06 21.40 | 44 22 27.4 | 47 | 3600 | – | – | Featureless |
| 0123+3806 | 01 23 28.87 | 38 06 36.7 | 40 | 300 | 1.656 | Q | CIV |
| CIII] | |||||||
| MgII | |||||||
| 0123+3843 | 01 23 23.83 | 38 43 57.9 | 27 | 4800 | – | – | Detected in red/ |
| Featureless | |||||||
| 0128+40 | 01 28 13.64 | 40 03 29.9 | 47 | 1800 | 3.525 | Q | OVI? |
| Ly | |||||||
| NV | |||||||
| CIV | |||||||
| 0128+44 | 01 28 41.34 | 44 39 17.9 | 27 | 2700 | 0.228 | G | [OII] |
| H | |||||||
| [SII] | |||||||
| 0131+44 | 01 31 03.36 | 44 28 01.9 | 27 | 1200 | 1.123 | Q | CIII] |
| [NeIV]? | |||||||
| MgII | |||||||
| 0132+43 | 01 32 06.06 | 43 45 34.4 | 41 | 1200 | 1.812 | Q | Ly |
| CIV | |||||||
| CIII] | |||||||
| MgII | |||||||
| 0136+35 | 01 36 43.68 | 35 45 31.2 | 33 | 1800 | 1.871 | Q | Ly |
| NV? | |||||||
| SiIV | |||||||
| CIV | |||||||
| CIII] | |||||||
| CIII] | |||||||
| MgII |
| Source | R.A. | Decl. | Flux | Integ. | Redshift | G/Q | Line ID |
|---|---|---|---|---|---|---|---|
| (J2000) | (J2000) | (mJy) | (s) | ||||
| (1) | (2) | (3) | (4) | (5) | (6) | (7) | (8) |
| 0136+44 | 01 36 47.32 | 44 01 10.2 | 36 | 1200 | – | – | Featureless |
| 0137+39 | 01 37 45.14 | 39 41 36.1 | 38 | 3000 | (1.396) | Q? | CIII]? |
| [NeV]? | |||||||
| 0143+37 | 01 43 02.54 | 37 05 16.1 | 46 | 1000 | – | – | Featureless |
| 0151+43 | 01 51 18.38 | 43 32 00.5 | 34 | 1200 | 2.192 | Q | Ly |
| NV | |||||||
| SiIV | |||||||
| CIV | |||||||
| 0151+44 | 01 51 20.88 | 44 17 35.9 | 44 | 600 | 1.976 | Q | NV |
| CIV | |||||||
| 0154+35 | 01 54 45.46 | 35 58 04.6 | 34 | 1200 | – | – | Detected in red/ |
| Featureless | |||||||
| 0154+44 | 01 54 54.47 | 44 33 37.9 | 40 | 3300 | – | – | Detected/ |
| Featureless | |||||||
| 0156+44 | 01 56 28.52 | 44 59 56.5 | 46 | 600 | (0.214 | G? | [OII]? |
| 0157+41 | 01 57 05.01 | 41 20 30.6 | 30 | – | 0.0811 | G | Abell 0276 |
| 0159+41 | 01 59 49.33 | 41 44 32.9 | 33 | 1200 | – | – | Featureless |
| 1702+55 | 17 02 34.56 | 55 11 12.4 | 34 | 600 | – | – | Featureless |
| 1702+58 | 17 02 41.37 | 58 13 10.1 | 38 | 5400 | – | – | Featureless |
| 1703+63 | 17 03 04.72 | 63 42 29.8 | 34 | 3600 | – | – | Featureless |
| 1706+60 | 17 06 56.08 | 60 23 37.9 | 27 | 600 | 1.472 | Q | CIV |
| CIII] | |||||||
| 1715+57 | 17 15 22.98 | 57 24 40.3 | 35 | – | 0.0279 | G | NGC6338 |
| 1715+63 | 17 15 35.96 | 63 23 36.0 | 37 | 600 | 2.185 | Q | Ly |
| SiIV | |||||||
| CIV | |||||||
| CIII]? | |||||||
| 1721+59 | 17 21 00.65 | 59 26 49.4 | 41 | 1200 | 0.587 | G | [OII] |
| [OIII] | |||||||
| [OIII] |
| Source | R.A. | Decl. | Flux | Integ. | Redshift | G/Q | Line ID |
|---|---|---|---|---|---|---|---|
| (J2000) | (J2000) | (mJy) | (s) | ||||
| (1) | (2) | (3) | (4) | (5) | (6) | (7) | (8) |
| 1728+55 | 17 28 11.64 | 55 32 30.5 | 42 | 600 | 1.404 | Q | CIV |
| CIII] | |||||||
| MgII | |||||||
| 1728+67 | 17 28 21.67 | 67 53 34.2 | 27 | 1200 | 1.987 | Q | Ly |
| SiIV | |||||||
| CIV | |||||||
| CIII] | |||||||
| 1729+67 | 17 29 20.47 | 67 02 13.0 | 26 | 1800 | 0.952 | Q | CIII] |
| MgII | |||||||
| [NeV] | |||||||
| [OII] | |||||||
| [NeIII]? | |||||||
| 1730+60 | 17 30 52.71 | 60 25 16.7 | 36 | 600 | 0.730 | Q | MgII |
| H | |||||||
| H | |||||||
| 1732+55 | 17 32 23.74 | 55 24 52.8 | 32 | 300 | 0.064 | G | CaIIH |
| CaIIK | |||||||
| H | |||||||
| 1733+58 | 17 33 07.53 | 58 19 47.6 | 26 | 600 | 1.631 | Q | CIV |
| CIII] | |||||||
| MgII | |||||||
| 1733+60 | 17 33 51.33 | 60 49 34.0 | 26 | 1200 | – | – | Featureless |
| 1735+56 | 17 35 13.78 | 56 50 21.8 | 31 | 5400 | – | – | Detected/ |
| Featureless | |||||||
| 1745+68 | 17 45 33.18 | 68 56 05.7 | 43 | 4800 | – | – | Featureless |
| 1747+59 | 17 47 33.94 | 59 02 47.9 | 25 | 1800 | 0.981 | Q | CIII] |
| MgII | |||||||
| 1756+58 | 17 56 29.14 | 58 06 58.2 | 38 | 200 | 0.192 | G | [OII] |
| H | |||||||
| [NII] | |||||||
| [SII] | |||||||
| 1756+59 | 17 56 11.83 | 59 18 56.8 | 25 | 3000 | (0.479) | Q | MgII |
| H? |
| Source | R.A. | Decl. | Flux | Integ. | Redshift | G/Q | Line ID |
|---|---|---|---|---|---|---|---|
| (J2000) | (J2000) | (mJy) | (s) | ||||
| (1) | (2) | (3) | (4) | (5) | (6) | (7) | (8) |
| 1756+65 | 17 56 40.36 | 65 31 45.9 | 43 | 1200 | 2.790 | Q | Ly |
| NV | |||||||
| CIV | |||||||
| CIII] | |||||||
| 1759+64 | 17 59 23.01 | 64 48 56.6 | 33 | 1200 | 2.476 | Q | Ly |
| NV | |||||||
| SiIV | |||||||
| CIV | |||||||
| CIII] | |||||||
| 1800+61 | 18 00 25.24 | 61 26 15.1 | 30 | 3000 | – | – | Detected/ |
| Featureless |