A correlation between the SiO and the Fe 6.4 keV line emission from the Galactic center
Abstract
One of the most interesting results of the X-ray observations with the ASCA satellite of the Galactic center (GC) is the spatial distribution and the intensity of the Fe line at 6.4 keV. Up to now the morphology and the intensity of this line have been a puzzle. In this letter we present a map of the GC in the J=10 line of SiO covering the same region than the ASCA observations. The SiO emission is restricted to molecular clouds with radial velocity between 10 and 60 km sin the Sgr A and Sgr B complexes. We find a correlation between the SiO morphology and the spatial distribution of the Fe 6.4 keV line, on the large scale and also within Sgr A and Sgr B. The SiO abundance increases by a factor of 20 in the regions with strong Fe 6.4 keV line. This indicates that the Fe 6.4 keV line mainly arises from molecular clouds with large gas phase abundance of refractory elements. We discuss the implications of the correlation on the origin of the hard X-rays, and the heating and the chemistry of the molecular clouds in the GC.
Key Words.:
Galaxy: center – ISM: clouds – ISM: X-rays– ISM: molecules – Radiolines: ISM1 Introduction
The Galactic center (GC) is a strong source of diffuse X-ray emission in the 2-10 keV energy range and in lines from several ions Kawai et al. (1988); Sunyaev et al. (1993); Koyama et al. (1996, 1996); Sidoli and Mereghetti (1999). Recently, the ASCA satellite mapped the X-ray emission from the GC Koyama et al. (1989). One of the most interesting results is the spatial distribution and the intensity of the iron K lines. The Fe K lines of highly ionized ions (He-like at 6.70 keV and H-like at 6.97 keV) arise from hot gas with temperatures of 9 keV. This emission is concentrated towards Sgr A-West and symmetrically distributed along the galactic plane with a spatial distribution similar to that of the radio continuum emission and the molecular clouds Maeda and Koyama (1996). This is in sharp contrast with the K line from neutral or low ionized Fe atoms at 6.40 keV (hereafter Fe∘ line) which shows emission only towards the Sgr A and Sgr B complexes Koyama et al. (1996).
The Fe∘ line emission is caused by fluorescence and appears when neutral cold molecular clouds are exposed to a strong source of hard X-rays. In X-ray irradiated molecular clouds like those in the GC, it is expected that the X-rays will influence the heating, the ionization and the chemistry of these clouds (see e.g. Hollenbach et al., 1997). It is well known that the physical conditions and the chemistry of the molecular clouds in the GC differ substantially from those in the galactic disk (see e.g. Morris & Serabyn, 1996). High gas kinetic temperature Huettemeister et al. (1993), and large abundance of SiO are typical in the GC Minh et al. (1992); Martin-Pintado et al. (1997); Huettemeister et al. (1998). The origin of these unusual characteristics is unclear, but it is believed to be due to strong shocks in the GC Wilson et al. (1982); Martin-Pintado et al. (1997). In this letter we present a correlation between the SiO radio emission and the Fe∘ line, suggesting that X-rays may play an important role in the heating and the chemistry of the GC molecular clouds.
2 Observations and results
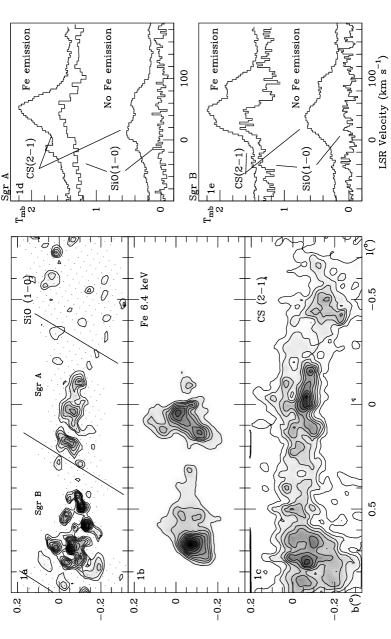
The mapping of the J=10 line of SiO was carried out with the 14-m radio telescope at the Centro Astronómico de Yebes in Guadalajara (Spain). The telescope characteristics, the receiver, the backend, and the mapping procedure have been described in Martín-Pintado et al. Martin-Pintado et al. (1997). The aperture efficiency of the telescope at low elevation has been improved by a factor of 1.5 due to a shaped subreflector that corrects for the large scale gravitational deformations in the main reflector Garrido et al. (1999). The new SiO map, that contains the data by Martin-Pintado et al. (1997), has been extended to cover the region observed with the ASCA satellite. The integrated intensity map of the J=10 line, obtained with 2′ resolution, is shown in Fig. 1a.
Figures 1b and 1c show the spatial distribution of the Fe∘ line Koyama et al. (1996) and of the integrated intensity of the J=21 line of CS Bally et al. (1987) obtained with angular resolutions of 2′ and 3′ respectively. The spatial distribution of the SiO integrated intensity is different from that of CS. While the CS integrated intensity is relatively smooth with a moderate increase by a factor of 3 towards the molecular cloud complexes Sgr A (0∘), Sgr B (0.6∘) and Sgr C (0.5∘), the SiO emission mainly arises from Sgr A and Sgr B. To show that the difference between the CS and the SiO emission cannot be due to dynamic range problems in the SiO map, the contour levels in the CS map have been chosen to be a factor 1.5 of those in the SiO map. Furthermore, the SiO emission from Sgr A and Sgr B increases with respect to the surrounding clouds by a factor of 8. The fine scale of the SiO and CS integrated line intensities also show important differences within the Sgr A and Sgr B complexes Martin-Pintado et al. (1997).
3 The correlation between the SiO abundance and the fluorescence Fe∘ line

On large scales the morphology of the SiO emission shows a remarkable correlation with that of the Fe∘ line (Fig. 1b). Both emissions are only detected towards Sgr A and Sgr B, but not towards Sgr C. Given the different requirements for the excitation of the SiO and the Fe∘ lines, departures from this correlation are also found. The main exception to the correlation is the presence of SiO emission towards the radio-Arc at 0.18∘ where the Fe∘ line is not detected. We do not find, however, the opposite situation, i. e. strong Fe∘ without SiO emission.
There is also an overall correlation between the Fe∘ and the SiO emissions within Sgr A and Sgr B. This is illustrated in Fig. 1d and 1e, where we show the spectra of the SiO and the CS emission averaged over Sgr A and Sgr B (see Fig. 1a) for the regions with and without emission in the Fe 6.4 keV line. While the CS line intensity is independent (within a factor of 2) of the spatial distribution of the Fe∘ emission, the SiO line intensity changes by a factor of 10 (20 for integrated intensities) between the regions with and without Fe∘ line emission.
In the regions with emission in the Fe∘ line, we find that the line profiles of SiO and CS are different. The SiO emission mainly appears in the molecular clouds with radial velocities between 10 and 60 km s(hereafter 40 km sclouds). Towards Sgr B we do not detect SiO emission from the CS clouds with radial velocities between 70 and 110 km s(hereafter 90 km sclouds).
Fig. 2 shows the ratio between the integrated line intensity of the SiO and the CS emission (hereafter the SiO/CS ratio) for the 40 km sclouds (filled triangles) and for the 90 km sclouds (open triangle) as a function of the intensity of the Fe∘ line for Sgr B. For the regions without or weak (0.2510-6 counts/sec/0.106 min2) Fe∘ line emission, we do not detect the SiO line and derive an upper limit to the SiO/CS ratio of 410-2. The SiO/CS ratio increases by more than a factor of 20 in the region with the strongest Fe∘ line emission. There is a weak increase of the SiO/CS ratio with the intensity of the Fe∘ line for intensities of 0.2510-6 counts/sec/0.106 min2. However, this change is marginal, since it is within the scatter in the SiO/CS ratios (see Fig. 2). The SiO emission is not detected for the 90 km sclouds independently of the Fe∘ line intensity. The upper limit to the SiO/CS ratio for these clouds in Sgr B is 610-2, similar to that derived for the molecular clouds without Fe∘ line emission.
The differences between the CS J=21 and the SiO J=10 lines cannot be due to excitation effects since both transitions have similar rotational constants and similar critical densities. Opacity effects can also be ruled out since the two lines show similar optical depths Huettemeister et al. (1998). Therefore, the difference between the CS and the SiO emission is due to changes in the SiO abundance relative to that of CS Martin-Pintado et al. (1997). Changes in the CS abundance are unlikely since the spatial distribution of CS is similar to that of 13CO Bally et al. (1987). For a CS fractional abundance of 510-9 and the typical physical conditions in the GC clouds ( density of 5104 cm and a kinetic temperature of 40-200 K), the SiO abundance in the 40 km sclouds for the region with Fe∘ line emission is 10-9. The SiO abundance decreases to 510-11 for the molecular clouds without Fe∘ line emission like Sgr C and for the 90 km s clouds in the regions with strong Fe∘ line in Sgr B. This low SiO abundance suggests that the bulk of the Fe∘ line arises only from the 40 km s-1 molecular clouds. Therefore, 60% of the mass in Sgr B, that with SiO emission, contributes to the Fe∘ line. This estimate is in agreement with the results obtained from the modeling of the Fe∘ line intensity in Sgr B which requires that 50% of the mass contributes to the Fe∘ line Murakami et al. (2000). In summary, the Fe∘ line emission in the GC arises from the molecular clouds with large gas phase abundance of refractory elements like SiO.
4 Discussion
The relationship between the SiO abundance and the presence of the Fe∘ line opens the possibility to understand the origin of SiO in gas phase and that of the Fe∘ line in the GC. The molecular clouds with emission in the Fe∘ line always seem to have enhanced abundance of SiO in gas phase. The simplest explanation could be that this association is related to a metal abundance larger than solar in some molecular clouds as indicated by modeling of the Fe∘ line intensity in Sgr B Murakami et al. (2000). Metal enriched molecular clouds in the GC could also have more Si in gas phase which would be completely converted into SiO Herbst et al. (1989). However, changes in the cosmic abundance from cloud to cloud seem to be unlikely since the metallicity in the hot diffuse component is rather homogeneous over the 1∘1∘region around the GC Maeda and Koyama (1996).
A common origin for the X-rays and the large SiO abundance in gas phase and/or a peculiar chemistry induced by X-rays could both explain the correlation. The origin of the X-rays producing the Fe∘ line in the GC is unclear Koyama et al. (1996); Sunyaev and Churazov (1998). The relatively large abundance of SiO and its spatial distribution in the GC clouds can be explained by an increase of Si or SiO in gas phase due to grain processing by shocks Martin-Pintado et al. (1997); Huettemeister et al. (1998). It is possible that the sources driving the strong shocks responsible for the grain destruction also generate the hard X-ray emission which excite the Fe∘ line. This could be the case for Sgr A where an explosion in Sgr A East, which is now expanding inside the 50 km scloud, has been proposed as the origin of the high-energy activity in this region Yusef-Zadeh et al. (1997).
For the Sgr B cloud, it has been argued that the Fe∘ line cannot be excited by the hot plasma since the observed X-ray luminosity is one order of magnitude smaller than the required to account for that observed in the Fe∘ line. Therefore it has been proposed that this complex is a X-ray reflection nebula illuminated by a time variable source(s) of hard X-rays located outside the neutral cool material Koyama et al. (1996). It is possible that a burst of X-rays that occurred hundreds of years ago from the Sgr A region (likely from Sgr A*) now irradiates the Sgr B molecular complex Koyama et al. (1996); Sunyaev and Churazov (1998). In the X-ray reflection nebula scenario, the heating, ionization and the chemistry of the molecular clouds will be influenced by the illuminating X-rays Maloney et al. (1996). Molecular clouds irradiated by X-rays contain regions of high temperature where reactions with activation barriers could contribute to molecule formation Neufeld et al. (1994). Then, the SiO abundance in the hot regions could be enhanced if Si is in gas phase. If silicate grains smaller than 10 Å are present, X-rays can evaporate these dust grains Voit (1991) providing the small fraction of Si in gas phase (0.1%) required to explain the SiO abundance in the GC molecular clouds.
It is interesting to note that the peak of the Fe∘ line in Sgr B coincides with a large concentration of hot expanding molecular shells Martín-Pintado et al. (1999). These shells are thought to be produced by wind-blown bubbles driven by massive evolved stars. Massive evolved stars in the supernova stage show both the Fe∘ line (see e.g. Kinugasa et al. 1999) and a large abundance of SiO Ziurys et al. (1989). It is possible that any of the sources driving the hot expanding molecular shells has undergone about 30 years ago a flare in hard X-rays giving rise to the observed Fe∘ line.
5 Conclusions and perspectives
We have presented a new map of the SiO emission from the inner 200 pc of the Galaxy. We find a correlation between the spatial distribution of the SiO emission and that of the fluorescence line of Fe at 6.4 keV. The Fe∘ line is only found in the molecular clouds where the SiO abundance increases by more than a factor of 20 with respect to the molecular cloud complexes without Fe∘ line emission. The origin of this association is so far unknown. X-ray sources driving strong shocks or X-ray reflection nebula are possible explanations. Obviously, the combination of high angular resolution maps of the hard X-ray emission obtained with XMM and Chandra with those of the molecular emission from refractory elements will provide important clues about the origin of the X-ray activity and the unusual properties of the molecular clouds in the GC.
Acknowledgements.
We thank Dr. J. Bally for kindly providing the CS data and Drs. T.L. Wilson and R. Gaume for critical reading of the manuscript. This work has been partially supported by the Spanish DGICYT under grants PB96-104 and 1FD97-1442. NJR-R has been supported by the Consejería de Educación y Cultura de la Comunidad de Madrid.References
- Bally et al. (1987) Bally, J., Stark, A. A., Wilson, R. W., and Henkel, C., 1987, ApJS 65, 13
- Garrido et al. (1999) Garrido, J., Barcia, A., López-Pérez, and J.A., Paéz, J., 1999, Microwave Journal 42, 82
- Herbst et al. (1989) Herbst, E., Millar, T. J., Wlodek, S., and Bohme, D. K., 1989, A&A 222, 205
- Huettemeister et al. (1998) Huettemeister, S., Dahmen, G., Mauersberger, R., Henkel, C., Wilson, T. L., and Martin-Pintado, J., 1998, A&A 334, 646
- Huettemeister et al. (1993) Huettemeister, S., Wilson, T. L., Bania, T. M., and Martin-Pintado, J., 1993, A&A 280, 255
- Kawai et al. (1988) Kawai, N., Fenimore, E. E., Middleditch, J., Cruddace, R. G., Fritz, G. G., Snyder, W. A., and Ulmer, M. P., 1988, ApJ 330, 130
- Koyama et al. (1989) Koyama, K., Awaki, H., Kunieda, H., Takano, S., and Tawara, Y., 1989, Nat 339, 603
- Koyama et al. (1996) Koyama, K., Maeda, Y., Sonobe, T., Takeshima, T., Tanaka, Y., and Yamauchi, S., 1996, PASJ 48, 249
- Maeda and Koyama (1996) Maeda, Y. and Koyama, K., 1996, in Astronomical Society of the Pacific Conference The Galactic Center, Astronomical Society of the Pacific Conference Series, Volume 102, Manuscripts presented at the 4th international meeting jointly organized by the Inter-American Observatory (CTIO), held March 10-15, 1996 in La Serena, Chile, San Francisco: Astronomical Society of the Pacific (ASP), —c1996, edited by Roland Gredel, p.423, p. 423
- Maloney et al. (1996) Maloney, P. R., Hollenbach, D. J., and Tielens, A. G. G. M., 1996, ApJ 466, 561
- Martín-Pintado et al. (1999) Martín-Pintado, J., Gaume, R. A., Rodríguez-Fernández, N., de Vicente, P., and Wilson, T. L., 1999, ApJ 519, 667
- Martin-Pintado et al. (1997) Martin-Pintado, J., de Vicente, P., Fuente, A., and Planesas, P., 1997, ApJ Lett. 482, L45
- Minh et al. (1992) Minh, Y. C., Irvine, W. M., and Friberg, P., 1992, A&A 258, 489
- Murakami et al. (2000) Murakami, H., Koyama, K., Sakano, M., Tsujimoto, M., and Maeda, Y., 2000, ApJ p. in press
- Neufeld et al. (1994) Neufeld, D. A., Maloney, P. R., and Conger, S., 1994, ApJ Lett. 436, L127
- Sidoli and Mereghetti (1999) Sidoli, L. and Mereghetti, S., 1999, A&A 349, L49
- Sunyaev and Churazov (1998) Sunyaev, R. and Churazov, E., 1998, MNRAS 297, 1279
- Sunyaev et al. (1993) Sunyaev, R. A., Markevitch, M., and Pavlinsky, M., 1993, ApJ 407, 606
- Voit (1991) Voit, G. M., 1991, ApJ 379, 122
- Wilson et al. (1982) Wilson, T. L., Ruf, K., Walmsley, C. M., Martin, R. N., Batrla, W., and Pauls, T. A., 1982, A&A 115, 185
- Yusef-Zadeh et al. (1997) Yusef-Zadeh, F., Purcell, W., and Gotthelf, E., 1997, in AIP Conf. Proc. 410: Proceedings of the Fourth Compton Symposium, p. 1027
- Ziurys et al. (1989) Ziurys, L. M., Snell, R. L., and Dickman, R. L., 1989, ApJ 341, 857