Interaction in Abell 2256: the BeppoSAX view
Abstract
We present results from a spatially resolved spectral analysis of the merging cluster Abell 2256. The long integration time (135 ks) and the good spatial resolution of the MECS onboard BeppoSAX allow us to derive a new and substantially improved measurement of the temperature structure. We find that, within a central region of the cluster, where the effects of the merger are visible in the ROSAT surface brightness image, the azimuthally averaged projected temperature is remarkably flat; outside this region the projected temperature rapidly declines. The BeppoSAX data also shows clear evidence of an azimuthal temperature gradient in the 4′-8′ (0.4-0.8 Mpc) radial bin, oriented in the same direction as the merger itself. Our metal abundance profile shows, for the first time, firm evidence of an abundance gradient in a rich merging cluster. Intriguingly the abundance map shows, in the SE sector, i.e. the one furthest away from the merger, a sharp factor of two drop in abundance at a radius comparable to the core radius of the cluster. A possible interpretation is that, prior to the merger event, a cooling flow had already developed in the core of the infalling subgroup, as suggested by Fabian and Daines (1991). The interaction between the substructures would have disrupted the cooling flow thereby re-heating and re-mixing the gas. As the merger in A2256 is still in a relatively early stage, the gas located on the side opposite to the merger event would still retain the low abundances associated with the intra-cluster medium (ICM) prior to the cooling flow disruption.
Subject headings:
X-rays: galaxies — Galaxies: clusters: individual (Abell 2256)1. Introduction
Abell 2256 (hereafter A2256) is a rich, nearby (z 0.057, Bothun & Schombert 1990), cluster of galaxies. Studies in the optical band have shown that the velocity dispersion is quite large (1400 km/s; Fabricant, Kent & Kurtz 1989, Bothun & Schombert 1990). An early ROSAT PSPC image of A2256 (Briel et al. 1991) provided clear evidence of substructure, showing two emission peaks separated by about 3.5 arcminutes. One of the two peaks is coincident with the cD galaxy while the distorted morphology of the other indicates that it is merging with the main cluster. A reanalysis, by Briel et al. (1991), of the velocity distribution of the galaxies measured by Fabricant, Kent & Kurtz (1989) shows that it can be separated into two distinct distributions coincident with the two X-ray peaks. Fabian & Daines (1991), from the ROSAT PSPC surface brightness distribution, have estimated cooling times of 2 years and 5 years at the center of the main cluster and of the infalling subcluster respectively. The above authors imply that, prior to the merger event, a cooling flow had already developed in the core of the infalling subgroup and that the merger may have interrupted the cooling flow and stirred up the gas within it.
Various attempts have been made to measure the temperature structure of A2256. Briel & Henry (1994), using ROSAT PSPC data, find evidence that the infalling group has a lower temperature than the main peak. They also find evidence of two hot spots opposite each other and perpendicular to the presumed infall direction of the subgroup, however this result was not confirmed by Markevitch & Vikhlinin (1997) who reanalyzed the same data. Markevitch (1996, hereafter M96), from ASCA data, finds evidence of a smoothly declining radial temperature profile, going from 8.7 keV near the core to 4 keV in the outskirts. His temperature map shows that the subgroup has a smaller temperature than the main peak. Irwin, Bregman & Evrard (1999), from ROSAT PSPC hardness ratios, find a radial profile consistent with a constant temperature out to 15′ from the cluster core. Their hardness ratio two dimensional map is in general agreement with the one of Briel & Henry (1994). White (1999, hereafter W99), from a reanalysis of the ASCA data, finds a radial temperature profile consistent with being constant out to 18′ from the cluster core.
In this Letter we report BeppoSAX observations of A2256. We use our data to perform an independent measurement of the temperature profile and two-dimensional map of A2256. We also present the abundance profile and the first abundance map of A2256. The outline of the Letter is as follows. In section 2 we give some information on the BeppoSAX observation of A2256 and on the data preparation. In section 3 we present spatially resolved measurements of the temperature and metal abundance. In section 4 we discuss our results and compare them to previous findings. Throughout this Letter we assume Ho=50 km s-1Mpc-1 and qo=0.5.
2. Observation and Data Preparation
The cluster A2256 was observed by the BeppoSAX satellite (Boella et al. 1997a) at two different epochs; between the 11th and the 12th of February 1998 and between the 25th and the 26st of February 1999. We will discuss here data from the MECS instrument onboard BeppoSAX; a joint analysis of the MECS and PDS spectra of A2256 is presented in Fusco-Femiano et al. (2000). The MECS (Boella et al. 1997b) is presently composed of two units working in the 1–10 keV energy range. At 6 keV, the energy resolution is 8% and the angular resolution is 0.7′ (FWHM). Standard reduction procedures and screening criteria have been adopted to produce linearized and equalized event files. Data preparation and linearization was performed using the Saxdas package under Ftools environment. The total effective exposure time for the two observation was 1.3105 s. All spectral fits have been performed using XSPEC Ver. 10.00. Quoted confidence intervals are 68% for 1 interesting parameter (i.e. ), unless otherwise stated.
3. Spatially Resolved Spectral Analysis
Spectral distortions introduced by the energy dependent PSF must be accounted for when performing spatially resolved spectroscopy of galaxy clusters. As for the analysis of other BeppoSAX observations of clusters (e.g. A2319, Molendi et al. 1999), we have taken them into account using the Effarea program publicly available within the latest Saxdas release. We remark that we fit spectra individually. This is not what is typically done when performing spatially resolved spectroscopy of clusters with ASCA data. Here spectra accumulated from different regions are typically analyzed simultaneously, the reason being that the correction to be applied to a given region depends on the temperature of all the others. The lack of a strong dependence of the MECS PSF on energy allows us to avoid such complications.
3.1. Radial Profiles
For each of the two observations we have accumulated spectra from 6 annular regions centered on the main X-ray emission peak of A2256, with inner and outer radii of 0′-2′, 2′-4′, 4′-6′, 6′-8′, 8′-12′ and 12′-16′. We have also accumulated a global spectrum from a circle with radius 16′. The background subtraction has been performed using spectra extracted from blank sky event files in the same region of the detector as the source. A correction for the absorption caused by the strongback supporting the detector window has been applied for the 8′-12′ annulus, where the annular part of the strongback is contained. For the 6′-8′ and 12′-16′ annuli, where the strongback covers only a small fraction of the available area, we have chosen to exclude the regions shadowed by the strongback. For the 5 innermost annuli the energy range considered for spectral fitting was 2-10 keV; for the outermost annulus, the fit was restricted to the 2-8 keV energy range to limit spectral distortions which could be caused by an incorrect background subtraction (see De Grandi & Molendi 1999a for details). Source and background spectra accumulated for each of the two observations have then been summed together.
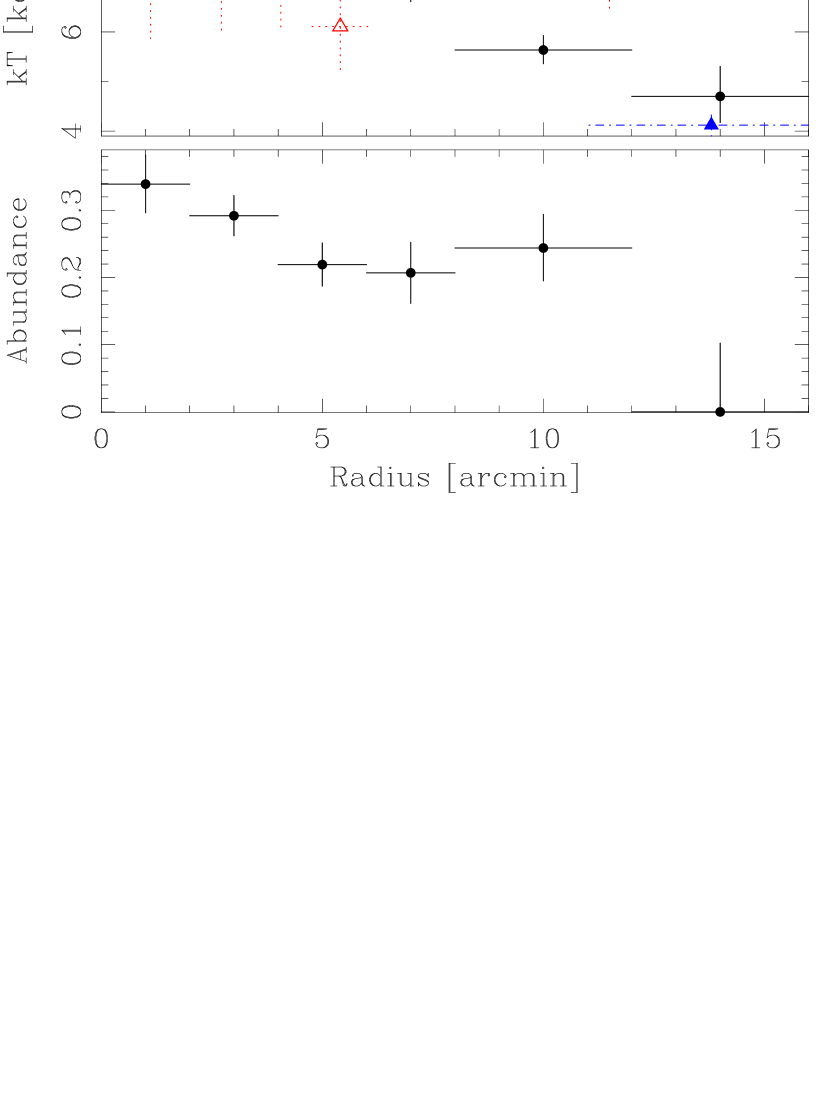
We have fitted each spectrum with a MEKAL model absorbed by the Galactic line of sight equivalent hydrogen column density, , of 4.1 cm-2. The temperature and abundance we derive from the global spectrum are respectively 7.5 keV and 0.25, solar units. In figure 1 we show the temperature and abundance profiles obtained from our six annular regions. A constant does not provide a good fit to the temperature or the abundance profile (see table 1).
As in Molendi et al. (1999), we have used the Fe Kα line as an independent estimator of the ICM temperature. Considering the limited number of counts available in the line, we have performed the analysis on 2 annuli with bounding radii, 0′-8′ and 8′-12′, the very small Fe abundance measured in the 12′-16′ annulus prevents us from deriving a reliable line centroid for this region. We have fitted each spectrum with a bremsstrahlung model plus a line, both at a redshift of z=0.057 (ZBREMSS and ZGAUSS models in XSPEC), absorbed by the galactic . A systematic negative shift of 40 eV has been included in the centroid energy to account for a slight misscalibration of the energy pulseheight-channel relationship near the Fe line. To convert the energy centroid into a temperature we have derived an energy centroid vs. temperature relationship. This has been done by simulating thermal spectra, using the MEKAL model and the MECS response matrix, and fitting them with the same model, which has been used to fit the real data. We derive a temperature of 8.0 keV for the inner radial bin and of 3.2 keV for the outer one. Thus, our two independent measurements of the temperature profile are in good agreement with each other.
3.2. Maps
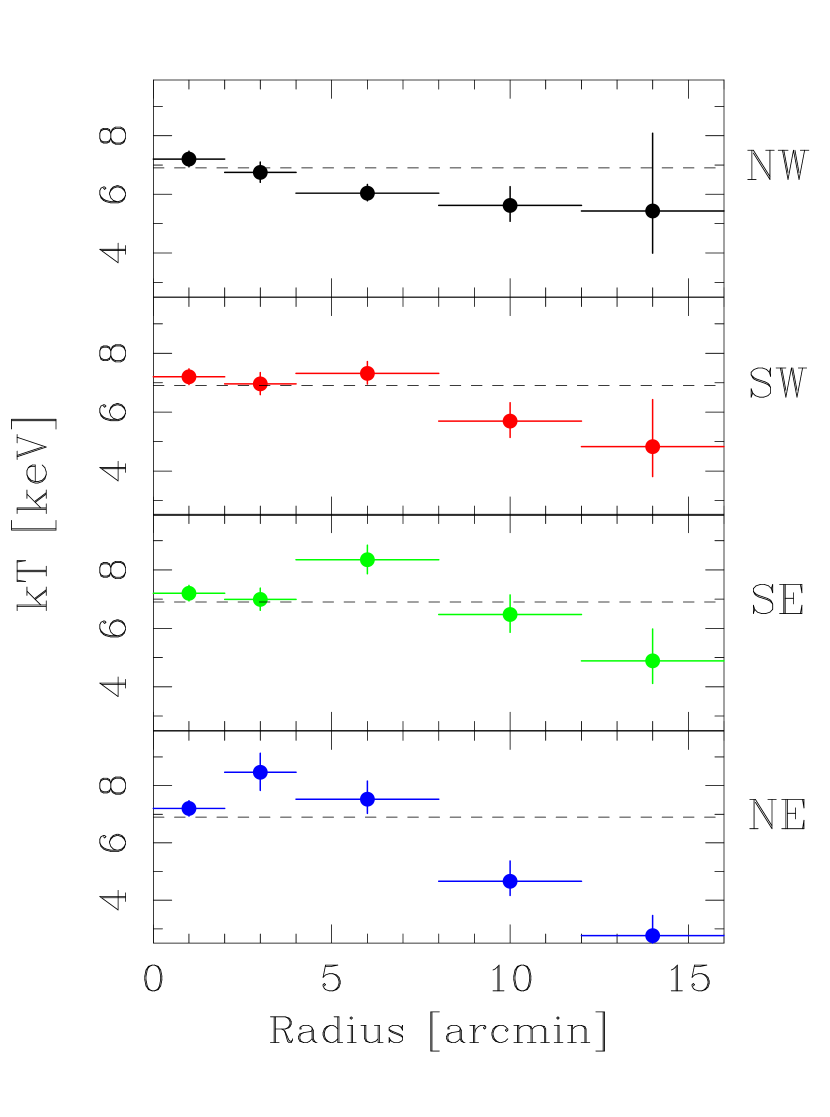
As shown in figure 2, we have divided the MECS image of A2256 into 4 sectors: NW, SW, SE and NE, each sector has been divided into 4 annuli with bounding radii, 2′-4′, 4′-8′, 8′-12′ and 12′-16′. The background subtraction has been performed using spectra extracted from blank sky event files in the same region of the detector as the source. Correction or exclusion of the regions shadowed by the strongback supporting the detector window have been performed as in the previous subsection. The energy ranges and the spectral models adopted for fitting are the same used for the azimuthally averaged spectra.
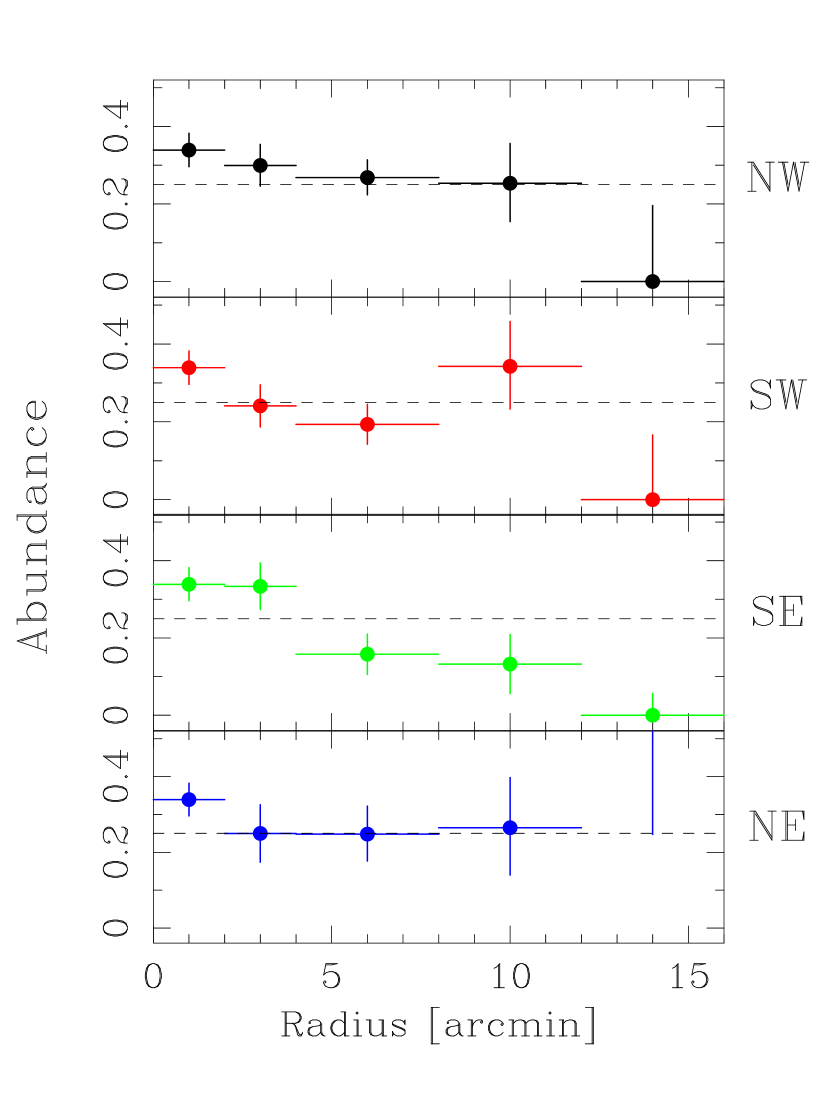
In figures 3 and 4 we show respectively the temperature and abundance profiles obtained from the spectral fits for each of the 4 sectors. In table 1 we report the best fitting constant temperatures and abundances for the profiles shown in figures 3 and 4. Note that in all the profiles we have included the measure obtained for the central circular region with radius 2′. All sectors, except for the SW sector, show a statistically significant temperature decrease with increasing radius. In the NW sector the temperature decreases continuously as the distance from the cluster center increases. In the SE and NE sectors the temperature first increases, reaching a maximum in either the second (NE sector) or third (SE sector) annulus, and then decreases. Interestingly, a fit to the temperatures of the 4 sectors in the third annulus (bounding radii 4′-8′) with a constant, yields for 3 d.o.f., with an associated probability for the temperature to be constant of , indicating that an azimuthal temperature gradient is present near the core of the cluster. More specifically the NW sector of the cluster is the coldest, 6 keV, and the SE sector the hottest, 8.4 keV. The SE sector is the only one to show clear evidence of an abundance decline with increasing radius, all other sectors have abundance profiles which are consistent with being flat.
Sector kT Prob.a Abundance Prob.a d.o.f. (keV) (Solar Units) All 6.90.1 36.4 0.250.02 13.9 5 NW 6.60.2 11.3 0.300.03 3.8 0.43 4 SW 7.00.2 7.4 0.12 0.270.03 8.1 4 SE 7.20.2 11.3 0.210.03 29.0 4 NE 6.70.2 52.2 0.300.03 2.0 0.74 4
aProbability for the observed distribution to be drawn from a constant parent distribution.
4. Discussion
Previous measurements of the temperature structure of A2256 have been performed by Briel & Henry (1994) and Irwin et al. (1999), using ROSAT data, by M96 and by W99 using ASCA data. We have performed a detailed comparison of our radial temperature profile with the ones based on the ASCA satellite (M96 and W99) which covers an energy range similar to ours. In figure 1 we have overlaid the temperature profile obtained by M96 and by W99 on our profile. The higher quality of the BeppoSAX measurement, due in part to the much longer exposure time and in part to the better angular resolution of our instrument, is quite evident. The innermost bin in the M96 profile, 0′-6′ has a temperature that is inconsistent with the temperature we measure from our three innermost bins spanning the same radial range. It must be noted that, while our profile is azimuthally averaged over all angles, the M96 measurement has been obtained excluding the region presumably contaminated by the softer emission of the infalling group. To obtain a direct comparison between our measurement and the one reported in M96, we have derived the temperature from a circular region with radius 6′ excluding the NW sector containing the infalling group. Our measurement, 7.50.2 keV, although somewhat higher than the one obtained by averaging over all directions, is still incompatible at more than the 3 level with the one reported by M96. The second radial bin reported in M96 (6′-11′) is characterized by a temperature apparently larger than the mean temperature for our corresponding bins (i.e. 6′-8′ and 8′-12′). However this difference is only apparent, indeed if we simultaneously fit the BeppoSAX spectra for the 6′-8′ and 8′-12′ bins, which is equivalent to fitting data from the 6′-12′ bin, we derive a temperature of 6.60.3 keV, which is consistent with the one derived by M96. The temperature for the outermost bin in the M96 profile is in agreement with our own measurement. The W99 measurement, which comes from a different analysis of the same ASCA observation used by M96, is in agreement with ours for radii smaller than 6′. The outermost bin reported in W99 appears to have a temperature substantially larger than the mean temperature for our corresponding bins (i.e. 6′-8′, 8′-12′ and 12′-16′). This difference is only apparent, if we simultaneously fit the BeppoSAX spectra for the 6′-8′, the 8′-12′ and the 12′-16′ bins we derive a temperature of 6.50.3, which is consistent with the one derived by W99. The apparent difference is related to the strong gradient in the surface brightness profile when going from 6′ to 16′, which causes the emission from the entire region to be dominated by the contribution of the innermost annuli. In summary: for radii larger than 6′, our profile is in agreement with the M96 and W99 profile, while for radii smaller than 6′, our profile is in agreement with the W99 profile and in disagreement with the M96 profile.
The most striking feature of our radial temperature profile is the presence of a relatively localized gradient. The temperature is flat out to 8′ and decreases by almost a factor two within the following 8′. The radius at which the temperature starts to decline (0.8 Mpc) is comparable to the radius at which the X-ray isophotes are no longer disturbed by the interaction of the two subclusters, which is clearly seen at smaller scales in the ROSAT PSPC image (e.g. figure 2 of Briel et al. 1991). Thus the presence of a hot almost isothermal region in the core is most likely related to the on-going merger between the main cluster and the group. The BeppoSAX temperature map shows clear evidence of an azimuthal gradient in the 8′-12′ radial bin. The NW sector is found to be the coldest while the SE sector appears to be the hottest, thus the gradient appears to be oriented in the same direction as the merger itself. Interstingly, in a previous work (De Grandi & Molendi 1999a), the merging cluster A3266 was found to have a similar temperature structure. No evidence of the two hot spots reported by Briel & Henry (1994) is found in our map.
The metal abundance in A2256 appears to decrease with increasing radius (see figure 1). This is the first firm case, to our knowledge, of an abundance gradient in a rich non cooling flow cluster. Evidence of an abundance gradient has been found in the poor cluster MKW4 (Finoguenov et al. 1999), while marginal evidence has been found in A399 (Fujita et al. 1996) and A1060 (Finoguenov et al. 1999). In A2256 the abundance averaged over a central region of 0.2 Mpc radius is 0.3, solar units, a value which, although higher than the average abundance for non cooling flow cluster, 0.20 (Allen & Fabian 1998), is smaller than those commonly observed in the core of cooling flow cluster (see for example Finoguenov et al. 1999, for an analysis of abundance profiles from ASCA data, and our own BeppoSAX results on Abell 2029, Molendi & De Grandi 1999, and PKS 0745-191, De Grandi & Molendi 1999b). Furthermore, the abundance map (see figure 4) shows that the SE sector, i.e. the one furthest away from the on-going merger, presents a highly significant abundance decline (probability ) localized at a radius comparable to the core radius of the cluster. A possible interpretation is that, prior to the merger event, a cooling flow had already developed in the core of the infalling subgroup, as suggested by Fabian & Daines (1991). The above authors, from the gas densities at the center of the main cluster and of the infalling subcluster compute cooling times of 2 years and 5 years respectively, implying that the infalling subcluster must have had a cooling flow. The interaction between the substructures would have disrupted the cooling flow thereby re-heating and re-mixing the gas. As the merger in A2256 is still in a relatively early stage, the gas located on the side opposite to the merger event may still retain the low abundances associated to the ICM prior to the cooling flow disruption. It seems unlikely that a contribution to the metallicity enhancement has come from the main cluster as its core density implies a cooling time that is larger than the age of the Universe. Finally we speculate that other rich merging clusters, similar to A2256, may present metallicity gradients produced by disrupted cooling flows. BeppoSAX and future XMM observations of merging clusters will certainly contribute in clarifying this issue.
References
- (1) Allen, S., W., & Fabian, A., C. 1998, MNRAS, 297, L63
- (2) Boella, G., Butler, R. C., Perola, G. C., Piro, L., Scarsi, L., & Bleeker, J. A. M. 1997a, A&AS, 122, 299
- (3) Boella, G., et al. 1997b, A&AS, 122, 327
- (4) Bothun, G., D.,& Schombert J., M. 1990, 360, 436
- (5) Briel, U. G., Henry, J. P., Schwarz, R. A., et al. 1991, A&A, 246, L10
- (6) Briel, U. G., & Henry, J. P. 1994, Nature, 372, 439
- (7) David, L. P., Slyz, A., Jones, C., Forman, W., Vrtilek, S. D., & Arnaud, K. A. 1993, ApJ, 412, 479
- (8) Dickey, J. M., & Lockman, F., J. 1990, ARA&A, 28, 215
- (9) De Grandi, S., Molendi, S. 1999a, ApJ, 527, L25
- (10) De Grandi, S., Molendi, S. 1999b, A&A, 351, L45
- (11) Fabian, A. C., & Daines, S. J. 1991, MNRAS, 252, P17
- (12) Fabricant, D., G., Kent, S. M., & Kurtz, M. J. 1989, ApJ, 336, 77
- (13) Finoguenov, A., David, L. P., Ponman, T. J. 1999, ApJ submitted (astro-ph/9908150)
- (14) Fujita, Y.; Koyama, K.; Tsuru, T.; Matsumoto, H. 1996, PASJ, 48, 191
- (15) Fusco-Femiano, R. et al. 2000, in preparation
- (16) Irwin, J. A., Bregman J. N., & Evrard A. E. 1999, ApJ, 519, 518
- (17) Markevitch, M. 1996, ApJL, 465, 1
- (18) Markevitch, M., & Vikhlinin, A. 1997, ApJ, 474, 84
- (19) Molendi, S., De Grandi, S., Fusco-Femiano, R. et al. 1999 ApJ, 525, L73
- (20) Molendi, S., & De Grandi, S. 1999, A&A, 351, L41