Model of peak separation in the gamma lightcurve of the Vela pulsar
Abstract
The separation between two peaks in the gamma-ray pulse profile is calculated as a function of energy for several polar cap models with curvature-radiation-induced cascades. The Monte Carlo results are interpreted with the help of analytical approximations and discussed in view of the recent data analysis for the Vela pulsar [1999]. We find that the behaviour of as a function of photon energy depends primarily on local values of the magnetic field, , in the region where electromagnetic cascades develop. For low values of ( G), is kept constant. However, for stronger magnetic fields ( G) in the hollow-column model decreases with increasing photon energy at a rate dependent on maximum energy of beam particles as well as on viewing geometry. There exists a critical photon energy above which the relation changes drastically: for , in hollow-column models the separation increases (whereas in filled-column model it decreases) rapidly with increasing , at a rate of of the total phase per decade of photon energy. The existence of critical energy is a direct consequence of one-photon magnetic absorption effects. In general, is located close to the high-energy cutoff of the spectrum, thus photon statistics at should be very low. That will make difficult to verify an existence of in real gamma-ray pulsars. Spectral properties of the Vela pulsar would favour those models which use low values of magnetic field in the emission region ( G) which in turn implies a constant value of the predicted within EGRET range.
keywords:
pulsars: general – pulsars: individual: PSR B083345 – gamma-rays: observations – gamma-rays: theory.1 Introduction
Two prominent peaks are a characteristic feature of gamma-ray pulse shapes in the three brightest out of seven gamma-ray pulsars detected so far: Crab (PSR B0531+21), Vela (PSR B0833-45), and Geminga (J0633+1746). Phase separation between the two peaks is very large in each case, in the range between 0.4 and 0.5 (e.g. Fierro, Michelson & Nolan 1998). The separation, which we denote by , was determined with photons from the entire energy range of EGRET.
Kanbach [1999] suggested that the separation in Vela might be energy dependent. The effect would be of the order of a few percent or less. The plot of the phase separation against energy (fig.2 of Kanbach 1999) shows that decreases by about over 20 energy intervals covering the range between and . The scatter of points is, however, large enough for this result still to be consistent with the separation staying at a constant level of , especially when one rejects two energy intervals: of the lowest and the highest value.
Such effects as suggested by Kanbach can be justified qualitatively, at least within polar cap scenarios. Their origin may be different at different energy ranges, and their magnitude may vary as well. For example, Miyazaki & Takahara [1997] found dramatic changes in peak-to-peak phase separation due to magnetic absorption effects in their attempts to model the Crab pulse shapes. Their numerical calculations were performed with low photon energy resolution for a model with homogeneous polar cap, and instant acceleration.
This new aspect of studying the HE properties of pulsars is potentially attractive. The problem of poor photon statistics should become less essential with future high-sensitivity missions like GLAST. Then any well established empirical relation between the phase separation and the photon energy (including ) may help to discriminate in favour of some particular models of pulsar activity.
In this context we present a model of the peak-to-peak phase separation in the gamma-ray lightcurve of Vela and confront it with the results of Kanbach [1999]. Our aim is to present properties of predicted by the polar cap model with curvature (CR) and synchrotron (SR) radiation being dominant emission mechanisms. This is an extension of the preliminary results of Dyks, Rudak & Bulik [2000]. In section 2 we outline the model and introduce the input parameters for which Monte Carlo simulations were performed. Section 3 describes the numerical results and offers their interpretation; conclusions follow in section 4.
2 The Model
The presence of two peaks with large (0.4 - 0.5) phase separation in gamma-ray lightcurves within single polar cap models requires a nearly aligned rotator (e.g. Daugherty & Harding 1994) where the following three characteristic angles are to be of the same order: - the angle between the spin axis and the magnetic moment , - the opening angle between the direction of the gamma-ray emission and , and - the angle between and the line of sight. For a canonical polar cap and instant electron acceleration, roughly equals radians only (where denotes a spin period). To avoid uncomfortably small characteristic angles, Daugherty & Harding [1996], postulated that primary electrons come from extended polar caps, and with the acceleration occuring at a height of several neutron-star radii . The latter assumption may be supported by the results of Harding & Muslimov [1998] who investigated in a self-consistent way particle acceleration by the electrostatic field due to field-line curvature [1983] and inertial frame dragging effect [1992]. Harding & Muslimov found that a stable accelerator, with double pair-formation-front controlled by curvature radiation, is possible at a height of about 0.5 to 1 stellar radii. Here we use a polar cap model combined with the assumption of a nearly aligned rotator. Most ingredients of the pc-model come from Daugherty & Harding [1982]. Geometry of the magnetic field of a neutron star is assumed to be well described by a static, axisymmetric dipole.
| primary electrons | |||||
| Model A | 1.0 | 3.0 | 0.0 | 1.0 | TeV, no acceleration |
| Model B | 1.0 | 5.0 | 1.0 | 1.0 | TeV, no acceleration |
| Model C | 3.0 | 10.0 | 2.0 | 2.0 | , acceleration (see eq.(2)) |
| with Volts | |||||
| Model D | 1.0 | 3.0 | 0.0 | TeV, no acceleration |
Within a given polar cap (pc) model with a fixed value of there are two possible values of viewing angle resulting in an identical peak separation (defined as a fraction of ) but with a reversed order of the two peaks (in terms of a leading peak, and then a trailing peak). Fig. 1 illustrates the ambiguity in the definition of a double-peak pulse. A simple geometrical relation connects the three angles of interest - , and - to the phase separation :
| (1) |
(eg. Ochelkov & Usov 1980), where for large, and for small This relation holds as far as aberration of photon propagation due to rapid rotation is neglected.

Throughout the paper we always take the case of the larger in each model (4 models are considered). Its value (, and degrees for models A, B, C, and D, respectively) along with our choice for the angle (see Table 1) is to yield the separation at .
The dominant HE emission process is the curvature radiation (CR) by ultrarelativistic beam particles (primary electrons which leave the polar cap), followed by magnetic pair production with the subsequent synchrotron emission (SR). Our numerical code to follow the cascades induced by beam particles is based on Daugherty & Harding [1982], and takes advantage of the following approximations relevant to the problem of directional and spectral distributions of the photons: The curvature photons are emitted tangentially to the local magnetic field direction in a frame rotating with the star. The created e±-pairs are assumed to follow the directions of their parent CR photons and they share the photons’ energy equally (for justification see Daugherty & Harding 1983). The synchrotron photons are emitted perpendicularly to the local magnetic field direction in a frame comoving with electron/positron center of gyration. The pairs are assumed not to change their position on the field line when radiating (for magnetic field strengths considered here, energy-loss length scales due to SR are of the order of cm). The emergent high-energy spectrum is a superposition of CR and SR. We follow Rudak & Dyks [1999] to calculate detailed broad band energy spectra of the high-energy emission.
Beam particles are injected along magnetic field lines into the magnetosphere either from the outer rim of the polar cap (hollow cone column) or from the entire polar cap surface (filled column). We use two simple models for their acceleration to ultrarelativistic energies: 1) instant acceleration and 2) acceleration due to a uniform longitudinal electric field over a scale height . The pulse shapes as a function of photon energy were calculated numerically for four sets of initial parameters (hereafter called models A, B, C and D). Table 1 features most important model parameters. In models A and B the primary electrons are distributed evenly along a hollow cone formed by the magnetic field lines from the outer rim of a canonical polar cap, i.e. with a magnetic colatitude , where radians at the stellar surface level (). The beam particles are injected at a height with some initial ultrarelativistic energy (listed in Table 1) and no subsequent acceleration takes place. The main difference between models A and B is due to different values of (equal to 0 and 1 respectively) which result in different locations of origin of secondary particles. Changing these locations is an easy way to modify spectral properties of emergent radiation and enables to change (preferrably - to increase) the angle as constrained by the observed energy-averaged peak separation [1999]. In model C we assume . The primaries are injected at with and undergo acceleration by a longitudinal electric field present over a characteristic scale height , resulting in a total potential drop :
| (2) |
For comparison, we considered model D with a uniform electron distribution over the entire polar cap surface (i.e. ). All its remaining features are indentical to model A.
The values of in models A, B and D, and the potential drop in model C were chosen to yield similar number of secondary pairs — about per beam particle. In all cases the spin period of the Vela pulsar s was assumed.
3 Results
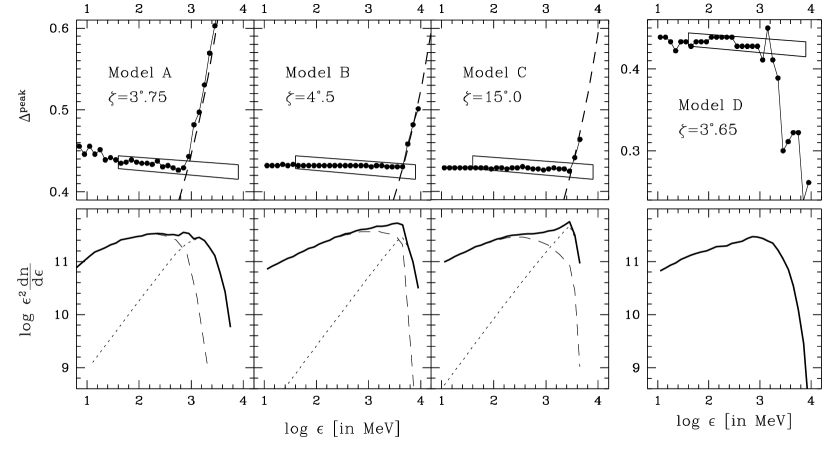
General properties of the function may be described in short in the following way: In the low-energy range (i.e. below a few GeV) the peak separation either remains constant with the increasing photon energy (Models B, C, and D) or slightly decreases (Model A). In either case, however, the slope of versus looks consistent with the results of Kanbach [1999]. Then, around a few GeV there exists a critical energy , at which the separation undergoes a sudden turn: in the high-energy domain (i.e. for ) it increases in our hollow-column models (A, B, and C), whereas it decreases in the filled-column model (D), at a rate phase per decade of photon energy. The existence of is a direct consequence of magnetic absorption () in the magnetosphere (see also Miyazaki & Takahara 1997). [Note, that is not equivalent to a high-energy cut-off in a spectrum due to the magnetic absorption]. The dependence of peak separation upon photon energy for all four models is presented in Fig. 2 (upper panels).
To understand why the slope in the low-energy domain () is different in different models, we will now present several factors which are of interest in this respect.
Let us start with possible consequences of the orientation on in this context, i.e. with the choice of the angles and . For a given emission pattern in a frame of magnetic dipole rotating with the star and for a set of values of angles and fulfilling the condition , a line of view can cross the hollow cone of emission at different impact angles. Let us estimate how geometry alone would affect the relations shown in Fig. 2. We neglect aberration of photon propagation due to rotation when calculating directional emission pattern as seen from some inertial observer frame. For staying close to 0.5 (roughly between and ) , the value of is approximately proportional to with a constant of proportionality equal to . Moreover, for a radiating particle sliding along a dipolar field line with the dipole constant (, are the coordinates of the particles in the dipolar frame), one can link the opening angle with a radial position of the particle:
| (3) |
Since in polar cap models , the right-hand side of eq. (3) can be approximated by which along with eq.(1) gives
| (4) |
where
and
The slope of the relation is a combination of two factors: 1) viewing geometry and 2) directional and spectral changes in the radiation yielding the peaks with increasing radial coordinate :
| (5) |
Any changes in viewing geometry (i.e. the angles and ) will affect the slope via , the latter being calculated from eq.(4). For example, for models A and B the parameter equals and , respectively. Should be identical for these two models, the slope in model A would be about two times bigger than in model B. Fig. 2 (upper panels) does not show any such effects: the slope in model B is for . This is because the viewing geometry effects are dwarfed by differences in directional and spectral properties of the radiation in these models.

To analyse directional and spectral properties of the peak emission it is instructive to begin with a simplified, one-component model. Suppose that the only contribution to the emission is due to optically thin CR, i.e. both magnetic absorption and synchrotron emission by secondary pairs created due to this absorption are neglected. Numerical simulations of this case (not included in this paper) show that the peak separation in such a case, which we denote as , stays constant as a function of for the models with instant acceleration (A, B, D), while it increases with increasing for model C (acceleration over ) at a rate dependent on the electron acceleration rate. The former case can be understood by arguing that energy of the electron decreases monotonically from its starting value , while its radius of curvature increases. Recalling the properties of the curvature continuous spectrum due to a single particle (e.g. Landau & Lifshitz 1973) this makes the contribution to the spectrum per unit distance by the electron to be the highest one just at the initial altitude . In consequence, the contribution to the spectrum per unit phase angle by a bundle of electrons moving along a set of open field lines is the highest one at . Therefore, it is the opening angle of the CR photons at which fixes the phase separation of the two peaks regardless the photon energy. In the latter case the qualitative behaviour of can be understood by assuming that the phase of the pulse peak at a given photon energy is approximately determined by such altitude at which accelerated electrons reach the energy which satisfies the condition , where is a characteristic energy of the CR spectrum and is a local radius of curvature; both and are functions of altitude .
We now relax these two simplifications and present the consequences. First, the inclusion of magnetic absorption results in a strong response of at highest photon energies - between some critical energy and the high-energy cutoff, as mentioned in the first paragraph. This effect will be addressed in the final part of this section. Second, adding up synchrotron component (SR) due to pairs changes the properties of high-energy emission for (i.e. below a few GeV) significantly. Most notable is the domination of SR over CR in terms of intensity. The total energy output per logarithmic energy bandwidth at the first peak as a function of photon energy for models A, B, C and D is presented in Fig. 2 (lower panels). Both components – SR and CR – are marked schematically to show their relative importance. Consequently, is affected by directional and spectral properties of the SR emission.
The behaviour of is shown in Fig. 2 (upper panels). Its slight decrease with increasing (model A) or no change at all (models B, C, and D) - is due to a combination of factors which determine the directional and spectral properties of SR. These include energy and pitch angle distributions of secondary pairs, as well as their vertical spread within the magnetosphere combined with a strength of the local magnetic field. These factors change from one model to another:
Model A - In strong local magnetic fields ( G), efficient pair production requires lower electron energies than in a low-field case (like in model B). The production occurs over a wider range of altitudes. Consequently, the spectrum of SR contributed locally by the pairs evolves considerably over this range of altitudes. Lorentz factors of gyration are of low values (of the order of , where ). The resulting local SR spectra are, therefore, very narrow (see also the lower panel of fig.1 in Rudak & Dyks 1999): they spread between the (local) characteristic SR energy and the (local) cyclotron turnover energy (where is the pitch angle) which roughly satisfy , and the ratio does not exceed in model A. With increasing height (therefore, with decreasing ) both and move towards lower and lower values. The final effect of this softening is then a notable decrease of with increasing photon energy (Fig. 2, upper panel, Model A). In even stronger local magnetic fields (but not exceeding ) the rate of decrease of with increasing may be much larger, because -pairs are produced with extremely low and synchrotron/cyclotron photons emitted at any altitude concentrate near the local cyclotron energy .
Model B - When cascades are to develop in a relatively weak magnetic field, G, very high electron energy is required. The high value of means rapid CR cooling which brings the electron energy quickly below the level required for pair production. Curvature photons become too soft for pair creation via magnetic absorption very quickly after injection. The bulk of pairs is created by electrons with their energies confined to a narrow range at and consequently the SR component originates within a narrow range of magnetospheric altitudes (radial positions ). The resulting does not change with photon energy .
The difference between model A and B in radial extension of the regions of origin of curvature photons which are absorbed, producing pairs and eventually SR, is presented in Fig. 3 (right-hand vertical axes). The difference is more appealing when presented in terms of (left-hand vertical axes).
Model C - After initial stage of linear acceleration, the electrons enter a regime of ‘radiation reaction limited acceleration’. Over a considerable range of altitudes () the electrons’ energy remains approximately constant and so does the pair production efficiency (it is equal to pairs per centimetre of the primary electron path). In such conditions, any evolution of the SR-spectrum over this range might affect as a function of . Nevertheless, no significant changes occur in . This is because a single-particle SR-spectrum almost does not change its shape within the range of altitudes with stable, strong pair production. The balance between the acceleration rate and the CR-cooling rate stabilizes as well as . Any spectral changes of SR in its low-energy part, nearby , are not relevant in the context of gamma-rays, since they occur near 100 keV, i.e. well below the energy range of EGRET. 111The behaviour of SR in its low-energy part (i.e. in hard X-rays) may then lead to increase of in the hard X-ray domain in comparison to in the gamma-rays. Assuming alternative to our choice definition of , with (see Section 2), the behaviour of would be a mirror-reflection of our case. Then this effect might explain low value of within the keV range found by Strickman, Harding & deJager [1975] in RXTE data of Vela. Moreover, below 2 keV the synchrotron component in the model spectrum drops below the level of CR-emission, and the value of as for the gamma-rays is expected to be resumed there.
Model D (a uniform distribution of primary electrons over the polar cap but otherwise identical to model A) - the final effect does not resemble the decrease of with increasing photon energy found for model A. Apart from numerical fluctuations (see Fig. 2, upper panel) the separation remains approximately constant as a function of .
Finally, let us discuss the inclusion of magnetospheric opacity due to . This effect becomes important above , where most power is due to CR in all models. In this regime the position of each peak in the pulse is determined by magnetic absorption, and this results in a strong response of between and a high-energy cutoff: At the separation undergoes a sudden turn and starts increasing (or decreasing) rapidly for . For the hollow-column models (A, B and C) the photons in both peaks of a pulse come from low magnetospheric altitudes with narrow opening angles. When is high enough these photons will be absorbed. Photons which now found themselves in the ‘new’ peaks come from higher altitudes (the magnetosphere is transparent to them) and have wider opening angles. In other words, inner parts of the ‘original’ peaks in the pulse will be eaten-up and the gap between the peaks, i.e. the peak separation , will increase (Fig.2). Our Monte Carlo results for at may be reproduced with good accuracy by a simple analytical solution of which has to be combined with eq.(4). The requirement is particularly simple (with some well known approximations being used) since it refers to a photon created with a momentum tangential to local dipolar magnetic field line at a height above the neutron star surface (at radial coordinate ). The photon will undergo magnetic absorption (to be more precise, with a probability of ) if its energy satisfies the following condition:
| (6) |
(cf. eq. 11 in Bulik et al. 1999). This formula is valid for hollow-column models but may be used for any dipolar field line (the factor comes just from choosing the outer rim of a polar cap to be the site of field-line footpoints). Although the pulsar spin (which leads to an aberration and a slippage of magnetic field under the photon’s path) has been neglected in derivation of eq. (6), the formula gives in excellent agreement with Monte Carlo method for the emission regions placed up to several above the surface and rotation periods typical for strong-field pulsars ( s). One may look at the eq.(6) as the condition for a radius of escape at a given energy . Photons of energy will escape the magnetosphere only if they are emitted at which satisfies . The radial coordinate has to be combined now with eq.(4) to give relevant for the ‘magnetic absorption ’regime. This analytical is shown as dashed lines in Fig.2 (upper panels) and in Fig.3, whereas the filled dots are the Monte Carlo results. This branch of solution intersects the horizontal line set by at , , and GeV for models A, B, and C, respectively.
For model D, with a uniform distribution of primary electrons over the polar cap (but otherwise identical to model A) the changes of above , occur in the opposite sense. Unlike in previous models, here both peaks of the pulse are formed by photons emitted tangentially to magnetic field lines attached to the polar cap at some opening angle . These photons are less attenuated than those coming from a hollow-column, and in consequence the peak separation drops. A similar behaviour was obtained by Miyazaki & Takahara [1997], in their model of a homogeneous polar-cap.
We have also investigated the behaviour od above for other distributions of primary electrons over the polar cap. We have considered intermediate cases between models A and D, (i.e. with a uniform coverage of only an outer part of the polar cap area between some inner radius and the polar cap radius ), and models with uniformly filled interior of the polar cap surface but with increased electron density along the polar cap rim (cf. Daugherty & Harding 1996). We conclude that regardless the actual shape of the active part (i.e. ‘covered’ with primary electrons) of the polar cap (either an outer rim, or an entire cap, or a ring, or entire cap/ring + increased rim density), one does expect in general strong changes in the peak separation to occur at photon energies close to high-energy spectral cutoff due to magnetic absorption.
A word of technical comment seems to be appropriate for at . It appears that a technique adopted by Kanbach [1999] of fitting the observed pulse shapes with asymetric Lorentz profiles tends to overestimate the true value of by a few thousandth parts of phase. Therefore the actual value may be closer to 0.42 than 0.43 (Maurice Gros, private communication). Nonetheless, this shift in does not change any conclusions of this work.
4 Summary
In this paper we addressed a recent suggestion of Kanbach [1999] that peak separation in the double-peak gamma-ray pulses of the Vela pulsar may monotonically decrease with increasing photon energy at a rate phase per decade in energy over the range to , We calculated gamma-ray pulses expected in polar-cap models with magnetospheric activity induced by curvature radiation of beam particles. Two types of geometry of magnetospheric column above the polar cap were assumed: a hollow-column associated with an outer rim of the polar cap and a filled column associated with a uniform polar cap. Four models were considered with two scenarios for the acceleration of beam particles. Pulsed emission in the models was a superposition of curvature radiation due to beam particles and synchrotron radiation due to secondary pairs in magnetospheric cascades. The changes in the peak separation were investigated with Monte Carlo numerical simulations.
We found that regardless the differences in the models, the peak separation below a few GeV, where the emission is dominated by synchrotron component, is either a weak decreasing function of photon energy , or remains constant. Both variants may be considered to be in agreement with the results of Kanbach [1999] for the latter are affected by large statistical errors. A particular behaviour of depends on a combination of several factors, including strength of magnetic field in the region of pair formation and model of electron acceleration (both of which determine spectral and directional properties of the radiation at different altitudes), as well as viewing geometry. Essentially, in strong fields, , decreases with increasing photon energy , whereas for , the peak separation stays at a constant level.
Moreover, we found that due to the magnetic absorption () there exists a critical energy at which the peak separation makes an abrupt turn and then changes dramatically for . It increases in the hollow-column models (A, B, and C) and decreases in the filled-column model (D), at a rate phase per decade of photon energy. The numerical behaviour of in this regime in the hollow-column models was easily reproduced to high accuracy with a simple analytical model of magnetospheric transparency for a photon of energy , and its momentum tangential to local dipolar magnetic field line at a site of its origin. An exact value of is model-dependent but it is confined to a range between and .
To find such a hypothetical turnover of in real observational data would require, however, high-sensitivity detectors, since for the expected flux of gamma-rays drops significantly. If detected, this turnover would be an important signature of polar cap activity in gamma-ray pulsars. It would support the notion that high-energy cutoffs in gamma-ray spectra of pulsars are due to magnetic absorption.
The CR-induced cascades models, like those considered in this work, are not the only possibility for nearly aligned rotators to produce double-peak pulses with large phase separations. There exists an alternative class of models - with pair cascades above polar cap induced by magnetic inverse Compton scatterings (ICS) of primary electrons in the field of soft photons from the stellar surface - proposed in a series of papers (e.g. Sturner & Dermer 1994, Sturner et al. 1995). In particular, Sturner et al. (1995) present the detailed Monte Carlo model spectra of the Vela pulsar. They also present pulse profiles at a fixed energy of 50 MeV (for several viewing angles) but no word of comment is given regarding the problem of versus photon energy. We expect the outcome to be qualitatively similar to our results. First, the scatterings take place mostly within a very limited height above the polar cap surface (below ) and the preferred directions of propagation of the ICS photons will be fixed by magnetic field lines just above the surface. Therefore, due solely to ICS photons should stay constant for a wide range of energy. Inclusion of synchrotron photons due to pairs is unlikely to notably affect unless the pair formation front is vertically more extended than for CR-induced cascades. Second, some turnover point at not exceeding 1 GeV should be present due to magnetic absorption. The behaviour of for should roughly follow the dashed lines in Fig. 2 (upper panel) and Fig.3 as long as the assumption about photons (which are to be absorbed) propagating tangentially to local dipolar magnetic field line at their site of origin remains valid for majority of ICS photons. To verify this qualitative picture would, however, require detailed numerical calculations.
ACKNOWLEDGEMENTS
This work has been financed by the KBN grants 2P03D-01016, and 2P03D-02117. Support from Multiprocessor Systems Group at Nicholas Copernicus University’s Computer Centre in providing facilities for the time/memory-consuming Monte Carlo calculations is appreciated. We are grateful to Gottfried Kanbach and Maurice Gros for valuable discussions on processing and analysis of high-energy data for the Vela pulsar. We thank the anonymous referee for bringing our attention to the paper by Sturner et al. (1995).
References
- [1983] Arons J., 1983, ApJ, 266, 215
- [2000] Dyks J., Rudak B., Bulik T., 2000, in Proc. 19th Texas Symposium, in the press
- [1982] Daugherty J. K., Harding A. K., 1982, ApJ, 252, 337
- [1983] Daugherty J. K., Harding A. K., 1983, ApJ, 273, 761
- [1994] Daugherty J. K., Harding A. K., 1994, ApJ, 429, 325
- [1996] Daugherty J. K., Harding A. K., 1996, ApJ, 458, 278
- [1998] Fierro J. M., Michelson P. F., Nolan P. L., Thompson D. J., 1998, ApJ, 494, 734
- [1998] Harding A. K., Muslimov A. G., 1998, ApJ, 508, 328
- [1999] Kanbach G., 1999, in Proc. 3rd INTEGRAL Workshop, Astrophysical Letters and Communications, 38, 17
- [1973] Landau L. D., Lifshitz E. M ., 1977, The Classical Theory of Fields, PWN, Warsaw
- [1997] Miyazaki J., Takahara F., 1997, MNRAS, 290, 49
- [1992] Muslimov A. G., Tsygan A. I., 1992, MNRAS, 255, 61
- [1980] Ochelkov Y. P., Usov V. V., 1980, Ap.Sp.Sci., 69, 439
- [1999] Rudak B., Dyks J., 1999, MNRAS, 303, 477
- [1975] Strickman M. S., Harding A. K., deJager O. C., 1999, ApJ, 524, 373
- [1994] Sturner S.J., Dermer C.D., 1994, ApJ, 420, L79
- [1995] Sturner S. J., Dermer C. D., Michel F. C., 1995, ApJ, 445, 736