WR 146 - Observing the OB-type companion
Abstract
We present new radio and optical observations of the colliding-wind system WR 146 aimed at understanding the nature of the companion to the Wolf-Rayet star and the collision of their winds. The radio observations reveal emission from three components: the WR stellar wind, the non-thermal wind-wind interaction region and, for the first time, the stellar wind of the OB companion. This provides the unique possibility of determining the mass-loss rate and terminal wind velocity ratios of the two winds, independent of distance. Respectively, these ratios are determined to be and for the OB-companion star relative to the WR star. A new optical spectrum indicates that the system is more luminous than had been believed previously. We deduce that the “companion” cannot be a single, low luminosity O8 star as previously suggested, but is either a high luminosity O8 star, or possibly an O8+WC binary system.
keywords:
stars: individual: WR146 — stars: Wolf-Rayet — radio continuum: stars1 Introduction
Wolf-Rayet stars are surrounded by dense stellar winds giving rise to free-free emission extending from IR to radio wavelengths. Typically, this emission is characterised by a power-law spectrum of the form , with values of the spectral index , and radio brightness temperatures K. A small number of WR stars have radio emission that exhibits quite different properties: negative spectral indices and brightness temperatures K or higher, properties that are characteristic of non-thermal emission. WR 146 is a member of this group, which includes WR 125, WR 140 and WR 147.
The radio emission from WR 146 was first resolved in high resolution observations with MERLIN (Dougherty et al. 1996, hereafter Paper I). These 5-GHz observations revealed two components, N5 and S5, separated by milli-arcseconds (mas). The flux of S5 was consistent with that estimated from extrapolation of the IR-millimetre spectrum arising from the free-free emitting envelope around the WR star. The brightness temperature of N5 (K) identified the nature of the emission from this component as non-thermal. An optical spectrum showed evidence for absorption lines at H and H, which we attributed to an early-type companion to the WR star. This led us to hypothesize in Paper I that the non-thermal emission arose from a population of relativistic electrons, accelerated in a wind-wind collision region where the wind of the WR star and the companion interacted (e.g. Eichler & Usov 1993). To be consistent with such a model, we suggested the companion lay at the same position angle as N5 from S5, but slightly further away from the WR star.
The presence of a companion was confirmed in optical imaging with the Hubble Space Telescope (HST) by Niemela et al. (1998). They observed two stars, WR146A and B (hereafter SO and NO respectively), at the same position angle as the radio sources but separated by mas. Under the assumption that the southern sources in both the HST and MERLIN images are coincident, these observations place the non-thermal source between the two stellar images, strongly supporting wind-wind collision as the origin of the non-thermal emission. Its position relative to the two stellar components ( mas from SO and 48 mas from NO) is where the dynamical pressure of the two stellar winds is balanced. This indicates that the momentum of SO’s stellar wind is 0.1 times that of NO. With the wind velocity of the WC star in WR 146 ( 2900 km s-1, Eenens & Williams 1994) being greater than that of a typical OB star, and the expectation that the mass-loss rate of a WR star would be greater than that of an OB star, this strongly supports the identification of SO with the WC6 star in Paper I and identifies NO with an OB companion having a lesser wind momentum. The momentum ratio lead Niemela et al. to infer that the wind momentum of the companion was more appropriate to a star of early O or Of type than a late O-type main-sequence star. Taking account of the photometry, they suggested an O6-O5 V-III spectral type for the companion.
The photometry by Niemela et al. showed the two stars to be equally bright in B but that SO was redder than NO in (B–V) and (U–B). The (near-zero) magnitude difference between the two blue images falls between two very different estimates of the WR:O light ratio deduced from spectra of WR 146 which included both stars.
On the one hand, in Paper I, we measured equivalent widths of H and H in our blue spectrum of WR 146 to be 0.9Å. Comparison of these with those (Å) typical of mid-to-late O stars in the Walborn & Fitzpatrick (1990) atlas indicated that the O-star spectrum was diluted and suggested that the continuum of the WC star was twice as bright as that of the O companion in the blue. On the other hand, Willis et al. (1997) used a spectrum of lower resolution but longer wavelength coverage than presented in Paper I to determine the WR:O light ratio from comparison of the equivalent widths of the emission lines with those of two single WC6 stars. They found that the O star was brighter than the WC star, reporting a continuum light ratio (WR:O) of 1:(21).
The discrepancy in the light ratios of the WC6 and O components derived from the dilution of O star absorption lines and WC6 star emission lines is significant and probably too great to arise purely from the observational uncertainties. Leaving aside the question of whether one of the stars varied between the two observations, the principal uncertainties in two spectroscopic light-ratio determinations come from whether the intrinsic line strengths of the components are indeed equal to those of the comparisons adopted. The discrepancy could be reduced if the equivalent widths of H and H in the O star were weaker than the 2.5Å adopted or if the emission lines in the WC6 component were weaker than those of other WC6 stars. Both possibilities are plausible.
The strengths of the emission lines in WR 146 may well be atypical for its WC6 type: both Eenens & Williams (1992) and Willis et al. found anomalously low C/He abundances for this star. On the other hand, the strengths of H and H in O-type stars do depend on spectral type and luminosity class, which are not known directly for the companion in WR 146. We note that the “O8.5V” adopted by Willis et al. comes not from the star’s spectral lines but from its luminosity inferred from that of the WC6 star and the continuum light ratio. We therefore re-observed the blue spectrum of WR 146 with the William Herschel Telescope in an attempt to determine the spectral type and, hopefully, luminosity of the early-type companion to the WR star. These data, together with the photometry by Niemela et al., will give us a better idea of the intrinsic properties of the companion for comparison with the radio observations.
We also re-observed WR 146 at radio wavelengths, extending the frequency coverage of Paper I, to search for the wind flux from the companion, and study the characteristics of the two previously observed radio components with the aim of furthering our understanding of the colliding wind phenomenon.

2 Radio Wavelength Study
2.1 The observations
Multi-frequency observations of WR 146 at 1.4, 5, 8.4, and 22 GHz were taken on 1996 October 26 using the A-configuration of the NRAO Very Large Array (VLA). Observations of the nearby radio-bright quasar 2005+403 were interleaved with the observations of the target source for phase-referenced calibration of the antennae gains. The absolute flux scale was determined by observation of 3C48, assumed to have fluxes of 15.970, 5.516, 3.226 and 1.174 Jy at 1.4, 5, 8.4, and 22 GHz respectively.
In addition, archival data from MERLIN at 5 GHz have been analysed. A 4-hour on-source observation at 5 GHz was obtained with MERLIN on 1992 December 26, along with frequent observations of the phase calibration source 2005+403. Following the standard procedure for calibrating MERLIN 5-GHz data, the flux scale was established by observation of 3C286 with an assumed total flux of 7.309Jy (7.020 Jy on the MK2-Tabley baseline) and the unresolved source 0552+398, which had a derived “bootstrap” flux of 5.786 Jy. The bootstrap fluxes for 2005+403 are given in Table LABEL:tab:fluxes.


It is possible to check the accuracy of the derived flux scales in the 5- and 8.4-GHz observations. Comparison of the “bootstrap” fluxes of 2005+403 at these frequencies to those given in the University of Michigan Radio Astronomy Observatory (UMRAO) flux database shows that, where closely contemporaneous observations are available, the agreement with UMRAO fluxes at these frequencies is within . Given the excellent agreement at these two frequencies, it is reasonable to assume that the flux scales at the other observed frequencies are good.
Aside from the initial amplitude calibration of the MERLIN observations, the calibration and subsequent imaging of the data were carried out using the NRAO AIPS software package. The complex antennae gains were initially derived for 2005+403 and then interpolated (phase-referenced) to the observations of WR 146. In addition, several iterations of phase-only self-calibration were used to refine the antennae gains during the MERLIN observations of WR 146 to improve the dynamic range of the final synthesized images.
At 1.5 and 4.9 GHz the VLA data reveal an unresolved source, whereas at 8.4 GHz the radio emission is marginally resolved. However, WR 146 is well resolved into a double radio source at 22 GHz. The final synthesized 22-GHz image is shown in Fig. 2. We identify the northern and southern components as N22 and S22. The visibility data suggest both these components are resolved (Figure 3). Gaussian model fits to the visibilities give the diameter of the radio emitting regions as and mas respectively (see Paper I for a description of the method). The large relative uncertainty in these sizes is a direct consequence of the high rms uncertainty per visibility at 22 GHz. The fluxes from the VLA observations were determined by Gaussian source fitting using the AIPS routine JMFIT. The measured fluxes are given in Table LABEL:tab:fluxes.
The final synthesized MERLIN image at 5 GHz is shown in Fig 1. The image reveals two components of emission, identified as N5 and S5. In the MERLIN observation, the flux and size of component N5 were determined by Gaussian model fitting of the visibility data. The derived diameter for N5 is mas. Gaussian fitting to the image data were used for the source parameters of S given in Table 1.
Qualitatively, the 1992 MERLIN image is consistent with the 5-GHz observation from 1995 April 29 (Paper I) though there is some evidence that N5 may have decreased in flux by mJy between 1992 and 1995. The flux of S5 appears to have decreased between the two epochs. However, the difference is only , much less than the threshold typically adopted as evidence for variation. Therefore, we adopt the mean value of mJy for the flux of S5. Variations in the total 5-GHz emission from WR 146 have been observed using the WSRT over the last decade that are attributed to variations in the non-thermal component (Setia-Gunawan et al. 2000). Both our MERLIN 5-GHz total flux values are consistent with the WSRT observations. Variability could account for the slightly higher 5-GHz flux at the epoch of the VLA observations.
The positions of the components observed at 5 GHz and 22 GHz are quoted in Table LABEL:tab:positions. The absolute position of the northern component in the various observations was deduced from the phase-reference only calibrated images. Absolute position information is lost during the self-calibration process, though the relative position is preserved. These were deduced from the images shown in Fig. 1 and Fig. 2.
2.2 Identifying the radio components


The nominal resolution of A-configuration at 22-GHz observations is very similar to that of MERLIN at 5 GHz, allowing direct comparison of these data. At 22 GHz, the VLA observations reveal two components N22 and S22, very similar in appearance to the MERLIN 5-GHz data. However, the relative positions of the two 22-GHz components show them to be significantly further apart than those from the MERLIN 5-GHz data, leading to the question of whether the 22-GHz sources are the same as those observed at 5 GHz.
The brightness temperatures of N22, S22 and S5 are K, K and K respectively, all consistent with an origin in a photo-ionized circumstellar envelope where the photo-ionization equilibrium temperature is typically K. In contrast, this is about two orders of magnitude lower than the brightness temperature of K for N5, which clearly indicates a non-thermal origin.
The separation of S22 and N22 ( at a position angle of ) is very close to that ( mas at position angle ) of the optical components (NO and SO) observed with the HST. There is no evidence of intrinsic proper motion in the source at 22 GHz in recent (1999) observations of the source (A. Fink, private communication). The coincidence of the optical and 22-GHz positions, the lack of evidence of intrinsic proper motion, and the thermal nature of the emission from the two 22-GHz components leads us to conclude that the 22-GHz components are the stellar winds associated with the two stellar components imaged with the HST by Niemela et al. (1988). This is the first time that the stellar wind of the companion in a WR binary has been spatially resolved.
In Paper I we concluded that S5 was the thermal emission from the WR-star wind. Indeed, if we take the mean flux value for S5 from our two epochs of MERLIN observations, the spectral index between 22 and 5 GHz for the southern component is , consistent with those observed in the stellar winds of other WC-type WR stars (e.g. Williams 1996). We estimate the diameter of S5 to be mas from the diameter of the S22, since angular size for . This is approximately four times larger than that given in Paper I. However, we feel the diameter presented here is a more reliable estimate.
Additionally, in Paper 1 we identified N5 as non-thermal emission from a wind-wind collision region. If we overlay the 22-GHz and 5-GHz data assuming two southern components originate in the WR star wind (see Figure 4) we can see that the relative separation of the components supports such a model, where the wind-collision region must fall between the two stars.
2.3 Wind parameters for both stellar components
For a steady state, smooth, fully ionized stellar wind having a radial ion density distribution, the free-free radio flux is related to the stellar-wind density i.e. by
| (1) |
where is the frequency in Hz, is the distance in kpc, is the mass-loss rate in M⊙ y-1, the terminal velocity of the wind in km s-1; , , and are respectively, the number of electrons per ion, the mean charge per ion, the mean atomic weight and the Gaunt free-free factor, a function of electron temperature and frequency. It follows from (1) that
| (2) |
Thus, the measurement of radio emission from the two stellar wind components in the WR 146 system leads to the density ratio of the two winds. If the stellar winds are clumped rather than smooth, we can allow for this by replacing in the above with , where is the wind filling factor, assumed to be constant over the radio-emitting region.
In the case of the collision of two spherical winds at terminal velocity, the contact discontinuity between the two winds intersects the line of centres between the stars at the point of momentum balance. If the projected separation of the WR and OB star is , and that of the OB companion from the non-thermal region is , we can then write
| (3) |
where is the ratio of WR and OB-companion wind momenta, . The wind-collision geometry and equation 3 would also be affected by clumping, but this is beyond the scope of the present study.
By defining the ratio of the OB star and WR-star wind densities, , as , then
| (4) |
Knowing and we can now uniquely determine and that satisfy simultaneously both and . An attractive property of these ratios is that they are independent of distance, typically a very uncertain parameter for WR stars and particularly for WR 146.
For the OB companion we will assume that hydrogen and helium are, respectively, singly and doubly ionized, leading to values , , (Lamers & Leitherer 1993) and K. Taking the values of , , K from Willis et al. (1997) for the WR star, and that the fluxes of N22 and S22 are those of the OB star and the WC star respectively, implies that . From Table 2, is mas and is mas, so equation 3 gives . Thus, the ratios of mass-loss rates and wind velocities are and respectively. The largest uncertainty in these ratios arises from . Though this requires knowledge of the relative metallicity and ionization structure within the two winds, the values of and are closely the same and effectively cancel. On the other hand, the mean molecular weights of the two winds are quite different and contributes a factor to the ratio. The relative uncertainty in the observed fluxes provides the bulk of the uncertainty in .
From the deduced velocity ratio and the terminal wind velocity measured for the WC6 star ( km s-1, Eenens & Williams 1994), we derive a terminal velocity of the OB wind of km s-1. This is consistent with those determined for late O-type stars of any luminosity class (Prinja, Barlow & Howarth 1990). However, the deduced ratio (0.19) of mass-loss rates implies a very high mass-loss rate for the OB star, irrespective of the distance to WR 146. For example, if the WC6 star has a mass-loss rate comparable to the average rate derived from radio or from “Standard Model” analyses of optical emission lines ( M⊙ y-1, Willis 1999), that of the OB star would be M⊙y-1. This is comparable to that determined for the O8f supergiant HD 151804 (Bieging, Abbott & Churchwell 1989, Crowther & Bohannan 1997) and almost greater than the mass-loss rates typical of main-sequence O8 stars ( M⊙ y-1, Howarth & Prinja 1989). This result still holds if the true mass-loss rates of WR stars are lower than the value cited owing to clumping since it is really the ratio of s that has been determined. Only if the OB-star wind was clumped would its mass-loss rate be reduced by a factor of .
Throughout the paper we have identified the southern and northern sources as the WR and OB star respectively. If these identifications were switched i.e. WR star is to the north, and the OB star to the south, then the deduced wind velocity of the OB star is greater than km s-1 and the mass-loss rate is 1.4 times that of the WR star. Clearly these parameters are unacceptable given our knowledge of OB-star winds and we dismiss such a source identification as untenable.
The mass-loss rates determined from the measured free-free wind fluxes depend heavily on the adopted distance to WR 146. Therefore, we first re-examine the luminosity of the system using new optical observations.
3 Optical Spectroscopy
3.1 The observations
The spectrum of WR 146 was taken with the blue arm of the ISIS spectrograph on the William Herschel Telescope (WHT) on 1999 June 19. As in Paper I, we observed in the blue, where the relative contribution of the OB companion would be greatest, and avoided the strong 4650Å emission feature from the WR star. The R1200B grating and 1.1 arcsec slit gave a resolution of 0.9 Å. Four integrations, each of 750s, were taken of the star, interleaved with observations of an argon discharge tube for wavelength calibration. The detector used was a EEV42 device.
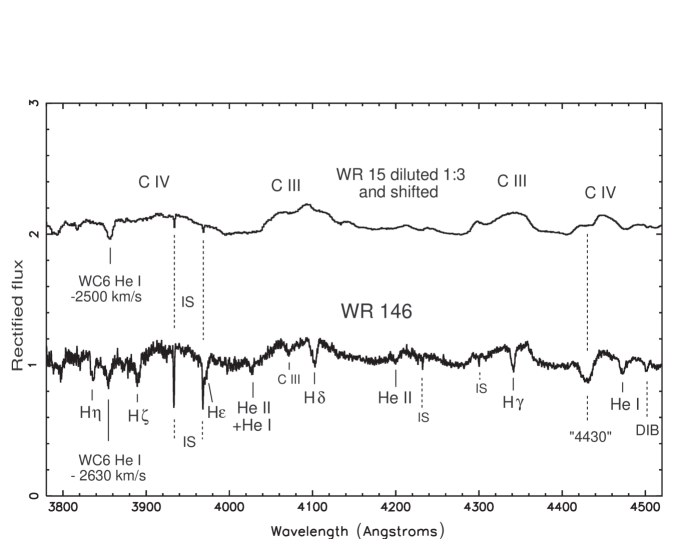
We present the new spectrum of WR 146 in Fig. 5 and list absorption lines in Table 3. The spectrum has been smoothed giving a resolution 1.0 Å (FWHM), as measured from the widths of the narrow interstellar CH, CH+ and Ca i lines. The FWHM of the 3933Å Ca ii line is 1.6 Å, the greater width coming from optical depth effects (cf. Jenniskens & Désert 1994). The well developed interstellar spectrum is consistent with the heavy reddening suffered by WR 146.
The broad undulations in the continuum are mostly emission lines from the WC6 star, diluted by the light from the companion. The emission lines in WR 146 are unusually broad for its WC6 subtype (cf. Eenens & Williams 1994, Willis et al. 1997), making it easier to measure the absorption spectrum of the companion. The absorption line widths are typically 5Å FWHM, comparable for example to those of the O9.5II star Ori (cf. Voels et al. 1989), which has a relatively high (144 km s-1, Howarth et al. 1997).
There is one absorption feature from the WC6 star; the P-Cygni absorption component of the 3889Å He i line, blue-shifted by 2630 km s-1 to 3854.5Å. This line arises from the same metastable level as the 10830Å line from which Eenens & Williams (1994) derived a terminal wind velocity (v∞) of 2900 km s-1 by profile fitting and, like the 10830Å line, is expected to form in the outer regions of the WC6 wind. These results are consistent with the v km s-1 measured by Willis et al. from the [Ne iii] 15.5-m fine-structure line, also formed in the outer wind.
| obs | lab | Identification (and equivalent width, Wλ) |
| 3835.4 | 3835.4 | H |
| 3854.5 | 3888.6 | He i from WC6 star at –2630 km s-1 |
| 3889.6 | 3889.0 | H (?+ 3888.6 He i 2s-3p) |
| 3933.4 | 3933.4 | Interstellar Ca ii |
| 3968.3 | 3968.5 | Interstellar Ca ii |
| 3970.4 | 3970.1 | H |
| 4025.9 | 4026.2 | He i 2p-5d + 4025.6 He ii |
| 4071.1 | 4070.3 | C iii 4f-5g |
| 4089.6 | 4088.9 | Si iv Wλ = 0.060.03Å |
| 4102.6 | 4101.8 | H (+4100.0 He ii) |
| 4200.8 | 4199.8 | He ii; Wλ = 0.300.03Å |
| 4226.6 | 4226.7 | Interstellar Ca i |
| 4232.3 | 4232.5 | Interstellar CH+ |
| 4299.9 | 4300.3 | Interstellar CH |
| 4340.9 | 4340.5 | H (?+4338.7 He ii); Wλ = 0.700.05Å |
| 4430 | 4428.9 | DIB “4430” |
| 4472.1 | 4471.5 | He i 2p-4d; Wλ = 0.500.04Å |
| 4501.4 | 4501.8 | DIB |
The other absorption lines (Table 3) are formed in the OB-companion star. Each of the hydrogen lines is blended with the nearby member of the Pickering series of He ii but the relative weakness of the unblended odd-numbered Pickering line at 4200Å and the closer proximity of the hydrogen-line wavelengths to the observed wavelengths suggests that the He ii contribution is relatively small. Helium i is represented by the 4472 and 4026Å lines; the latter is blended with He ii and is therefore not very useful for diagnostic purposes. Other He i lines in the Walborn & Fitzpatrick (1990) atlas of hot-star spectra are not seen in our spectrum. The relative strength of the 4070Å C iii triplet is a little surprising but the continuum here is uncertain as it falls between two emission features from the WC6 spectrum.
In order to establish the continuum in the regions of each of the absorption lines so that we could measure their equivalent widths, we compared our rectified spectrum with that of another WC6 star, WR 15 (HD 79573), artificially diluted so as to match the spectrum of WR 146. The spectrum of WR 15 was observed with the 1.9m telescope at the South African Astronomical Observatory and will be discussed elsewhere. As a by-product of this matching, we estimated the dilution of the WC6 spectrum in WR 146, finding OB:WR 3, consistent with the ratio, OB:WR 21, found by Willis et al. (1997) from stronger emission lines between 4660Å and 6560Å. We are chary of putting too much weight on this result as it depends heavily on the rectification process and the presumption that the WC6 emission lines in WR 146 have the same strengths as those in WR 15. Instead, we concentrate on the absorption lines, to be discussed below.
3.2 Spectral type and luminosity of the OB companion
To investigate the nature of the OB companion, we begin by using the helium-line ratios to estimate its spectral type. Our optical spectrum includes contributions from both NO and SO but the ratios of the absorption lines in the companion will be equal to those measured from our combined-light spectrum, and independent of the dilution by the WR star, provided that the dilution does not change significantly over the wavelength range of the spectrum.
Formal O-star spectra classification is based on the ratio of the 4541Å He ii and 4472Å He i lines. Since the former was not available, we used the 4200Å He ii line from the same series. We formed an empirical calibration of 4472Å/4200Å ratios against spectral type using the line strengths measured for a large ( 100) sample of O stars by Conti & Alschuler (1971) and Conti (1973). Using this calibration, the ratio of our measured equivalent widths (Table 3) indicates a type of O8, with an uncertainty of half a subclass. The type is close to that inferred by Willis et al. from their OB:WR light ratio and an average luminosity for the WC6 star; but this agreement is fortuitous.
The luminosity class criterion adopted by Conti & Alschuler for the middle and late-type O stars was the ratio of the Si iv 4089Å and He i 4143Å lines. Unfortunately, the silicon line is too weak (W 0.06Å) to measure with confidence and the 4143Å line is not seen at all. Another significant He i line that is apparently missing is the 4388Å singlet line. The strength of this relative to that of the 4472Å He i line (“singlet to triplet ratio”) has long been known to be sensitive to luminosity owing to the relative overpopulation of the He i 2 state in extended atmospheres (e.g. Voels et al. 1989 and references therein). Using the equivalent-width measurements by Conti & Alschuler (1971) and Conti (1973), we examined the ratios, W′= Wλ(4388)/Wλ(4472), formed from their observations of the O7.5, O8 and O8.5 stars in their sample. This ratio was found to be a strong diagnostic for Of stars. All the O7.5–8.5 stars having W are Of stars, most of them supergiants. Measurement of the 4472Å line and examination of our spectrum in the region of the 4388Å line indicates that W′ 0.2, strongly suggesting that the O8 star in WR 146 is an Of star, and possibly a supergiant. Unfortunately, the classical Of diagnostic emission features C iii 4630–41Å and He ii 4686Å fall within the strong 4650Å C iii-iv/He ii emission feature from the WC6 star, which extends from 4620Å to 4690 Å in WR 146 (Dessart et al. 2000). This increases the dilution of the OB spectrum to 1:4 in this critical region and we cannot make a formal Of classification.
Further circumstantial support for a high luminosity for the OB star comes from comparison of the 4472Å He i to H ratio with those derived from the Conti & Alschuler and Conti (1973) datasets. On the other hand, we do not observe emission lines corresponding to the ‘unidentified’ features observed in O6–O9.7 supergiants, including the O8If star HD 151804 (Crowther & Bohannan 1997), at 4486Åand 4504Å. Also, the weakness of the Si iv 4089Å line is surprising given the other evidence for high luminosity, but not unique: the Si iv line is barely visible in the spectrum of the O7Iaf star Sanduleak 80 (Walborn & Fitzpatrick 1990). Although we cannot assign a luminosity class, the spectrum points to an extended atmosphere and high luminosity, but not as high as that of HD 151804.
3.3 Spectral line dilution and the HST photometry
With a better idea of the nature of the O8 star, can we reconcile the measured absorption-line strengths in our composite spectrum with the observations by Niemela et al. (1998)? We follow Paper I and Niemela et al. by assigning the northern optical image (NO) to the O8 star on the basis of its closer proximity to the non-thermal radio source and the assumption that its stellar wind has a lower momentum than that of the WC6 star. If we assume that the spectrum of SO is that of a WC6 star, we can estimate the intrinsic equivalent widths in the O8 spectrum from those observed in our combined-light spectrum and Niemela et al.’s photometry of SO and NO. We find 1.4Å for the intrinsic equivalent width of H, which is closer to the average of those measured by Conti (1973) for O8f stars (1.30.3Å) than for ‘non-Of’ O8III–V stars (2.50.2Å), another indication of high luminosity properties for the OB star. Our earlier view (Paper I) that the WC6 star was brighter than the OB star was based on the erroneous assumption of intrinsic absorption-line strengths appropriate for a main-sequence OB star.
The observation of approximately equal B magnitudes for NO and SO is not consistent with the light ratios derived from dilution of the emission-line spectrum of the WC6 star by Willis et al. (1997), and supported by our estimate in Section 2.1. This could be resolved also if the emission lines in the WC6 component were 30–40% weaker than those typical of WC6 stars. This is plausible; as already noted, the star appears to have an abnormally low C/He abundance ratio and the dilution analysis by Willis et al. depends heavily on C iii and C iv lines. Therefore, the very different light ratios originally derived from combined-light spectra in Paper I and by Willis et al. can be reconciled with a model in which WR 146 comprises two stars of approximately equal brightness in the blue and relatively weak lines, those of NO being consistent with other indicators of its high luminosity.
3.4 The nature of the northern component
The H strength (together with HST photometry), the He i singlet-to-triplet line ratio, and the very high mass-loss rate all point to an extended atmosphere for NO. If it is single, it cannot be a main-sequence star but must be luminous. Alternatively, it may itself be an unresolved binary comprising an O8 star with a third component.
If NO was a single, luminous star, we can estimate its absolute magnitude from those of O8I/f and O8III stars ( and , Conti 1988; Vacca, Garmany & Shull 1996). For example, combination of an intermediate luminosity, , which might be appropriate given the apparent absence of the ‘unidentifed’ 4486Å and 4504Å emission lines, with the photometry by Niemela et al. would give for SO and a combined for the WR 146 system. The implied luminosity of the WC6 star, or on the narrow-band system used for WR stars, is significantly greater than those of other WC6 stars (e.g. mean , van der Hucht, in preparation), but this may be another manifestation of the anomalous nature of the WC6 star in WR 146.
Adopting a reddening of , consistent with Paper I and Willis et al. (1997), the combined implies a distance modulus , greater than our distance in Paper I () but consistent with membership of the Cyg OB2 Association (, Massey & Thompson 1991; Torres-Dodgen, Tapia & Carroll 1991). Given the angular distance () of WR 146 from the centre of the association, stronger evidence is needed to confirm membership.
At this distance (1.7 kpc), the mass-loss rates derived for the WC6 and O8 stars are very high: M⊙y-1 and M⊙y-1 respectively. The latter is three times that of HD 151804, whereas the luminosity of NO appears to be lower. Such a system would have stronger emission lines that those in HD 151804, contrary to observations (e.g. 4486Å and 4504Å or H in Dessart et al. 2000, fig 4 compared with Crowther & Bohannan 1997), so the single high-luminosity model for NO is problematic.
If we consider NO to be an unresolved binary in which some of the mass-loss is contributed by a third component, the latter is unlikely to be another O-type star. Since for O stars (Howarth & Prinja 1987), we expect the mass-loss rate of an O+O system to be lower than that of a single star having the same total luminosity. Also, the intrinsic strengths of the H lines from two lower luminosity stars are likely to be greater, in conflict with our combined-light spectrum and the HST photometry.
A model wherein the third component is another WC star suffers neither of these problems. Its spectral subtype would have to be similar to that of SO, or it would have to be fainter, not to have been detected in the combined-light spectra. Its presence could account for some of the anomalous properties (e.g. low C/He) of the WC6 star reported in the studies referred to. It could also modulate the wind of the O8 star flowing towards the wind interaction region, providing a mechanism for the 3.38-y variability in the non-thermal emission reported by Setia Gunawan et al. (2000). To examine this model, separate spectra of NO and SO, e.g. with an adaptive optics system, are needed to see whether NO has a WC companion (or Of emission lines) and to determine its spectrum without dilution.
4 Conclusions
From high-resolution observations with the VLA at 22 GHz and with MERLIN at 5 GHz we have observed all three components of the WR 146 system: the OB and WC6 stellar winds and the non-thermal source where they collide. The source geometry and ratio of stellar wind fluxes allow us to determine the ratios of mass-loss rates and wind velocities independent of distance to the system. From these ratios and the observations of the WC6 star, we derive the wind velocity of the OB star to be km s-1 and its mass-loss rate to be one quarter that of the WC6 star. If the WC6 star has an “average” WR-star mass-loss rate of M⊙ y-1, that of the OB star would be M⊙ y-1, suggesting a very high luminosity object.
Support for high luminosity comes from the optical spectrum of WR 146, which includes both stars. This shows absorption-line ratios formed in the OB companion suggesting it to be a high-luminosity O8 star. If it is a single star, the inferred luminosity places WR 146 at the distance of the Cyg OB2 association. This gives an anomalously high luminosity for the WC6 star but, given its other anomalies, does not rule out this distance. However, the mass-loss rates determined using this distance ( M⊙y-1 for the WC6 star and M⊙y-1 for the O8 star) are awkwardly high and the latter is probably inconsistent with the spectroscopy. Many, if not all, of the observations could be explained if the companion was itself a binary comprising an O8 star and another WC star. This needs to be tested by separate spectra of the two visual components of WR 146. The presence of an unresolved companion to the O8 star could modulate its wind so as to cause the 3.38-y variability in the non-thermal emission reported by Setia Gunawan et al. (2000).
We may not have reached a firm conclusion as to the nature of the stellar companion(s) to the WC star from the new radio and optical observations. However, the ability to study all three radio components of the WR 146 system separately will ensure that this system becomes an archetype for studying the wind-collision phenomenon.
Acknowledgements
This research has made use of data from MERLIN, a UK national facility operated by the University of Manchester, and the William Herschel Telescope, operated on Observatorio del Roque de los Muchachos, La Palma, by the Isaac Newton Group, both on behalf of Particle Physics and Astronomy Research Council; the National Radio Astronomy Observatory Very Large Array, a facility of the National Science Foundation operated under cooperative agreement with Associated Universities, Inc; the University of Michigan Radio Astronomy Observatory supported by the National Science Foundation and the University of Michigan; the South African Astronomical Observatory; and the SIMBAD database, operated at the CDS, Strasbourg, France. The authors are indebted to the referee, Ian Howarth, for his detailed critique of the original manuscript and suggestions for improvements that sharpened our thinking; and to Amy Fink for sharing her observations prior to publication. SMD is indebted to the National Research Council of Canada, Dominion Radio Astrophysical Observatory for supporting this research.
References
- [1] Bieging J.H., Abbott D.C., Churchwell E.B. 1989, ApJ 340, 518
- [2] Conti P.S. 1973, ApJ 179, 181
- [3] Conti P.S. 1988, in Conti, P.S., Underhill, A.B., eds, O Stars and Wolf-Rayet Stars, NASA SP-497, p. 119
- [4] Conti P.S., Alschuler W.R. 1971, ApJ 170, 325
- [5] Crowther P.A., Bohannan B. 1997, A&A 317, 532
- [6] Dessart L., Crowther P.A., Hillier D.J., Willis A.J., Morris P.W., van der Hucht K.A. 2000, MNRAS preprint
- [7] Dougherty S.M., Williams P.M., van der Hucht K.A., Bode M.F., Davis R.J. 1996, MNRAS 280, 963 (Paper I)
- [8] Eenens P.R.J., Williams P.M. 1992, MNRAS 255, 227
- [9] Eenens P.R.J., Williams P.M. 1994, MNRAS 269, 1082
- [10] Eichler D., Usov V.V. 1993, ApJ 402, 271
- [11] Howarth I.D., Prinja, R.K. 1989, ApJS 69, 527
- [12] Howarth I.D., Siebert K.J., Hussain G.A.J., Prinja R.K. 1997, MNRAS 284, 265
- [13] Jenniskens P., Désert F.-X. 1994, A&AS 106, 39
- [14] Lamers H.J.L.M., Leitherer C. 1993, ApJ 412, 771
- [15] Massey P., Thompson A.B. 1991, AJ 101, 1408
- [16] Morris P.W., Brownsberger K.R., Conti P.S., Massey P., Vacca W.D. 1993, ApJ 412, 324
- [17] Niemela V.S., Shara M.M., Wallace D.J., Zurek D.R., Moffat A.F.J. 1998, AJ 115, 2047
- [18] Prinja R.A.K., Barlow M.J., Howarth I.D. 1990, ApJ 361, 607
- [19] Setia Gunawan D.Y.A., van der Hucht K.A., de Bruyn A.G., Williams P.M. 2000, A&A, submitted
- [20] Torres-Dodgen A.V., Tapia M., Caroll M. 1991, MNRAS 249, 1
- [21] Vacca, W.D., Garmany, C.D., Shull, J.M., 1996, ApJ 460, 914
- [22] Voels S.A., Bohannan B., Abbott D.C., Hummer D.G. 1989, ApJ 340, 1073
- [23] Walborn N.R., Fitzpatrick E.L. 1990, PASP 102, 379
- [24] Williams P.M. 1996, in Parades J., Taylor A.R., eds., ASP conference proc., Radio Emission from the stars and the Sun, ASP, San Francisco, p 15
- [25] Williams P.M., Dougherty S.M., Davis R.J., van der Hucht K.A., Bode M.F., Setia Gunawan D.Y.A. 1997, MNRAS 289, 10
- [26] Willis, A.J. 1999, in van der Hucht, K.A., Koenigsberger, G., Eenens, P.R.J., eds, Wolf-Rayet Phenomena in Massive Stars and Starburst Galaxies, IAU Symposium 193, ASP, San Francisco, p. 1
- [27] Willis A.J., Dessart L., Crowther P.A., Morris P.W., Maeder A., Conti P.S., van der Hucht K.A. 1997, MNRAS 290, 371