Detection of CO in the inner part of M 31’s bulge
Abstract
We report the first detection of CO in M 31’s bulge. The 12CO (1-0) and (2-1) lines are both detected in the dust complex D395A/393/384, at 13 ( kpc) from the centre. From these data and from visual extinction data, we derive a CO-luminosity to reddening ratio (and a CO-luminosity to H2 column density ratio) quite similar to that observed in the local Galactic clouds. The (2-1) to (1-0) line intensity ratio points to a CO rotational temperature and a gas kinetic temperature K. The molecular mass of the complex, inside a 25 (100 pc) region, is 1.5 104 .
keywords:
ISM: clouds – (ISM:) dust, extinction – Galaxies: individual: M 31 – Radio lines: galaxies – Methods: observational1 Introduction
The bulk of gas of M 31 lies between 6 and 18 kpc and follows a pattern of thin spiral arms (e.g. Dame et al. 1993, Neininger et al. 1998) . Despite the presence of dust lanes, massive stars, and evolved stars (e.g. O’Connell et al. 1992; Davidge et al. 1997), there is little HI atomic gas in the inner bulge and, up to now, molecular gas had escaped detection: Sofue & Yoshida (1993) reported the detection the 12CO(1-0) line in the dust complex D395/393 at less than 1 kpc from the centre, but this detection was invalidated by Loinard, Allen & Lequeux (1996) who re-observed the same complex with a much better sensitivity. So, the detection of CO in the dust complexes D 478 and D 268, at 2-4 kpc from the centre111We assume a distance to M 31 of 780 kpc (e.g. Holland 1998; Stanek & Garnavich 1998), i.e. 1=3.8pc., by Allen & Lequeux (1993) and Loinard & Allen (1998), was the closest to the centre ever reported. Noting that the CO (1-0) to (2–1) intensity ratio was lower in these clouds than in the Galactic Giant Molecular Clouds, these authors concluded that CO may be so cold in the inner disc of M 31, that its excitation temperature barely exceeds the cosmic background temperature. They thus suggested that although molecular gas and CO could be abundant, the CO mm lines are so weak that they escape detection.
In order to better understand the gas budget at the centre of M 31, we have embarked on a reanalysis of the optical data. We found that the positions observed by Loinard, Allen & Lequeux (1996) were not centred on the darkest dust patches, which prompted us, taking advantage of the installation of new generation mm-wave receivers on the IRAM 30-m telescope, to make new CO observations.
2 Observations
2.1 Distribution of the extinction in the bulge
We used a compilation of optical images of M 31 with resolutions (FWHM) close to 1 arc-sec to locate regions with significant absorption in the bulge of M 31: (1) a frame (/pixel) covering a field of obtained during the course of a 5 yr nova search by Ciardullo et al. (1988); (2) and images (/pixel), covering a field of , collected during an intensive monitoring of M 31’s bulge aimed at micro-lensing detections (Ansari et al. 1997, 1999), hereafter the AGAPE data; (3) images from J. Tonry covering a field (Metzger, Tonry & Luppino 1993). The astrometry (M. Aurière, private communication) of the optical data presents small ( arcsec) distortions on the degree scale; this is insignificant given the size of the beam of the radio telescope ( at 115 GHz and at 230 GHz). We model the photometry of M 31’s bulge with elliptical annuli using the standard surface photometry algorithm developed for IRAF (Jedrzejewski 1987). This model intends to reproduce the light profile along M 31’s bulge without extinction. Hence, the ellipse geometry parameters (centre, ellipticity, position angle) are fitted in this procedure. In addition, to avoid possible perturbations of the fit due to extincted areas, only the median intensity over the elliptical annulus sectors is used. The observed extinction is then defined as A where is the observed brightness and the brightness in the model. This derivation of Aλ, which assumes that the dusty cloud is in front of the bulge, provides a lower bound of the true internal extinction.
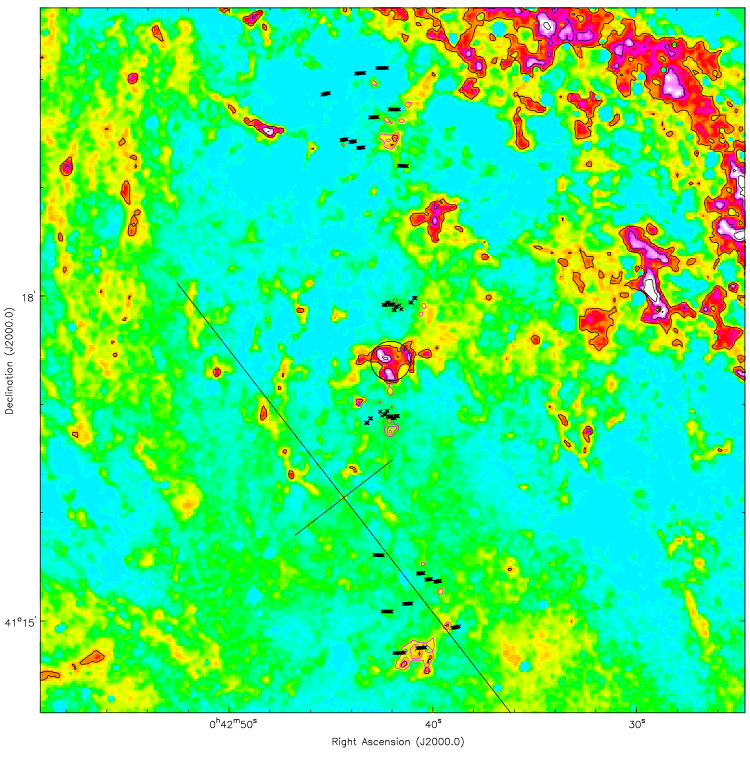
The comparison of 3 completely independent data sets shows that no significant observational artifacts are introduced in the extinction maps. The nominal centre of M 31 is taken as the optical nucleus at and following Crane, Dickel Cowan (1992). Figure 1 shows the extinction obtained in , centred on the dust patch D395A/393. All the structures seen here are well correlated with those seen in . We note that the procedure defining the ellipses tends to remove any smooth structures within 10 arcsec from the centre. The structure in the north-western part is the edge of a much larger extinction pattern; the most prominent structure detected near the centre is D395A/393/384 with a typical size of 95 pc ( arcsec). It is centred at , from the nucleus, and consists of several dark patches or clumps.
2.2 Radio observations
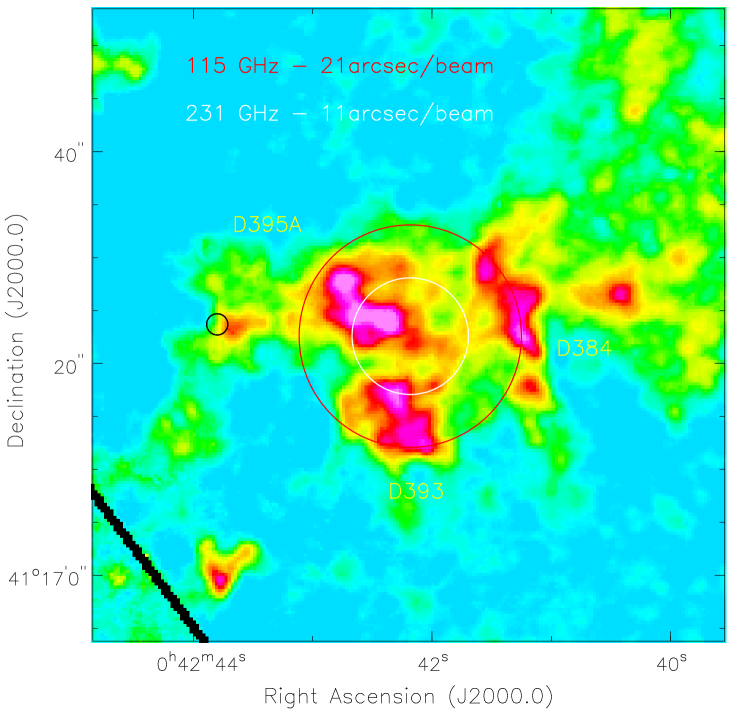
The observations were carried out on 1999 June 13-14 with the IRAM 30-m telescope. Most of the observing was made in the symmetrical wobbler switching mode where the secondary mirror nutates up to a maximum limit of in azimuth. The beam throw was determined as a function of the hour angle in such a way that OFF positions lie in extinction-free regions (see Fig. 1). Near transit, we had to use position switching mode, taking an extinction-free OFF position located at , from the nucleus. Figure 2 show the areas covered by the telescope beam (HPBW) in the ON position at 115 and 230 GHz. The beam is centred as best as possible on the dust complex, and encompasses most of D395A ( and also, at 115 GHz, parts of D393 and D384). The telescope pointing was checked every hour on nearby quasars and found to be accurate within 3 arcsec.

We used four receivers simultaneously, two for 12CO(1-0) at 115 GHz and two for 12CO(2-1) at 230 GHz. Each 115 GHz receiver was connected to two autocorrelator sub-bands, shifted by 40 MHz from each other. Each sub-band consisted of 225 channels separated by 1.25 MHz. A very simple algorithm, combining such a pair of settings, was used to remove occasional “platforming” between the 80 MHz wide units which compose the sub-bands. Each 230 GHz receiver was connected to a filter-bank consisting of 512 1-MHz-wide channels. Linear baselines were fitted and subtracted from the spectra registered every 60 s, after the platforming correction for the data at 115 GHz. Some spectra were flagged, especially for one of the receivers at 230 GHz, due to temporary instabilities. The spectra were then combined, using inverse variance weights, which correspond to the residuals about the baselines.
The resulting spectra are displayed in Fig. 3 and the lines parameters are summarised in Table 1. We estimate that even if the gas in the OFF positions had the same velocity as in the ON position and if the CO luminosity was proportional to AB, we would have decreased at most by per cent the 115 GHz line intensity (see the red contours in Fig. 1). The uncertainties on the line intensities quoted in Table 1 account for the r.m.s. noise and for baseline uncertainties; they do not include calibration uncertainties which, according to a check on the standard source DR21, should be per cent. (We adopted a T flux scale corresponding to integrated 12CO(1-0) and 12CO(2-1) emissions of respectively K km s-1 and K km s-1 at the centre of DR21 – see Mauersberger et al. 1989). We note that, although the spectra of Fig. 3 were observed only 15′′ away from those of Loinard, Allen & Lequeux (1996), the line intensities are much weaker and the velocities completely different from those reported by Sofue & Yoshida (1993). Hence, our detection is more in agreement with the former authors, given their level of sensitivity.
| km s K km s Jy beam-1 | ||||
| km s-1 | ||||
| (1-0) | -156 35 | 0.56 | 3.54 | 0.57 |
| (2-1) | -154 23 | 0.36 | 3.81 | 0.32 |
3 Discussion
3.1 Characteristics of the CO emission
The spectra displayed in Fig. 3 show that the 12CO(1-0) and 12CO(2-1) emission is detected in the heliocentric velocity range km s-1. The measured centroid velocities are in good agreement with the velocities of the ionised gas published by Boulesteix et al. (1987). This suggests that the molecular clouds lie in the same plane as the ionised gas; the latter is thought to be inclined by 45∘ in the region of interest (see the discussion by Ciardullo et al. 1988). At the position observed, the ionised gas presents a velocity gradient of 30 km s-1 over the 21-wide telescope beam. This is consistent with the FWHM of the CO(1-0) line profile (31 km s-1) measured for the molecular complex. This suggests that we are observing not one single, but several clouds distributed across the telescope beam.
The comparison of the intensities expressed as the 12CO(2-1) to (1-0) line ratio R is not straightforward as the beams are different and the geometry of the emitting regions is a priori unknown. If the emitting region were uniform and much larger than the beams, the line intensity ratio would simply be R=T(2-1)/T(1-0)=0.6. We adopt the more realistic assumption suggested above that the dust follows the gas distribution. Integrating the extinction distribution (Fig. 2) over the telescope beam and taking into account the difference in telescope beam shapes and efficiencies between 115 and 230 GHz (Greve, Kramer & Wild 1998), we arrive at a ratio R=0.5. This value is typical of those observed in M 31’s molecular arms (Neininger et al. 1998) but is larger than those observed by Loinard et al. (1996).
3.2 The extinction curve for D395A/393/394

The extinction curve is determined by comparing the extinction in , , and on a pixel basis. Figure 4 shows that the AV/ ratio RV is closer to 2.0 than to the canonical value of 3.1. This cannot be accounted by the geometry of the dust distribution (see Walterbos & Kennicutt (1988) for a comprehensive review). If dust and stars are uniformly mixed along the line of sight, the true extinction would then be increased by a factor of 2, but the extinction curve would still present the same RV. If the dust is located in a thin layer, which is rather plausible if associated with the molecular and ionised gases, the observed extinction, as defined in Sect. 2.1, then corresponds to , where is the real optical depth at a given wavelength and the fraction of light in front of the dust. As observed extinctions as large as 0.49 mag are measured in , the fraction of foreground light has to be smaller than 0.6. This fraction is 0.3 and 0.02 if the dust patch lies in a plane inclined by 45∘ and 77∘ respectively, when using Galactic bulge and disc models from Binney, Gerhard & Spergel (1997). Similar deviations from the average RV have already been reported in a few lines of sight across M 31’s disc (Massey et al. 1995, and references therein): like what is observed in the Galaxy (e.g. Szomoru & Guhathakurta 1999), local fluctuations are also present in M 31.
For , we estimate the extinction AV=0.06 mag beam-1 when averaged over the 115 GHz beam, corresponding to =0.0285 mag beam-1. Given the arguments discussed above, the uncertainties affecting these values are negligible for the following.
3.3 The gas-dust connection
Although it is very dubious to interpret the observed CO luminosity in terms of mass of molecular hydrogen, the ICO/=9.8 K km s-1 mag-1 ratio measured here is remarkably similar to the value observed for the molecular clouds in our Galaxy. Hence, the most direct method to get the order of magnitude for the mass of the gas in this complex is to assume a standard dust-to-gas mass ratio, NH/ = 5.8 1021 atoms cm-2 mag-1 (Bohlin, Savage Drake, 1978). Integrating directly over the distribution of extinction, we derive a mass of 1.5 M⊙ (104 M⊙ in the main solid angle of the beam at 115 GHz). This mass could be overestimated if the metallicity is larger than 1 in the central region of M 31. Continuing, based on the optical extinction map, we find that the size of this complex is about 60 pc; this is typical for a giant molecular complex. However, its average volume density ( cm-3) is extremely low: two orders of magnitude lower than the typical densities in giant molecular clouds. For this reason, this complex must be highly clumped as supported by the detection of these CO lines.
If these clumps are gravitationally bound together, we estimate a virial mass M, i.e. M⊙. The difference of three orders of magnitude compared to the above result based on the optical extinction is so large that either these clumps are not bound together or the mass is not dominated by the gaseous component. For the very same reason, this complex does not follow the velocity line-width versus diameter relationship found by Solomon et al. (1987) for Galactic molecular clouds near virial equilibrium, but presents similar characteristics to the clouds studied by Oka et al. (1998) in the Galactic centre.
4 Conclusions
Emission of the (1-0) and (2-1) lines of the 12CO molecule has been detected near the centre of M 31 at and respectively. The CO centroid velocity of km s-1 suggests that this molecular gas could be located in the ionised gas disc detected in these regions. The observed velocity dispersion of the molecular gas in the beam is compatible with the velocity gradient of the ionised gas. Together with the patchy appearance of the extinction map, this indicates the presence of several clouds distributed over the beam. The ICO/ ratio is remarkably similar to the values observed in molecular clouds in the Galaxy and M 31’s disc. Based on a standard gas-to-dust ratio, the mass of the molecular complex is of order 104 M⊙. In order to reach densities compatible with the excitation of the CO lines, the complex must be highly clumped. As previous studies with poorer resolution have shown, the mass inferred is small compared to the mass content of the Galactic centre (Morris & Serabyn 1996). With such a mass the line-width of the CO line is by far too broad for a gravitationally bound complex, which explains previous inconsistencies based on this assumption.
Accordingly, we modelled the extinction with a random distribution of small spherical clumps, all identical with a size and density . They all lie in a sphere of radius 13, tracing a total mass of M⊙. Models with 250 clumps reproduce the main features of the histogram of measured extinctions. With the previous assumption of a common location for the molecular, ionised gas and the dust, the configuration (r,) which reproduces best the measured extinction correspond to clumps with r2.6 and 400 H cm-3. Following the LVG homogeneous cloud models of García-Burillo, Guélin Cernicharo (1993), the measured line ratio corresponds to CO (1-0) and (2-1) line excitation temperatures and to a kinetic temperature all 10 K. This modelling will be further discussed in a subsequent paper.
The “standard” CO-luminosity to visual extinction ratio and the relatively high CO (1-0) excitation temperature seem to rule out the presence of large amounts of hidden CO and H2 in the inner bulge of M 31, in apparent disagreement with the result of Loinard et al. (1996) in the inner disc.
Acknowledgements
We thank the AGAPE collaboration, R. Ciardullo, G. Jacoby, E. Magnier and J. Tonry for providing their optical data. We are grateful to J. Lequeux for valuable comments. It is a pleasure to thank Richard Frewin for his help with various software issues. During this work, A.-L. Melchior has been supported by a European contract ERBFMBICT972375 at QMW.
References
- [\astronciteAllen and Lequeux1993] Allen R. J., Lequeux J., 1993, ApJ, 410, L15
- [\astronciteAnsari et al.1997] Ansari R. et al., 1997, AA, 324, 843
- [\astronciteAnsari et al.1999] Ansari R. et al., 1999, AA, 344, L49
- [\astronciteBinney et al.1997] Binney J., Gerhard O., Spergel D., 1997, MNRAS, 288, 365
- [\astronciteBohlin, Savage & Drake1978] Bohlin R. C., Savage B. D., Drake J. F., 1978, ApJ, 224, 132
- [\astronciteBoulesteix et al.1987] Boulesteix J., Georgelin Y. P., Lecoarer E., Marcelin M., Monnet G., 1987, AA, 178, 91
- [\astronciteCiardullo et al.1988] Ciardullo R., Rubin V. C., Kent W. J., Jacoby G. H., Ford H. C., 1988, AJ, 95, 438
- [\astronciteCrane, Dickel Cowan1992] Crane P. C., Dickel J. R., Cowan J. J., 1992, ApJ, 390, L9
- [\astronciteDame et al.1993] Dame T. M., Koper E., Israel F. P., Thaddeus P., 1993, ApJ, 418, 730
- [\astronciteDavidge et al.1997] Davidge T. J., Rigaut F., Doyon R., Crampton D., 1997, AJ, 113, 2094
- [\astronciteFitzpatrick1999] Fitzpatrick, E. L., 1999, PASP, 111, 63
- [\astronciteFitzpatrick1999] García-Burillo S., Guélin M., Cernicharo J., 1993, AA, 274, 123
- [\astronciteGreve, Kramer & Wild1999] Greve A., Kramer C., Wild W., 1998, AAS, 133, 271
- [\astronciteHolland1998] Holland S., 1998, AJ, 115, 1916
- [\astronciteJedrzejewski1987] Jedrzejewski R. I., 1987, MNRAS, 226, 747
- [\astronciteLoinard Allen1998] Loinard L., Allen R. J., 1998, ApJ, 499, 227
- [\astronciteLoinard et al.1996] Loinard L., Allen R. J., Lequeux J., 1996, AA, 310, 93
- [\astronciteMassey et al.1995] Massey P., Armandroff T. E., Pyke R., Patel K., Wilson C. D., 1995, AJ, 110, 2715
- [\astronciteMauersberger et al.1989] Mauersberger R. et al., 1989, AAS, 79, 217
- [\astronciteMetzger et al.1993] Metzger M. R., Tonry J. L., Luppino G. A., 1993, in Astronomical Data Analysis Software and Systems II, A.S.P. Conference Series 52, p. 300, R. J. Hanisch, R. J. V. Brissenden, and Jeannette Barnes, eds.
- [\astronciteMorris Serabyn1995] Morris M., Serabyn E., 1996, ARAA, 34, 645
- [\astronciteNeininger et al.1998] Neininger N., Guélin M., Ungerechts H., Lucas R., Wielenbinski R., 1998, Nat, 395, 871
- [\astronciteO’Connell et al.1992] O’Connell R. W. et al., 1992, ApJ, 395, L45
- [\astronciteOka et al.1998] Oka T., Hasegawa T., Hayashi M., Handa T., Sakamoto S., 1998, ApJ, 493, 730
- [\astronciteSofue Yoshida1993] Sofue Y., Yoshida S., 1993, ApJ, 417, L63
- [\astronciteSolomon et al.1987] Solomon P. M., Rivolo A. R., Barrett J., Yahil A., 1987, ApJ, 319, 730
- [\astronciteStanek Garnavich1999] Stanek K. Z., Garnavich P. M., 1998, AJ, 503, L131
- [\astronciteSzomoru Guhathakurta1999] Szomoru A., Guhathakurta P., 1999, AJ, 117, 2226
- [\astronciteWalterbos R. C. Kennicut1988] Walterbos R. A. M., Kennicutt R. C., 1988, AA 198, 61