ISO Spectroscopy of the HH 7-11 Flow and its red-shifted counterpart00footnotemark: 0
Abstract
We have used the two spectrometers on the Infrared Space Observatory to observe the HH 7-11 flow, its red-shifted counterpart, and the candidate exciting source SVS 13, in the star formation region NGC 1333. We detect atomic ([Oi]63m, [Oi]145m, [Siii]34.8m, [Cii]158m) and molecular (H2, CO, H2O) lines at various positions along the bipolar flow.
Most of the observed lines can be explained in terms of shock-excited emission. In particular, our analysis shows that dissociative (J-type) and non-dissociative (C-type) shocks are simultaneously present everywhere along both lobes of the flow. We confirm the low-excitation nature of the Herbig-Haro nebulosities, with shock velocities km s-1. Toward both lobes of the outflow we find pre-shock densities of cm-3 for both the J and C components, implying 100G for . In the central region of the flow, close to the exciting source, the pre-shock density deduced for the C-shock component is cm-3, suggesting a magnetic field 3 times stronger. We propose that the deficiency of gas-phase water in the post C-shock regions is due to freezing onto warm grains processed through the J-shock front and traveling along the magnetic field lines. The total observed cooling from the dissociative shock components is consistent with the power lost by a slow molecular outflow accelerated by a fast neutral Hi wind.
Finally, the skin of the cloud seen in projection toward the flow appears to be weakly photo-ionised by BD +30∘ 549, the dominant illuminating source of the NGC 1333 reflection nebula.
Subject headings:
Stars: formation - (ISM:) Herbig-Haro objects - ISM: individual objects: HH 7-11 - ISM: molecules - Infrared: ISM: lines and bands1. Introduction
Atomic and molecular outflows trace the mass loss from protostellar objects, which is a fundamental characteristic of the formation and evolution of low mass stars. These outflows are often traced by the optical Herbig-Haro (HH) objects, shock-excited nebulosities which mark the interface between outflowing and circumstellar material. One of these systems, which since its discovery (Herbig H74 (1974) ; Strom et al. Setal74 (1974)) has been subjected to a detailed multi-wavelength analysis, is HH 7-11. The system is relatively bright and lies in the very active star forming NGC 1333 region (Aspin et al. ASR94 (1994); Bally et al. Betal96 (1996)). A distance to the outflow of 350pc (Herbig & Jones HJ83 (1983)) is widely adopted in the literature, although Cernis (C93 (1993)) proposes 200pc. Early optical spectroscopic studies show that the HH 7-11 outflow has a complex velocity field and low excitation (Solf & Böhm SB87 (1987); Böhm & Solf BS90 (1990)), a conclusion further supported by near infrared studies (Hartigan et al. HCR89 (1989); Carr Carr93 (1993)). Early on, a well defined CO bipolar outflow was detected associated with this system (Snell & Edwards SE81 (1981); Bachiller & Cernicharo BC90 (1990)), which also is observed in some other molecules like HCO+ and H2O (Mehringer M96 (1996); Cernicharo et al. CBG96 (1996)).
The HH 7-11 outflow has an unusual morphology; the blue outflow lobe is made up of an arc-shaped chain of knots, while the red one is invisible at optical wavelengths. The red lobe is, however, detected in the (1-0)S(1) H2 line at 2.12m having a very ragged appearance (see Fig 1). Both lobes have a total extension of 2′. It has been thought that the driving source of the outflow is the infrared star SVS 13 (Strom et al. Setal76 (1976)), a conclusion partially supported by the proper motion measurements of the knots (Herbig & JonesHJ83 (1983)) and the source observed outbursts (Goodrich G86 (1986); Eislöffel et al. Eetal91 (1991); Liseau et al. LLM92 (1992)). The source has a luminosity of (Molinari et al. MLL93 (1993)). Recent high angular resolution ( 0.′′3) VLA continuum observations at 3.6 cm suggest another nearby embedded source (VLA 3) as a likely candidate, based on its better alignment with the HH string. Interferometric observations (Bachiller et al. Betal98 (1998)) at 1.3 and 3.5 mm with better than resolution, however, have not confirmed this. The interferometric observations have led to the discovery of a second jet emanating from a more deeply embedded source 14.′′5 away from SVS 13, named SVS 13B (Grossman et al. Getal87 (1987)).
One of the reasons why the HH 7-11 flow has been so intensively studied (see e.g. Reipurth R94 (1994)), is that it was the first system showing clear signatures of a high velocity outflow in both neutral and molecular gas tracers (Lizano et al. Letal88 (1988); Rodriguez et al. Retal90 (1990); Giovanardi et al. Getal92 (1992)). This was a major step forward in the interpretation of molecular outflows as being driven by faster but more tenuous (than the outflow entrained gas) atomic stellar winds (Masson & Chernin MC93 (1993); Raga et al. Retal93 (1993)). This has led to a more careful analysis of the energetics and shock conditions associated with the ionic/atomic and molecular gas outflows (Raga Ra91 (1991)). HH 7-11 is also one of the few examples where it is possible to disentangle the contributions of shock excited and fluorescent emission from its near infrared H2 spectra (Gredel G96 (1996); Fernandes & Brand FB95 (1995); Everett E97 (1997)).
In the present study, we take advantage of the capabilities of the Infrared Satellite Observatory (ISO, Kessler et al. Ketal96 (1996)) spectrometers to study the mid- and far infrared emission line spectra from the HH 7-11 red and blue lobes and around the driving source SVS 13. The observations are described in Sect. 2; the results are presented and discussed in Sect. 3 and following, and the main conclusions are summarised in Sect. 9.
2. Observations and Data Reduction
| Object | (1950) | (1950) | AOT | Rev | Obs. Time |
|---|---|---|---|---|---|
| SVS 13 | 03 25 58.1 | 31 05 44.1 | LWS01 | 654 | 4053 |
| SWS02 | 814 | 1730 | |||
| HH 7 | 03 26 02.7 | 31 05 10.2 | LWS01 | 654 | 3165 |
| LWS04 | 831 | 2428 | |||
| SWS02 | 652 | 1464 | |||
| HH 10 | 03 25 59.8 | 31 05 28.8 | SWS02 | 847 | 1730 |
| Red Lobe 1 (RL 1) | 03 25 54.3 | 31 06 34.1 | LWS01aafootnotemark: | 654 | 3165 |
| LWS04aafootnotemark: | 831 | 2428 | |||
| SWS02 | 652 | 1464 | |||
| Red Lobe 2 (RL 2) | 03 25 55.4 | 31 06 42.1 | SWS02 | 847 | 1730 |
We used the two spectrometers on the ISO satellite to observe several locations along the HH 7-11 flow, its optically invisible counterflow and the candidate exciting source SVS 13. The Long Wavelength Spectrometer (LWS, Clegg et al. Clegg96 (1996)) was used in its LWS01 grating mode to acquire full low resolution (R 200) 43-197m scans with data collected every 1/4 of a resolution element (equivalent to 0.07m for 90m, and to 0.15m for 90m); a total of 19 scans were collected, corresponding to 38s integration time per spectral element. The LWS was also used in LWS04 Fabry-Perot (FP) mode to collect high (R 8000) resolution scans of the [Oi]63m line; 52 scans sampled at 1/4 of the resolution element (i.e., 0.0017 m, or 8 km s-1) were collected, equivalent to an integration time of 100s per spectral element. The Short Wavelength Spectrometer (SWS, de Graauw et al. DGetal96 (1996)) was used in its SWS02 grating mode to observe line scans at medium resolution (R 2000) for selected wavelength regions covering the [Siii]34.8m and [Neii]12.8m fine structure lines, and the pure rotational transitions of molecular hydrogen from (0-0)S(1) to (0-0)S(7). All relevant information is summarised in Table 1, including the Astronomical Observation Templates used, the revolution number and the total observing time of the observations.
LWS data processed through Off-Line Processing (OLP), version 7, have been reduced using the LWS Interactive Analysis111LIA is available at http://www.ipac.caltech.edu/iso/lws/lia/lia.html (LIA) Version 7.2. The dark current and gain for each detector were re-estimated, and the data were recalibrated in wavelength, bandpass and flux. The absolute flux calibration quoted for LWS in grating mode is 10-15% and it is valid for point-like sources since the primary calibrator, Uranus, is point-like to the LWS beam; however, our sources are not rigorously point-like and we adopt a more conservative number of 20%. Additional processing for the FP data (with the LIA routine FP_PROC) included a gain correction to compensate for the incorrect positioning of the grating during the FP observations. The integrated [Oi]63m line fluxes obtained with the FP are about a factor of 2 lower than the values measured using the grating. This discrepancy is larger than the 30% figure generally quoted for the absolute flux calibration of the FP (Swinyard et al Swin98 (1998)). We cannot offer any explanation for this difference, and in this paper we will not use the line fluxes measured with the FP. The accuracy of the FP wavelength calibration is believed to be better than 1/2 resolution element, or 15 km s-1.
SWS data were processed using OSIA, the SWS Interactive Analysis222OSIA is available at http://www.mpe.mpg.de/www_ir/ISO/observer/osia/osia.html . Dark currents and photometric checks were revised; in many cases the former were corrupted on a few detectors and were re-estimated and subtracted. The March 1998 bandpass calibration files have been used to produce the final spectra. The absolute flux calibration for SWS data should be accurate to within 20%.
The final steps of data analysis were done using the ISO Spectral Analysis Package333ISAP is available at http://www.ipac.caltech.edu/iso/isap/isap.html (ISAP) Version 1.5 for both LWS and SWS. Grating scans (LWS) and detectors spectra (SWS) were averaged using a median clipping algorithm optimised to flag and discard outliers mainly due to transients; line fluxes were estimated by means of gaussian fitting (multiple gaussians in case of blended lines). The LWS observations toward HH 7 and the red lobe (RL 1+2) were heavily fringed due to the vicinity of the relatively strong continuum source SVS 13; standard techniques available under ISAP were used to remove these instrumental effects.
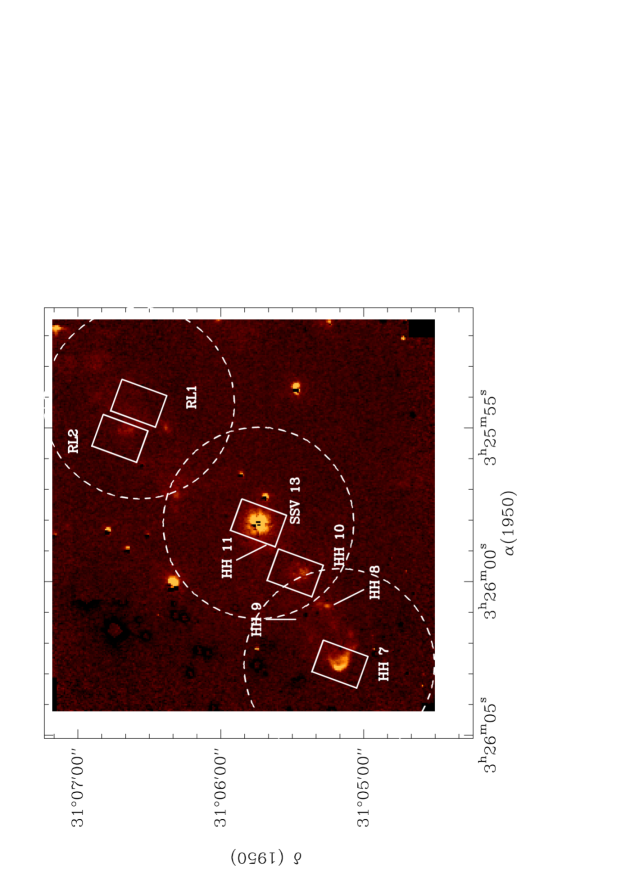
The locations of the observed positions and instrument apertures are shown in Fig. 1 superimposed on an H2 (1-0)S(1) 2.12m continuum-subtracted map obtained with the near infrared camera at the 60′′ Mt. Palomar telescope (Murphy et al. Metal95 (1995)). The apertures of the two ISO spectrometers are quite different. The SWS focal plane aperture is 14′′x20′′ for all of the detected lines except for [Siii]34.8m (20′′x33′′) so that, at each pointing, the contamination from nearby knots should be negligible. The LWS aperture is rather large (80′′, Swinyard et al. Swin98 (1998)); the pointing on SVS 13 also includes HH 11 and 10 and two sources VLA 3 and SVS 13B (see Sect. 1), while that centered on HH 7 also includes HH 8, 9 and 10.
3. Results
Table 2 presents the fluxes for the lines detected toward each location. One sigma upper limits are given only for lines observed with dedicated SWS02 “line scans” AOTs but not detected (see Tab. 1); a horizontal dash means that no observation is available for that particular line.
| Line | SVS 13 | HH 7 | HH 10 | Red Lobe 1 | Red Lobe 2 |
|---|---|---|---|---|---|
| SWS Lines | |||||
| (0-0)S(1)ddfootnotemark: | 4.0(0.5) | 2.6(0.5) | 5.5(0.5) | 4.5(0.7) | 4.2(0.5) |
| (0-0)S(2)eefootnotemark: | 7.9(2.6) | 13.3(1.9) | 6.9(1.2) | 7.6(2.1) | 8.3(2.5) |
| (0-0)S(3)eefootnotemark: | 9.3(0.8) | 10.2(0.7) | 12.5(1.1) | 10.6(0.9) | 7.8(0.8) |
| (0-0)S(4)eefootnotemark: | 4.2(0.6) | 10.9(1.0) | 5.3(0.6) | 4.2(0.8) | 3.1(0.7) |
| (0-0)S(5)eefootnotemark: | 9.9(2.0) | 15.5(1.9) | 9.9(1.5) | 8.7(2.0) | 11.9(2.4) |
| (0-0)S(6)eefootnotemark: | 2 | 3 | 3 | ||
| (0-0)S(7)eefootnotemark: | 4 | 5 | 5 | ||
| [Neii]12.8mddfootnotemark: | 0.7 | 0.9 | 0.7 | 0.9 | 0.8 |
| [Siii]34.8mggfootnotemark: | 7.4(2.3) | 3.6(1.1) | 6.8(2.2) | 5.5(1.0) | 3 |
| LWS Lines | |||||
| CO 20-19fffootnotemark: | 5.4(1.7)bbfootnotemark: | ||||
| CO 19-18fffootnotemark: | 13.7(2.0)bbfootnotemark: | ||||
| CO 18-17fffootnotemark: | 13.0(4.6)bbfootnotemark: | ||||
| CO 17-16fffootnotemark: | 10.1(1.7)bbfootnotemark: | 8.4(3.0)ccfootnotemark: | 6.6(1.2) | ||
| CO 16-15fffootnotemark: | 10.1(1.7)bbfootnotemark: | 5.7(1.5)ccfootnotemark: | 3.9(0.6) | ||
| CO 15-14fffootnotemark: | 13.2(6.3)bbfootnotemark: | 8.5(2.8)ccfootnotemark: | |||
| CO 14-13fffootnotemark: | 10.1(2.7)bbfootnotemark: | 6.6(2.1)ccfootnotemark: | |||
| o-H2O 3(0,3)-2(1,2)fffootnotemark: | 12.2(6.3)bbfootnotemark: | 6.5(2.8)ccfootnotemark: | |||
| o-H2O 2(1,2)-1(0,1)fffootnotemark: | 6.8(3.8)bbfootnotemark: | 7.9(1.5)ccfootnotemark: | |||
| [Oi]63mfffootnotemark: | 180(2)bbfootnotemark: | 131(3)ccfootnotemark: | 109(3) | ||
| [Oi]145mfffootnotemark: | 8.0(4.0)bbfootnotemark: | 4.6(1.0)ccfootnotemark: | 7.9(1.3) | ||
| [Cii]158mfffootnotemark: | 21.3(1.4)bbfootnotemark: | 12.5(1.1)ccfootnotemark: | 15.2(0.7) | ||
Detected lines are also plotted in Figs. 2a, b, c and d; most of them are detected everywhere. Exceptions are [Siii]34.8m, which is not detected toward RL 2, ortho-H2O which is not detected toward RL 1+2, and [Neii]12.8m which is not detected anywhere. All lines, except [Siii]34.8m and the H2 lines, are stronger on the SVS 13 position.


The FP spectra of the [Oi]63m line toward HH 7 and RL 1+2 are presented in Fig. 3. The lines are resolved (30 km s-1) with deconvolved FWHM of 50 km s-1and 25 km s-1 for the two positions; these widths are consistent with the velocity field traced by the [S II]6717Å line (Stapelfeldt S91 (1991)) toward HH 7, and suggest that [Oi]63m originates from the flow material.
4. The Gas Physical Parameters
4.1. H2
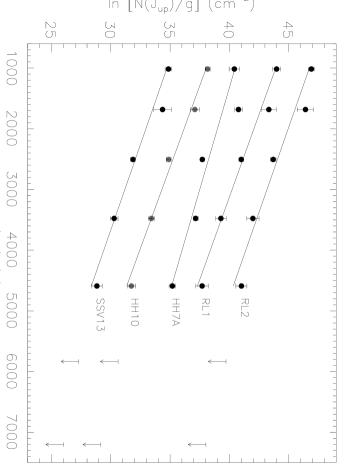
The observed H2 lines arise from quadrupole rotational transitions of the ground vibrational state so that they are likely to be optically thin. The radiative lifetimes range from 0.54 yrs for level =0, J=7 where line (0-0)S(5) originates, to yrs for level =0, J=2 which is the upper state for (0-0)S(0) transition; thus these levels are collisionally populated, and a simple LTE analysis is adequate to interpret the data (e.g., Gredel G94 (1994)). Einstein coefficients and wavenumbers were taken from Black & Dalgarno (BD76 (1976)) and Dabrowski (D84 (1984)); ortho/para=3 has been assumed. We dereddened the H2 line fluxes using the visual extinction given by Gredel (G96 (1996)) for the individual HH knots, and the Rieke & Lebofsky (RL85 (1985)) extinction curve. Dereddened line fluxes were used to produce the Boltzmann plots shown in Fig. 4; a single temperature fit is in good agreement with the observed fluxes at all positions. The solid angles of line emitting regions are arbitrarily set to the equivalent SWS focal plane aperture, i.e. 14′′ x 20′′ or 6.6 sr (valid for all detected H2 lines but S(1), where the solid angle is 30% higher), assuming a beam filling factor of 1.
The H2 temperatures and the SWS beam averaged column densities, together with 1 uncertainties are listed in Table 3. The H2 column densities should be considered as lower limits because the beam filling factor can be less than 1. The H2 temperatures vary by less than 15% along the flow and appear to trace an H2 component (which we call “warm”) which is colder than the one identified by Gredel (G96 (1996)) via higher excitation H2 ro-vibrational lines (2100 K T 2750 K, which we will call “hot”). The column densities for the warm H2 (see Table 3, col. 3) are on average two orders of magnitude higher than those of the hot H2 (Gredel G96 (1996)) and the difference cannot be explained by the smaller (a factor 2) emitting areas adopted by Gredel444We believe that Table 3 of Gredel (G96 (1996)) incorrectly reports the H2 column densities; based on the explanation in note of that Table, the total column densities should be a factor ten higher than reported in its column 7. Furthermore (R. Gredel, priv. comm.) the IRSPEC slit was not aligned exactly on the peaks of the individual knots, suggesting that quoted column densities should more conservatively be considered as lower limits. . This suggests that the two H2 components may be actually distinct.
| Object | T | N(H2) |
|---|---|---|
| (K) | (1020 cm-2) | |
| SVS 13 | 560(20) | 0.7(0.1) |
| HH 7 | 670(20) | 0.5(0.1) |
| HH 10 | 540(10) | 1.0(0.1) |
| RL 1 | 540(20) | 0.9(0.2) |
| RL 2 | 560(20) | 0.8(0.1) |
4.2. CO
CO rotational lines have been detected at all three positions observed with LWS, although the intensity and number of detected lines are highest toward SVS 13. More CO lines than those reported in Table 2 are marginally visible in our spectra toward the two flow positions, but it is impossible to reliably determine their flux because of the heavily fringed LWS spectra. Contrary to the H2 lines, the CO rotational spectrum arises from dipole transitions and the simplifying assumptions of optically thin lines cannot be adopted a priori. We analysed the CO lines using the LVG model described in Ceccarelli et al. (Cetal98 (1998)). Under NLTE conditions the line ratios depend both on the gas temperature and density, as well as on the CO column density if the lines are optically thick. The observed CO lines cannot constrain the three parameters simultaneously. The distribution of CO line fluxes vs J toward SVS 13 is essentially flat, and we find a range of physical conditions which are consistent with our observations. We find, as extreme cases, a ‘cold’ solution with T350 K and cm-3, and a ‘warm’ solution with T900 K and cm-3; the model also predicts optically thin CO lines. Interestingly, this temperature range is centered around the value independently derived from H2 lines, which suggests that the CO and H2 emission come from the same region. For T=560 K (the H2 temperature toward SVS 13, see Table 3) we obtain cm-3. The CO line ratios toward HH7 and RL 1+2 imply temperatures and densities similar to those around SVS 13, although the lower absolute line fluxes would suggest column densities or beam filling factor about a factor two lower. Using the SWS beam solid angle we derive N(CO) cm-2 toward the SVS 13 LWS pointing, giving a direct measurement of the CO abundance in this warm gas of [CO]/[H]. Based on this number it seems that CO accounts for essentially all of the gas-phase carbon in the interstellar medium (Cardelli et al. CMJS96 (1996)). Recently Lefloch et al. (Letal98 (1998)) found evidence of CO depletion toward the core of SVS 13, likely due to condensation onto grains in the dense environments close to SVS 13. We find no evidence of such a depletion in the high-J CO line emitting region, suggesting that all of the CO locked into the grain mantles has been returned to the gas-phase.
4.3. H2O
As far as H2O is concerned, since only the 3(0,3)-2(1,2) 174.6m and 2(1,2)-1(0,1) 179.5m lines of ortho-H2O have been detected in SVS 13 and HH 7, it is clear that water plays only a secondary role in gas cooling (see Table 4) compared to some other cases of outflow exciting sources such as IC 1396N (Molinari et al. Metal98 (1998)) or L1448-mm (Nisini et al. Netal99 (1999)). This result goes against earlier suggestions based on previous =1.67 mm water line observations (Cernicharo et al. CBG96 (1996)), that the emission originates in dense (106 cm-3) shocked material with a water abundance comparable to that of CO. It should be noted, however, that Cernicharo et al. assumed a gas temperature of 50 K, while our observations of H2 and CO lines clearly indicate that the temperature of the molecular material is a factor of 10 higher. The maps presented by Cernicharo et al. show that water emission is concentrated within ″ region centered on HH 11. Adopting T = 560 K and n = 4 cm-3, compatible with the conditions for H2 and CO, our model fit (Ceccarelli et al. Cetal98 (1998)) to ISO and millimeter water lines predicts optically thick lines and a water column density N(H2O) cm-2, about a factor 20 lower than that estimated by Cernicharo et al. An abundance [H2O]/[H2] is also derived assuming that the lines from two molecules come from the same gas component; we will prove this assumption in Sect. 6.
5. The Photo-Dissociation Region
In spite of the shock-excited nature of the HH objects, it is likely that a non-negligible contribution to the observed line emission actually come from an extended Photo-Dissociation Region (PDR, Tielens & Hollenbach TH85 (1985)) component associated with the NGC 1333 cloud. This is suggested by low dispersion ISO-LWS observations (Caux et al. Cetal00 (2000)) at various positions in the NGC 1333 cloud, which show a widespread [Oi]63m and [Cii]158m emission; this extended component seems to account for 20% of the [Oi]63m, and all of the [Cii]158m emission we see from our LWS pointings. Our FP data (Sect. 2) confirm that only a small fraction of the [Oi]63m line may come from a quiescent PDR component.
Using the PDR Toolbox555The “PDR Toolbox” is available at http://dustem.astro.umd.edu and contains downloadable FIR lines diagnostic information about PDRs. The tool has been created by L. Mundy, M. Wolfire, S. Lord and M. Pound, and it is based on the new PDR models of Kaufman et al. (KWHL99 (1999))., the observed [Cii]158m emission requires a relatively faint FUV irradiation level of G10 in units of local Galactic FUV flux (Habing H68 (1968)). Although SVS 13 might be able to provide the required FUV field, the widespread [Cii]158m emission seen by Caux et al. (Cetal00 (2000)) clearly suggest an external irradiation source. A natural candidate is BD +30∘ 549, the B6 star responsible for the illumination of the NGC 1333 reflection nebulosity (Harvey et al. Hetal84 (1984)); located 0.8 pc N-NE of the HH 7-11 area, it can certainly provide the needed G FUV field. In this regime, the PDR surface temperature does not exceed 100 K (Kaufman et al. KWHL99 (1999), Timmermann et al. Tetal96 (1996), Kemper et al. Ketal99 (1999), Liseau et al. Letal99 (1999)) which excludes a PDR origin for the [Siii]34.8m line (Hollenbach, Takahashi & Tielens HTT91 (1991)), the H2 and the CO lines. Indeed, the temperature of the molecular material is at least 5 times higher, and the molecular emission does not appear to be extended as one would expect for a PDR origin; ISOCAM-CVF near-IR imaging spectroscopy of the HH 7-11 region extracted from the public ISO data archive666The ISO archive is available at http://pma.iso.vilspa.esa.es shows that the emission from the same H2 rotational lines observed with SWS is concentrated along the flow and peaks in correspondence of visible HH objects (Noriega-Crespo et al. Nor00 (2000)), obviously favouring a shock origin for these lines.
6. Shocks along the Flow
| Species | HH 7 | HH 10 | SVS 13 | RL 1 | RL 2 |
|---|---|---|---|---|---|
| [Oi]63m | 4.8 | 6.6 | 4.0 | ||
| CO | 2.0 | 3.0 | 1.4 | ||
| H2O | 0.7 | 0.7 | |||
| H2 | 2.3 | 1.9 | 1.6 | 1.7 | 1.6 |
| [Siii]34.8m | 0.13 | 0.25 | 0.27 | 0.20 | |
It is known that the nature of the shock excitation is dramatically influenced by the presence of a magnetic field component perpendicular to the shock velocity which prepares the up-stream medium and smoothes out the effect of the front passage. The differences in the physical conditions of shocked gas are such that two distinct classes of shocks, C(ontinuous) and J(ump) have been idealised (Draine D80 (1980)). In a J-shock the temperature reached by the shocked material depends on the square of the shock velocity and can be as high as 105 K, resulting in complete molecular dissociation. In C-shocks, the temperature rarely exceeds a few thousand degrees and molecular material can survive. These two very different physical scenarios produce distinctive signatures in terms of cooling ratios between different species, and of line ratios within the same species. We will show that our data of the HH 7-11 region depict a complex situation where the two types of shock coexist; to help the discussion below, we report in Table 4 the total cooling rates in the various species as, when applicable, derived from the models used to estimate their physical parameters.
6.1. J-shocks
First of all we note that the non-detection of the [Neii]12.8m line down to a level of 10-20 W cm-2 confirms the low-excitation nature of the HH 7-11 chain and suggests (Hollenbach & McKee HM89 (1989), hereafter HM89) a shock velocity v km s-1, depending of the pre-shock density, in excellent agreement with our high-resolution FP [Oi]63m observations (Sect. 2) and with estimates from optical spectroscopy (Böhm, Brugel & Olmsted BBO83 (1983); Solf & Böhm SB87 (1987)). This upper limit on the shock velocity excludes strong shocks, yet the detection of [Siii]34.8m requires the presence of a dissociative shock component, since negligible ionization is expected from a C-shock (HM89). Such a component would also explain the observed [Oi]63m cooling, since the latter is expected to be the main coolant in J-shocks777Copious [Oi]63m can also be produced in non-dissociative shocks. In this case however, the presence of H2 would allow the incorporation of O into water, via the chain of endothermic reactions O + H2 OH + H and OH + H2 H2O + H. This chain has an activation energy of T 220 K, lower than the H2temperature estimated from the rotational lines (between 540 and 670 K, see Table 3); we conclude that the observed [Oi]63m emission cannot originate in C-shocks.. In order to compare the [Oi]63m with the [Siii]34.8m line for HH 7 and SVS 13, we need to determine the fraction of [Oi]63m emission due to other HH objects falling within the LWS beam.
The LWS beam centered on HH 7 also contains HH 8, 9 and 10; since the excitation conditions for the different HH objects along the flow do not show dramatic variations (Hartigan, Curiel & Raymond HCR89 (1989)), we choose to use the detected [Siii]34.8m lines toward HH 7 and HH 10 as weights to estimate the [Oi]63m cooling intrinsic to HH 7. We conservatively assign to HH 8 and HH 9 the same [Siii]34.8m flux measured toward HH 7, and we also consider that the weighting of the LWS beam profile decreases the contribution of HH 8-9 and HH 10 to the [Oi]63m measured on the HH 7 pointing by 10% and 50%, respectively. Similar estimates can be done for the SVS 13 pointing, where again HH 10 contributes at a 50% level. The HH 11’s contribution does not need to be disentangled since it also contributes to the [Siii]34.8m line of SVS 13. No correction is required for the RL 1+2 pointing. Taking the above into account, we obtain [Oi]63m/[Siii]34.8m line ratios between 15 and 20, suggesting a pre-shock density cm-3 (HM89). The models can also reproduce the absolute fluxes, provided that the emission solid angles are 5′′ in diameter with filling factor of 1; more intense Oi and Siii lines on the central position are likely due to slightly larger solid angles and/or filling factors.
As concerns molecular cooling the main contribution to H2 emission in J-shocks is predicted (HM89) to come from material excited by FUV or H2-formation pumping. Indeed, Fernandes & Brand (FB95 (1995)) propose a fluorescent origin for the near-IR H2 lines toward HH 7. For the (0-0)S lines however, the predicted line ratios are not reproduced by the observations. In particular the S(7) line, which is predicted to be always brighter than the S(5) line irrespectively of pre-shock density and shock velocity, is not detected at all in our SWS spectra888The above mentioned ISOCAM-CVF observations (at lower spectral resolution than the SWS) actually detected the S(7) but with a flux about 4 times lower than the S(5) line flux, compatibly with our SWS upper limits on the S(7) line (Noriega-Crespo et al. Nor00 (2000))..
6.2. C-shocks
When interpreted in terms of non-dissociative shock, the pure rotational H2 lines provides a sensitive probe for the shock velocity, given the four orders of magnitudes of dynamical range spanned by their line ratios. This is shown in Fig. 5, which presents the observed H2 line ratios superimposed on a grid of C-shock models from Kaufman & Neufeld (KN96 (1996)).

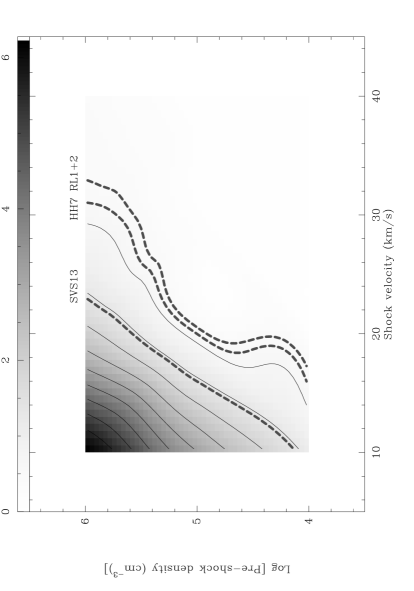
Our observations seem to place quite stringent boundaries to the shock velocity, km s-1. The corresponding gas temperature, K (Kaufman & Neufeld KN96 (1996)), is in good agreement with the values derived using simple LTE analysis (Sect. 4), as expected since the molecular gas is collisionally heated by the C-shock front. Observed absolute fluxes can also be reproduced by the model as long as the emission solid angle does not exceed few arcsecs in diameter. We note that such a low velocity shock would also produce very faint S(6) and S(7) lines. Once the shock velocity is determined, we can use the CO/H2 cooling ratio to estimate the pre-shock density. Fig. 6 presents such a diagnostic diagram.
The CO line fluxes in the three LWS pointings should be corrected for contamination by the other HH objects. In similar way as for the [Oi]63m/[Siii]34.8m ratio, we use the H2 coolings in different positions as weights to split the individual contributions to the CO cooling. The corrected cooling ratios are reported as dashed lines in Fig. 6. We see that a shock velocity km s-1 would correspond to a pre-shock densities of cm-3 for HH 7 and RL 1+2, and cm-3 for SVS 13.
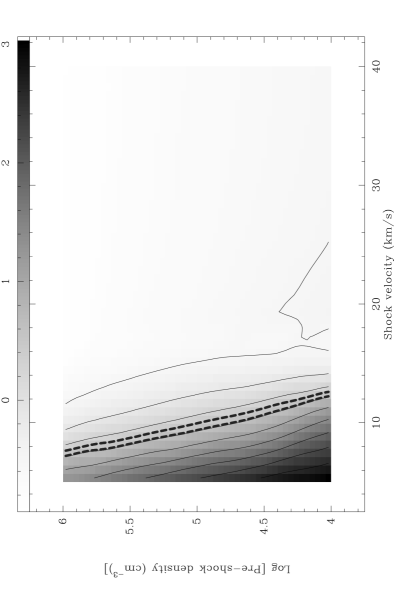
Water is an important diagnostic for C-shock models. H2O cooling is a fast function of the shock velocity since free atomic oxygen in the post-shock gas is expected to be incorporated into water as soon as the temperature rises above K, roughly corresponding to km s-1 (Draine, Roberge & Dalgarno DRD83 (1983), Kaufman & Neufeld KN96 (1996)). In our case then, where the temperature is 600 K, cooling via H2O rotational transitions is expected to be dominant with respect to that of CO. Instead, the diagnostic diagram in Fig. 7 shows that the observed CO/H2O cooling ratio is consistent with shock velocities km s-1, which cannot justify the observed H2 temperatures. This suggests that most of the expected gas phase water is missing. We will propose an explanation for this result in Sect. 7.1
7. The Shocks and the Herbig-Haro Objects
We have shown that HH 7-11 is a complex region where different line emission mechanisms are simultaneously at work. Notwithstanding the poor spatial resolution of our data, the variety of different spectral signatures detected allow us to draw the following physical scenario of the region.
7.1. HH 7
Starting from HH 7, the C-shock conditions diagnosed by the molecular emission clearly require the presence of a magnetic field (Draine D80 (1980)), where is the shock velocity of the C component. Assuming the standard scaling law (Draine D80 (1980)) for the value of
| (1) |
where in the interstellar medium, the estimated cm-3 pre-shock density for the C-shock component on HH 7 gives G. Variations of a factor 3 in each direction are nevertheless possible, since can vary between 0.3 and 3 in molecular clouds (HM89). For similar and , Draine, Roberge & Dalgarno (DRD83 (1983)) have shown that the CJ transition occurs at 50 km s-1, similar to the upper limit set on (the J-shock velocity) by our observations. This means that a significant component transverse to would smooth the shock front to a C type or, equivalently, that our observed J-shock component can only exist as long as . When the bowshock-like morphology of HH 7 is also considered, as revealed by HST NICMOS 2.12m images (A. Cotera, priv. comm.), then a very simple scenario emerges where HH 7 is immersed in a roughly parallel to the flow axis. At the tip of the bow and J-shock conditions are present; [Siii]34.8m and most of [Oi]63m flux arise from this region, and favourable conditions also exist to originate the “hot”, T K, H2 emission detected by Gredel (G96 (1996)). Along the sides of the bow, becomes nearly perpendicular to , creating favourable conditions for C-type shocks. This picture also provides a plausible explanation to the problem of the missing water: the water is actually produced in the C-shocks, but rapidly condenses onto dust grains and disappears from the gas-phase. This possibility is suggested by the recent discovery with ISO-LWS (Molinari et al. Metal99 (1999)) of crystalline water ice toward HH 7. The deduced water abundance (in solid state form) is comparable to the interstellar oxygen abundance, which is what the models would predict for gas-phase water in C-shocks; furthermore, the fact that the ice is in crystalline form requires grain temperatures of the order of 100 K, only attainable in dissociative shocks (HM89; Draine, Roberge & Dalgarno DRD83 (1983)). After being heated, the grains would be efficiently transported in the post C-shock regions along the B lines, directed parallel to the flow. For the gas parameters we derived, the grains are efficiently coupled to the magnetic field and are not significantly decelerated by collisions with the neutrals (Draine, Roberge & Dalgarno DRD83 (1983)).
7.2. HH 10
From the viewpoint of the line emission properties, HH 10 and HH 7 appear very similar objects. Although no LWS data were specifically collected toward HH 10, the H2 and the [Siii]34.8m lines still argue in favour of a dual J+C shock nature. From the morphological point of view, HH 10 appears as an irregular blob in the 2.12m image of Fig. 1. Higher spatial resolution images in H and [Sii]6717+31Å from HST (unpublished archival data) resolved HH 10 into a double filamentary structure whose N-S orientation does not appear to be related to the flow direction. However, the H/[Sii]6717+31Å emission ratio is higher in the NW part of this HH object, facing toward SVS 13. A higher ratio implies higher excitation (stronger shocks) conditions, which are likely to be traced by the [Siii]34.8m line and by the ‘hot’, T K, H2 component (Gredel G96 (1996)). If we assume that maintains its direction downstream along the flow, as suggested for HH 7 (see above), then we speculate that the morphology of HH 10 could correspond to irregularities or corrugations in the shocked walls of the cavity which is excavated by the flow. Such irregularities might originate from instabilities at the flow-cavity interface, as proposed by Liseau, Sandell & Knee (LSK88 (1988)), although there are no detailed numerical simulations of the process.
7.3. HH 11 and SVS 13
The interpretation for HH 11 and SVS 13 is more complicated because both sources are contained in the fields of view of the SWS and LWS instruments. Pre-shock densities cm-3 are here found for the C component; this is a factor ten higher than in the other positions of the flow, which is not surprising given the close proximity of the origin of the flow. In these conditions the magnitude of the magnetic field (Eq. 1) could range from G to 1mG. Such high values have been claimed by Hartigan, Curiel & Raymond (HCR89 (1989)) to justify the relative faintness of HH 11 in 2.12m H2 images (see also Fig. 1). The possibility that FIR line emission toward SVS 13 arises in a collapsing envelope around is not relevant here because the predicted [Oi]63m line flux (Ceccarelli, Hollenbach & Tielens CHT96 (1996)) is about 30 times lower than actually observed, while CO and H2O lines are below the detection limit for the present observations. Finally, there is the possibility that a fraction of the line fluxes measured with the LWS originates from the recently discovered embedded outflow source SVS 13B (Bachiller et al. Betal98 (1998)).
7.4. The Red-shifted Lobe
[Oi]63m, [Oi]145m and [Siii]34.8m, together with a complement of H2 and CO lines, have been detected toward the receding lobe, and define shock conditions which are not dramatically different from those present on the blue lobe. It is well known that no optical emission is detected toward the red lobe, and also published images in the H2 2.12m line (Fig. 1, Garden et al. Getal90 (1990), Hodapp & Ladd HL95 (1995)) clearly show fainter emission there. Higher values of dust extinction with respect to the blue lobe have been invoked as an explanation for this asymmetry. Our observations, which trace similar shock conditions for the two lobes, tend to support this possibility.
8. The Shocks and the Molecular Outflow
If J-shocks between stellar winds and ambient material are responsible for the acceleration of the molecular outflow, a correlation (Hollenbach H85 (1985)) is expected between the outflow mass loss rate and the flux of the [Oi]63m line, which is the dominant coolant in such shocks. The predicted mass loss rate, based on the observed [Oi]63m cooling from HH 7, is yr-1 (see also Cohen et al. Cetal88 (1988), Ceccarelli et al. Cetal97 (1997)), in good agreement with the mass loss rate estimated by Lizano et al. (Letal88 (1988), see also Rodriguez et al. Retal90 (1990)) for the fast Hi wind believed to be responsible for the acceleration of the slow CO outflow (Snell & Edwards SE81 (1981)) . This fast neutral wind was also confirmed with CO observations by Bachiller & Cernicharo (BC90 (1990)).
Assuming momentum balance at the interface between the the wind and the ambient medium, Davis & Eislöffel (DE95 (1995), DE96 (1996)) derived a simple relationship between the mechanical power of the wind and the power radiated by the shock :
| (2) |
Since the working surfaces where the winds impact the medium are traced by the J-shocks, we make the assumption . The total cooling due to the near-IR H2 vibrational lines measured by Gredel (G96 (1996)) along the flow is ; we assume a slit width of few arcsecs, so we will conservatively multiply the observed value by 10 to allow for the extension of the HH objects. We estimate the mechanical power of the Hi wind according to:
| (3) |
9. Summary
The HH 7-11 flow, together with its red-shifted counterpart and SVS 13 (the candidate exciting source) have been studied via atomic, ionic and molecular spectroscopy. A complex scenario emerges, where:
-
1.
we have detected atomic ([Oi]63m, [Oi]145m), ionic ([Cii]158m, [Siii]34.8m) and molecular (H2, CO and H2O) lines along the flow (both lobes) and toward SVS 13.
-
2.
the low-excitation shock nature of the HH nebulosities along the flow is confirmed. Spectral signatures of C and J shocks are ubiquitously found along the HH 7-11 flow and its red-shifted counterpart. Our estimates for the shock velocities are km s-1 and 15 20 km s-1. The pre-shock density is cm-3 toward the blue and the red lobe; for the C component only, we find cm-3 at the location of SVS 13.
-
3.
there is indirect evidence for an ordered B field oriented parallel to the direction of the flow. The magnitude of the magnetic field is G on the lobes, increasing to G at the position of the flow origin; these figures, however, can vary of a factor 3 in each direction.
-
4.
the gas-phase in the post C-shock region is deficient in H2O. We presented evidence that this may be due to freezing onto warm grains processed through the J-shock front and traveling downstream along the magnetic field lines.
-
5.
the asymmetry in optical and NIR properties among the two lobes of the outflow is probably not caused by different pre-shock densities or shock velocities, supporting the hypothesis of higher extinction values toward the red lobe.
-
6.
the total J-shock cooling is compatible with the molecular outflow being accelerated by the fast neutral wind detected in Hi and CO.
-
7.
the whole flow area appears to be associated with a faint PDR illuminated by BD +30∘ 549, the source responsible for the illumination of the whole NGC 1333 nebula.
We thank L. Testi and M. Cecere for their assistance with the observations and data reduction of the H2 2.12m image presented in Fig. 1. The staff of the Mt. Palomar 60′′ telescope is also acknowledged. We also thank an anonymous referee whose comments improved the paper, and L.F. Rodriguez for his comments on an early version of this manuscript. The ISO Spectral Analysis Package (ISAP) is a joint development by the LWS and SWS Instrument Teams and Data Centers. Contributing institutes are CESR, IAS, IPAC, MPE, RAL and SRON.
References
- (1) Aspin, C., Sandell, G. Russell, A.P.G. 1994, A&AS, 106, 165
- (2) Bachiller, R., Cernicharo, J. 1990, A&A, 239, 276
- (3) Bachiller, R., Gilloteau, S., Gueth, F., Tafalla, M., Dutrey, A., Codella, C., Castets, A. 1998, A&A, 339, 49
- (4) Bally, J., Devine, D., Reipurth, B. 1996, ApJ, 473, 49
- (5) Black, J.H., Dalgarno, A. 1976, ApJ, 203, 132
- (6) Böhm, K.H., Solf, J. 1990, ApJ, 348, 297
- (7) Böhm, K.H., Brugel, E.W., Olmsted, E. 1983, A&A, 125, 23
- (8) Cardelli, J.A., Meyer, D.M., Jura, M., Savage, B.D. 1996, ApJ, 467, 334
- (9) Carr, J.S. 1993, ApJ, 406, 553
- (10) Caux, E., et al. 2000 (in preparation).
- (11) Ceccarelli, C., Hollenbach, D., Tielens, A.G.G.M. 1996, ApJ, 499, 294
- (12) Ceccarelli, C., Haas, M.R., Hollenbach, D., Rudolph, A.L. 1997, ApJ, 476, 771
- (13) Ceccarelli, C., Caux, E., White, G.J., et al. 1998, A&A, 331, 372
- (14) Cernicharo, J., Bachiller, R., González-Alonso, E. 1996, A&A, 305, L5
- (15) Cernis, K. 1993, Baltic Astronomy, 2, 214
- (16) Clegg, P.E., Ade, P.A.R., Armand, C., et al. 1996, A&A, 315, L38
- (17) Cohen, M., Hollenbach, D.J., Haas, M.R., Erickson, E.F. 1988, ApJ, 329, 863
- (18) Dabrowski, I. 1984, Can. J. Phys., 62, 1639
- (19) Davis, C.J., Eislöffel, J. 1995, A&A, 300, 851
- (20) Davis, C.J., Eislöffel, J. 1996, A&A, 305, 694
- (21) de Graauw, T., Haser, L.N., Beintema, D.A., et al. 1996, A&A, 315, L49
- (22) Draine, B.T. 1980, ApJ, 241, 1021
- (23) Draine, B.T., Roberge, W.G., Dalgarno, A. 1983, ApJ, 264, 485
- (24) Eislöffel, J., Gunther, E., Hessman, F.V., Mundt, R., Poetzel, R., Carr, J.S., Beckwith, S., Ray, T.P. 1991, ApJ, 383, 19
- (25) Everett, M.E. 1997, ApJ, 478, 246
- (26) Fernandes, A.J.L., Brand, P.J.L. 1995, MNRAS, 274, 639
- (27) Garden, R.P., Russell, A.P.G., Burton, M.G. 1990, ApJ, 354, 232
- (28) Giovanardi, C., Lizano, S., Natta, A., Evans, N.J., Heiles, C. 1992, ApJ, 397, 214
- (29) Goodrich, R.W. 1986, AJ, 92, 885
- (30) Gredel, R. 1994, A&A, 292, 580
- (31) Gredel, R. 1996, A&A, 305, 582
- (32) Grossman, E.N., Masson, C.R., Sargent, A.I., et al. 1987, ApJ, 320, 356
- (33) Habing, H.J. 1968, Bull. Astr. Inst. Netherlands, 19, 421
- (34) Hartigan, P., Curiel, S., Raymond, J. 1989, ApJ, 347, 31
- (35) Harvey, P.M., Wilking, B.A., Joy, M. 1984, ApJ, 278, 156
- (36) Herbig, G.H. 1974, Draft Catalog of Herbig-Haro Objects, Lick Obs. Bull. No. 658
- (37) Herbig, G.H., Jones, B.F. 1983, AJ, 88, 1040
- (38) Hodapp, K.-W., Ladd, E.F. 1995, ApJ, 453, 715
- (39) Hollenbach, D. 1985, Icarus, 61, 36
- (40) Hollenbach, D., McKee, C.F. 1989, ApJ, 342, 306 (HM89)
- (41) Hollenbach, D., Takahashi, T., Tielens, A.G.G.M. 1991, ApJ, 377, 192
- (42) Kaufman, M.J., Neufeld, D.A. 1996, ApJ, 456, 611
- (43) Kaufman, M.J., Wolfire, M.G., Hollenbach, D., Luhman, M.L. 1999, ApJ, 527, 795
- (44) Kemper, C., Spaans, M., Jansen, D.J., Hogerheijde, M.R., van Dishoeck, E.F., Tielens, A.G.G.M. 1999, ApJ, 515, 649
- (45) Kessler, M.F., Steinz, J.A., Anderegg, M.E., et al. 1996, A&A, 315, L27
- (46) Lefloch, B., Castets, A., Cernicharo, J., Langer, W.D., Zylka, R. 1998, A&A, 334, 269
- (47) Liseau, R., Sandell, G., Knee, L.B.G. 1988, A&A, 192, 153
- (48) Liseau, R., Lorenzetti, D., Molinari, S. 1992, A&A, 253, 119
- (49) Liseau, R., White, G.J, Larsson, B., et al. 1999, A&A, 344, 342
- (50) Lizano, S., Heiles, C., Rodriguez, L.F., Koo, B.C., Shu, F.H., Hasegawa, T., Hayashi, S., Mirabel, I.F. 1988, ApJ, 328, 763
- (51) Loren, R.B. 1976, ApJ, 209, 466
- (52) Masson, C.R., Chernin, L.M. 1993, ApJ, 414, 230
- (53) Mehringer, D.M. 1996, ApJ, 462, 355
- (54) Molinari, S., Liseau, R., Lorenzetti, D. 1993, A&AS, 101, 53
- (55) Molinari, S., Saraceno, P., Nisini, B., et al. 1998, “Star Formation with the Infrared Space Observatory” (eds. Yun J. and Liseau R.), ASP Conference Series 132, 390
- (56) Molinari, S., Ceccarelli, C., White, G.J., Saraceno, P., Nisini, B., Giannini, T., Caux, E. 1999, ApJ, 521, L71
- (57) Murphy, D.C., Persson, S.E., Pahre, M.A., Sivaramakrishnan, A., Djorgovski, S.G. 1995, PASP, 107, 1234
- (58) Nisini, B., Benedettini, M., Giannini, T., et al. 1999, A&A, 350, 520
- (59) Noriega-Crespo, A., Molinari, S. Ali, B., Cabrit, S., & Cernicharo, J. 2000 (in preparation).
- (60) Raga, A.C. 1991, AJ, 101, 1472
- (61) Raga, A.C., Canto, J., Calvet, N., Rodriguez, L.F., Torrelles, J.M. 1993, A&A, 276, 539
- (62) Reipurth, B. 1994, A General Catalog of Herbig-Haro Objects (ftp://ftp.hq.eso.org/pub/Catalogs/Herbig-Haro)
- (63) Rieke, G.H., Lebofsky, M.J. 1985, ApJ, 288, 618
- (64) Rodriguez, L.F., Lizano, S., Canto, J., Escalante, V., Mirabel, I.F. 1990, ApJ, 365, 261
- (65) Snell, R.L., Edwards, S. 1981, ApJ, 251, 103
- (66) Solf, J., Böhm, K.H. 1987, AJ, 93, 1172
- (67) Stapelfeldt, K.R. 1991, Ph. D. Thesis, California Institute of Technology
- (68) Strom, S.E., Grasdalen, G.L., Strom, K.M. 1974, ApJ, 191, 111
- (69) Strom, S.E., Vrba, F.J., Strom, K.M. 1976, AJ, 81, 314
- (70) Swinyard, B.M., Burgdorf, M.J., Clegg, P.E., Davis, G.R., Griffin, M.J., et al. 1998, Proc. SPIE, 3354, 888
- (71) Tielens, A.G.G.M., Hollenbach, D. 1985, ApJ, 291, 722
- (72) Timmermann, R., Bertoldi, F., Wright, C.M., Drapatz, S., Draine, B.T., et al. 1996, A&A, 315, L284