RXTE observation of NGC 6240: a search for the obscured active nucleus
Abstract
The wide-band energy spectrum of NGC 6240 over the range 0.5–200 keV is investigated using the RXTE and ASCA data. The RXTE data provide the spectrum beyond the ASCA range (0.5–10 keV) with significant detection of signals up to 20 keV and the upper limits above 20 keV. The spectrum above 10 keV is found to be very flat. A strong iron-K emission line discovered in the previous ASCA observation is also confirmed with the RXTE PCA. These results provide further evidence for the dominance of a reflection component, i.e. emission from cool material illuminated by an AGN. By fitting the spectra obtained with RXTE and ASCA simultaneously, we satisfactorily modeled the AGN spectrum with a Compton reflection component and probably a transmitted AGN component penetrating through a thick absorber. The X-ray luminosity of the AGN is estimated to be in the range ergs/s in the range 2–10 keV, which categorizes NGC 6240 among the most luminous Seyfert nuclei. The ratio of the 2–10 keV X-ray luminosity to the infrared luminosity, , is 0.01 – 0.1, which implies a quite substantial, if not dominant, contribution of AGN to the infrared luminosity.
keywords:
galaxies: individual: NGC 6240 – X-rays: galaxies1 Introduction
The IRAS survey (Neugebauer et al. 1984) discovered many ultraluminous infrared galaxies (ULIRGs) that emit the bulk of their energy in infrared (IR) photons. Since their bolometric luminosity and the number density are as high as those of quasars, ULIRGs are among the most energetic objects in the universe. The most fundamental problem yet to be solved is the energy source of the extremely intense infrared emission.
NGC 6240, a gravitationally interacting system with a complex optical morphology (Fosbury & Wall 1979; Fried & Schulz 1983), is a very interesting example of ULIRG. Its bolometric luminosity reaches (Weight, Joseph, & Meikle 1984; z=0.0245 and km s-1Mpc-1 are assumed). NGC 6240 is outstanding in several respects. Its H2 at 2.121m and [FeII] 1.644m line luminosities and the ratio of H2 to bolometric luminosities are the largest currently known (e.g., van der Werf et al. 1993). Further, its stellar velocity dispersion of 360 km/s is among the highest values ever found in a galaxy centre (e.g., Doyon et al. 1994).
The energy source of the huge IR luminosity is controversial. Many IR spectroscopic studies (e.g. Genzel et al. 1998; Ridgway et al. 1994; Rieke et al. 1985; Weight et al. 1984) have suggested that main energy source of the IR emission is starburst activity, which is presumably a super-starburst induced by a merger of two galaxies (Joseph & Wright 1985; Chevalier & Clegg 1985). The ground-based optical spectrum can be classified as LINER, and is interpreted as a result of shock heating (Heckman et al. 1987). On the other hand, a significant contribution from an active galactic nucleus (AGN) similar to Seyfert galaxies was also discovered from IR spectroscopy (DePoy et al. 1986). Another hint of an AGN in NGC 6240 is the presence of compact bright radio cores (Carral et al. 1990 but see Colbert et al. 1994). HST discovered a core that is excited higher than LINER (Rafanelli et al. 1997).
X-ray observation provides an important tool for investigating both the starburst and AGN activity. The ROSAT (Trümper 1990) observations showed that NGC 6240 is fairly bright in the soft X-ray band below 2 keV with a luminosity larger than ergs s-1 (0.1-2.0 keV), and the bulk of the X-ray emission is extended in a scale of (Schulz et al. 1998; Komossa, Schulz, & Greiner 1998; Iwasawa & Comastri 1998). Detailed spectroscopic studies with ASCA (Tanaka, Inoue, & Holt 1994) data of NGC 6240 have shown that the soft X-ray spectrum can be explained with two thermal components, a cooler component with a temperature of 0.2–0.6 keV and a hotter component of keV with an excess absorption of cm-2 (Iwasawa & Comastri 1998). These results show that these soft X-rays are most likely originated from thermal processes, which may arise from starburst activities (e.g. Heckman et al. 1987).
On the other hand, in the 3–10 keV band, another very hard continuum with a strong iron-K emission feature was observed with ASCA (Mitsuda 1995; Iwasawa & Comastri 1998). The observed spectral feature can be accounted for in terms of Compton reflection from optically thick material (e.g. Lightman & White 1988; George, Nandra & Fabian 1990), and is generally accepted as evidence for the presence of an AGN in NGC 6240. The emission-line profile further indicates that a part of the reflector is highly ionized (Mitsuda 1995; Iwasawa & Comastri 1998), and both the ROSAT and ASCA spectra were modeled with a reflection component from warm material surrounding the AGN (Netzer, Turner, & George 1998; Komossa et al. 1998).
As described above, many observational facts of NGC 6240, in particular X-ray spectroscopy, supports the presence of an AGN in NGC 6240, which may account for a significant fraction of the huge IR luminosity. However, the intrinsic power of the AGN is still uncertain, The hidden AGN could be visible as a strongly absorbed X-ray continuum above 10 keV, penetrating through a thick layer of the obscuring matter.
Very recently, Vignati et al. (1999) has published the BeppoSAX results of NGC 6240, concluding the detection of the direct X-rays from an AGN. As described in this paper, we performed an independent study of NGC 6240 with RXTE which carries the PCA (Jahoda et al. 1996) and HEXTE (Rothschild et al. 1998) covering 2–250 keV.
In the spectral analysis, we also utilized the ASCA data covering 0.5–10 keV energy band with two Gas Imaging Spectrometers (GIS: Ohashi et al. 1996) and two X-ray CCD cameras (SIS: Burke et al. 1991). Simultaneous use of the ASCA data provides more constraints in modeling the spectrum. Moreover, because RXTE has no imaging capability, the RXTE spectrum may be subject to contamination by nearby sources. In fact, we find from the ASCA image that it is the case, and the ASCA data are used to correct the RXTE spectrum.
We have examined various spectral models, and conclude the presence of a high-luminosity AGN in NGC 6240. Our results are in essential agreement with those of Vignati et al. (1999).
2 RXTE data
2.1 Observation and data reduction
The RXTE observation of NGC 6240 was performed on 1997 Nov 9-11. The data were reduced with Ftools 4.1 and 4.2, We discarded the PCA and HEXTE data that were taken when the centre of field of view was within 10∘ of the local horizon, and when it was off NGC 6240 by more than 0.01 degree. We also selected the time period when all the five PCUs of PCA were on. The total on-source exposure time after the data screening process is 31.4 ksec and 10.3 ksec for the PCA and HEXTE, respectively. All the five PCUs’ top layers of PCA are used for the analysis, while one of 8 detectors of HEXTE (#3 in cluster B) is excluded because of its failure. We found no significant time variability from the PCA background-subtracted light curve in the entire energy band (3-20 keV) as well as in several different energy bands.
2.2 Derivation of PCA and HEXTE spectra
We estimated the PCA background using the current standard method. 111The pcabackest software was used with the background model files of pca_bkgd_faint240_e03v02.mdl and pca_bkgd_faintl7_e03v01.mdl. We attempted to estimate systematic error associated with the background subtraction by comparing the estimated background with the on-source data in the range above 30 keV where the source signal in PCA should be negligible due to low detection efficiency. The count rates of both agreed with each other within 0.01%. Therefore, we did not introduce any systematic error to the PCA background.
We estimated the HEXTE background using the data taken during the off-target pointings (Rothschild et al. 1998). In order to estimate the HEXTE-background systematics, we accumulated spectra from the +1.5∘ off-pointings and the –1.5∘ off-pointings, separately, and found that the difference between the two background spectra was within 2%. Therefore, we introduced a 2% systematic error to the HEXTE background spectrum.
Figure 1a illustrates the PCA and HEXTE energy spectra thus obtained. Significant source signals are detected up to 25keV in the PCA data. However, the PCA data below 4 keV and above 20 keV were discarded for the spectral analysis below, due to the uncertainty of the energy response reported by Gierliński et al. (1999) and Jahoda et al. (1996). The HEXTE spectrum shows significant signals up to 20 keV, while only upper limits are obtained above 20 keV.


2.3 Spectral analysis
In order to see the overall spectral characteristics, we first fit the spectra with a simple power-law model modified by Galactic absorption, i.e. , where is X-ray energy, f(E) is photon flux given in units of photons s-1 cm-2 keV-1, is photon index, is the normalization factor, is the cross-section of photoelectric absorption given by Morrison & McCammon (1983), and is the Galactic hydrogen column density set equal to cm-2 (Dickey & Lockman 1990). Using XSPEC software (ver. 10.0), we performed a minimum-chi-square fitting. The best-fit photon-index is 0.51 yielding = 210/32 (Figure 1a). The ratio of the data to the best-fit power-law model (Figure 1b) clearly shows evidence for an iron K emission line at 6 keV and a flatter continuum above 8 keV.

Then, we modeled the spectrum with two power-law continua (soft and hard) plus a line emission, as expressed by . The iron-line central energy () and the intensity () are free parameters, and the line width is assumed to be zero. The fit result is shown in Figure 2 and the best-fit parameters are summarized in Table 1. Notable properties of the best-fit model are very small photon index, 0, of the hard pawer-law continuum, and a large equivalent width, 0.79 keV, of the iron line. An absorption edge structure is noticeable at 7–8 keV in the fit residual (Fig. 2), which is most likely the iron K-edge. These features are characteristic of the reflected X-rays from an optically thick material as has been pointed out by several authors (Iwasawa & Comastri 1998; Netzer et al. 1998). X-rays impinging on optically thick matter are photo-absorbed as well as Compton-scattered. These processes form a very flat continuum around keV, together with the K-absorption edge and K emission line of iron. We fit the RXTE spectrum together with ASCA data in § 4 with models including the Compton reflection.
| Parameter | Value |
|---|---|
| (counts s-1 cm-2 at 1 keV) | |
| 4.4 | |
| (counts s-1 cm-2 at 1 keV) | |
| 0.04 | |
| (counts s-1 cm-2)a) | |
| (keV) | 6.34 |
| 48.0/28 |
-
a)
: The physical line width is assumed to be zero. The equivalent width is calculated to be 0.79 keV.
3 ASCA data
3.1 Observation and data reduction
ASCA observation of NGC 6240 was performed on 27 March, 1994. The GIS provides an X-ray image with a circular field of view of diameter. The SIS was operated with 2-CCD mode, covering a much smaller, rectangular field of view of . Iwasawa & Comastri (1998) presented the result of the SIS data only. Here, we analyse both the SIS and GIS data. In particular, the GIS data are useful in order to look for any contamination sources in the field around NGC 6240.
We accepted the GIS and SIS data that were taken when the X-Ray Telescope (XRT: Serlemitsos et al. 1995) axis was more than 5∘ above the local horizon, and when the geomagnetic cutoff rigidity was larger than 6 GeV/c in order to ensure a low and stable background. Additional screening condition that the elevation angle from the sunlit earth is greater than 25∘ and 20∘ was applied to the SIS0 and SIS1 data, respectively. As reported by Turner et al. (1997), the ASCA data of NGC 6240 show no significant time variation.
3.2 GIS image
The GIS image in the full energy band 0.5–10 keV shows a point-like source that coincides with NGC 6240 within arcmin systematic error of the satellite attitude. In addition to the emission from NGC 6240, the soft Galactic diffuse emission covers the entire GIS field of view. The position of NGC 6240, =, is in the middle of an excess-emission structure of Loop I, which is found in the ROSAT All Sky Survey (Snowden et al. 1997). The energy spectrum of the excess emission is very soft ( keV), and it is significant only in the soft energy band below keV.
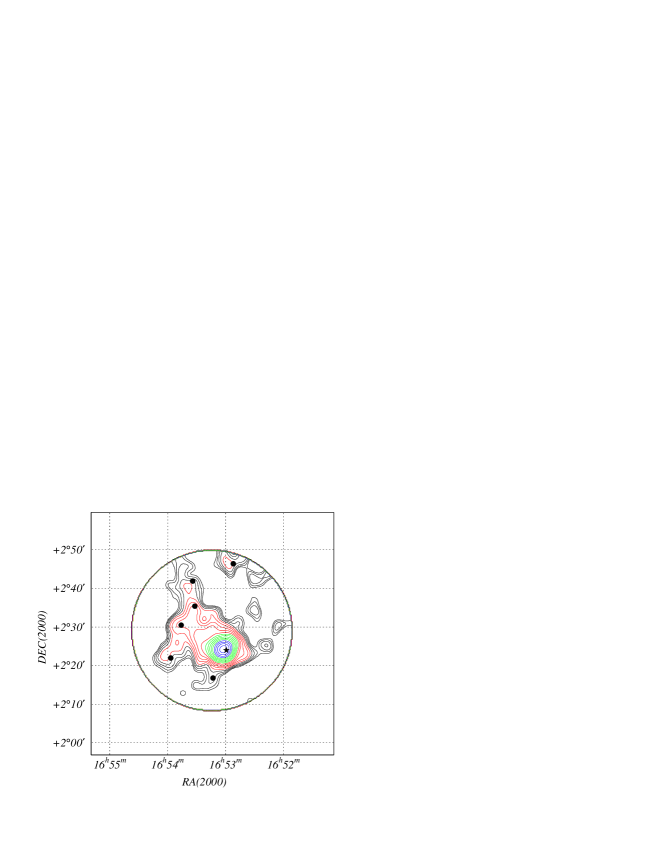
On the other hand, at higher energies, we find an extended structure as clearly seen in the image for the 2.4–10 keV band shown in Figure 3, in which the background consisting of non-X-ray background (NXB) and cosmic X-ray background (CXB) has been subtracted. These are estimated from the data obtained in the blank sky observations and data taken when the XRT is pointing at the dark (night) earth (for detail see Ikebe et al. 1995; Ishisaki et al. 1997). The background was subtracted to derive the image. In Figure 3, notable emission is located north-east of NGC 6240, and extends towards north as well as east. Since the extension of the emission is much larger than that of the soft X-ray emission of NGC 6240 detected with ROSAT, we consider it to be an unassociated with NGC 6240. In the ROSAT PSPC data, there exist several faint sources around NGC 6240 as illustrated in Figure 3. These sources, if blurred with the angular response of the GIS, seem to form a brightness structure consistent with that observed with the GIS. Therefore, the extended X-ray structure is most probably due to these faint background sources. Since the field of view of RXTE/PCA and HEXTE are both 1 degree FWHM, the emission from the contamination sources will contribute to the RXTE spectra significantly. Below we examine the ASCA spectrum of NGC 6240 and the properties of these contamination sources.
3.3 Spectrum of NGC 6240
We construct the GIS energy spectrum of NGC 6240 from a circular region of 3 arcmin radius centered on the X-ray peak. The spectra from the two GIS sensors, GIS-2 and GIS-3, are summed. The NXB + CXB background is subtracted, as has been done for the GIS image. The soft excess emission is not subtracted, but it is negligible above 2.0 keV.
The SIS spectrum of NGC 6240 is extracted within a circle of 3 arcmin radius from the SIS-0 chip-1 and the SIS-1 chip-3. The data taken from the two chips are summed together. For the SIS background, we accumulate photons from a region where no contamination source is present on the same CCD chips with which NGC 6240 was observed. Therefore, the soft Galactic diffuse component is also subtracted as a part of the background.
The GIS and SIS spectra thus obtained are illustrated in Figure 4. Following Iwasawa & Comastri (1998), we fit the ASCA spectrum of NGC 6240 with a two-component model that includes a thermal component and an AGN component. The thermal component consists of emission from two optically-thin thermal plasmas of different temperatures, where the higher temperature component has an excess absorption. The AGN component consists of an absorbed power-law continuum and line emission. The model can be written as;
| (1) | |||||
where the parameters in parentheses are kept free. For the thermal plasma emission code, we employ the Mewe-Kaastra model (Mewe, Gronenschild, & van den Oord 1985; Mewe, Lemen, & van den Oord 1986; Kaastra 1992) modified by Liedahl, Osterheld, & Goldstein (1995), which is implemented in XSPEC as the MEKAL model. The metallicities, , of the two thermal components are assumed to be the same. The abundance ratios among different elements are fixed to be the fiducial solar values given by Anders & Grevesse (1989).
With this model, we fit the GIS and SIS spectra simultaneously. In this simultaneous fit, the GIS data below 2.0 keV are excluded because of a slight uncertainty in the energy scale of the GIS arising from the complex xenon M-edge structure in this range. A good fit is obtained as shown in Figure 4 and Table 2, and the results are essentially the same as obtained by Iwasawa & Comastri (1998) using the SIS data only. As noted by Iwasawa & Comastri (1998), the striking spectral features are a very flat continuum above 4 keV with a photon index of and a strong iron K-line with an equivalent width of 1.2 keV.

| Parameter | Value |
|---|---|
| (cm-3)b) | |
| (keV) | 0.31 |
| (cm-3)b) | |
| (keV) | 1.07 |
| (solar) | 1.41 |
| (cm-2) | 0.92 |
| (counts s-1 cm-2)c) | |
| (keV) | 6.46 |
| (cm-2) | 0.0 |
| (counts s-1 cm-2 keV-1 @1keV) | |
| -0.10 | |
| 59.4/55 |
-
a)
: Throughout this paper, for fitting the SIS spectrum only, an additional absorption with equivalent hydrogen column density of cm-2 was artificially applied, in order to account for a systematic overestimate of the absorption column density (Dotani et al. 1996; Cappi et al. 1998).
-
b)
: Emission integral.
-
c)
: The physical line width is assumed to be zero. The equivalent width with respect to the power law continuum is 1.24 keV.
3.4 Contamination sources’ spectrum
Although the contamination sources near NGC 6240 are not identified, we only need the energy spectrum for the purpose of the present work. We construct the spectrum from the whole field of view of the GIS excluding the 3-arcmin radius circle centered on the X-ray peak of NGC 6240, from which the estimated background (NXB + CXB) is subtracted. In addition, because of an extended outskirts of the XRT point-spread function, the spectrum still contains a significant contribution from NGC 6240. Using a ray-tracing simulation software, the contribution from NGC 6240 outside the 3-arcmin radius circle is estimated and subtracted. Figure 5 shows the GIS spectrum thus obtained. The resultant GIS spectrum contains the total photons from the contamination sources within the GIS field of view and the Galactic soft diffuse emission.

As shown in Figure 5, thus obtained GIS spectrum is fitted satisfactorily () with the sum of a thin-thermal model (MEKAL model) and a power-law model. For the thermal component, we obtain the best-fit temperature of 0.23 keV and the surface brightness of 1.0 ergs s-1 cm-2 arcmin-2 (0.5–2 keV), assuming the element abundances to be solar. We identify this thermal component to be the Galactic diffuse emission, since these values are consistent with the ROSAT results (Snowden et al. 1997). Thus, the spectrum of the contamination sources can be expressed by a power law with the best-fit photon index of 1.560.23. Its flux is 2.1 ergs s-1 cm-2 (2 – 10 keV), which is % as high as that of NGC 6240. Therefore, the contribution from the contamination sources to the RXTE spectrum is quite substantial, and will be taken into account for the analysis of the RXTE spectrum in the next section. It is to be noted that the spectrum of the contamination sources (added together) is pretty hard, consistent with that of AGN. This suggest that these sources, if not all, are possibly AGN.
4 RXTE + ASCA joint fit
In this section, we model the 0.5–200 keV energy spectrum of NGC 6240 obtained with RXTE and ASCA, taking into account the contamination sources detected in the GIS field of view. Below 3 keV, the X-ray emission is dominated by the thermal component that presumably originates from the starburst activity in the galaxy, and is well described with the two temperature model (Iwasawa & Comastri 1998) as shown in § 3.3. The X-ray emission from the AGN in NGC 6240 dominates above 4 keV and we perform detailed modeling below.
4.1 Power law model
For modeling the energy spectrum of the AGN, we begin with the simplest model, power-law + line, given by equation 1 in § 3.3, The ASCA GIS and SIS spectra of NGC 6240, the PCA spectrum, and the HEXTE spectrum were fitted simultaneously. Since the X-ray intensity of the AGN may have varied between the ASCA and RXTE observations performed at different periods, the normalization factor of the power-law component, , is left free for the ASCA and RXTE spectra, respectively. Since the iron K-line is presumably generated by reprocessing of the X-rays from the AGN on an optically thick matter, the line intensity will be proportional to the AGN luminosity on the time average. Therefore, we assumed that the ratio of the flux of the iron line to that of the power-law continuum, , was the same in the two separate observations with ASCA and RXTE, respectively. On the other hand, the normalization factor of the thermal components, and , are assumed to be common to the RXTE and ASCA spectra, since the thermal component which is extended should not vary with time. All other parameters are also tied between the two observations. In order to take into account the hard contribution source, a power-law model with the photon index 1.56 as derived in the previous section is included in the PCA and HEXTE spectra with a free normalization factor. We assume that the power law spectrum extends beyond 10 keV with the same photon index.
As shown in Figure 6 and Table 3, the fit is not acceptable. As expected, the obtained parameters of the thermal component are essentially the same as those given in Section 3.3, since the RXTE spectrum has little influence below 4 keV. However, the best-fit power-law continuum of AGN is significantly flatter than that given by Iwasawa & Comastri (1998). Furthermore, the residuals require an even harder continuum in 8–15 keV band, and also suggests a spectral steepening above keV. These features together with a large equivalent width of Fe K-line are consistent with a Compton reflection spectrum. We therefore incorporate Compton reflection in the next subsection.

| Parameter | Value |
|---|---|
| (counts s-1 cm-2)a) | |
| (keV) | 6.44 |
| (cm-2) | 1.1 |
| -0.15 | |
| (ASCA)b) | |
| 1.16 | |
| 131.5/87 |
-
a)
: The physical line width is assumed to be zero. The equivalent width with respect to the power-law continuum is 1.13 keV.
-
b)
: In the unit of counts s-1 cm-2 keV-1 @1keV.
4.2 Reflection model
We employ the Compton reflection model developed by Magdziarz & Zdziarski (1995) implemented in XSPEC as the PEXRAV model. Using the PEXRAV model, we can calculate the reflected X-ray spectrum when X-rays of a power-law spectrum illuminate an optically thick layer of material that is predominately neutral except hydrogen and helium. Here, we assume that the direct X-rays from the AGN are totally blocked by a thick absorber on the line of sight. The parameters that describe the model are: , photon index of the incident power law spectrum with an exponential cutoff at ; , where is the solid angle subtended by the optically thick material; , where is the angle between the line of sight and the normal vector of the optically thick layer; , the iron abundance of the optically thick material. Element abundances besides iron are assumed to be the solar values.
In the following fitting, is fixed at 200 keV (practically a single power law in the observed range). is fixed at 0.45 so that the model spectrum is closest to that averaged over all viewing angles as described in Magdziarz & Zdziarski (1995). Combining with the thermal component and the line emission, the overall fitting model is given by
| (2) | |||||
where free parameters are shown in parentheses. The normalization factors of the reflection component, , for the ASCA and RXTE spectra are left free from each other for possible time variation of the AGN luminosity. The flux ratio between the Fe K-line and the AGN continuum is assumed to be constant. All other parameters are also assumed to be the same between the two observations. Another power-law with a photon index of 1.56 that represents the contamination sources is added to the model for the PCA and HEXTE spectrum.
As shown in Figure 7 and Table 4, this model can account for the 0.5–200 keV wide-band spectrum satisfactorily. The flux of the contamination sources in the RXTE spectrum determined from the fit is in good agreement with that obtained with the GIS within . The two normalization factors of the AGN component obtained from the ASCA and RXTE spectra respectively happened to be very close (=0.92–1.26), as were the Fe K-line intensities nearly equal in these two observations. The equivalent width of the iron line with respect to the reflection continuum is 0.8 keV, which is a typical value for the fluorescence line associated with the Compton-reflection.

However, the best-fit photon index of the incident AGN spectrum is 1.260.13, which is unusually small compared to the typical values for AGNs (e.g. Mushotzky, Done, & Pounds 1993). In this fit, the viewing angle was fixed at 0.45. Even if we allow to vary (Table 4), photon index larger than 1.54 is not acceptable. The intrinsic luminosity of the AGN is estimated to be larger than ergs/s, the value corresponding to the maximum solid angle, i.e. , of 1.0.
| Parameter | Value (fit 1)a) | Value (fit 2)a) |
|---|---|---|
| 1.26 | 0.98 | |
| 0.45 (fix) | b)0.08 | |
| Fe abundance (solar) | 0.47 | 0.72 |
| (ASCA)c) | 2.7 | 4.6 |
| (counts s-1 cm-2)d) | 2.5 | 2.4 |
| (keV) | 6.44 | 6.44 |
| / | 1.08 | 1.05 |
| 97.2/87 | 96.4/86 |
-
a)
: is fixed or left free in the fit 1 and 2, respectively.
-
b)
: The lower and upper limits correspond to the limitation of the model code.
-
c)
: In the unit of counts s-1 cm-2 keV-1 @1keV.
-
d)
: The physical line width is assumed to be zero. Equivalent width with respect to the reflection continuum is 0.88 keV and 0.84 keV for the fit 1 and 2, respectively.
4.3 Reflection + Transmission model
Although, the above reflection-only model gives a satisfactory fit to the RXTE + ASCA data, the small photon index derived in § 4.2 still remains to be problem. As shown below, this is resolved by adding an absorbed AGN continuum that is transmitted through a thick absorber on the line of sight. (Here we do not consider the extent of the absorber, hence we assume no scattering of X-rays into the line of sight.) The transmitted AGN component is given by
| (3) |
where is the Thomson scattering cross-section, and is the hydrogen-column density along line of sight. The attenuation by the Thomson scattering becomes important above keV as compared to photoelectric absorption.
Adding the transmitted AGN component given by eq. 3 to eq. 2, we construct the reflected- and transmitted-AGN + thermal model as;
| (4) | |||||
The photon-index , the cutoff energy, (fixed to 200 keV), and the normalization, , are the same for both the reflection and transmitted components. The relative intensities between the transmitted component and the reflection component is determined by the solid angle, , which is left free. The metallicity of the elements lighter than Fe and the viewing angle are fixed at 1.0 solar and 0.45, respectively. As in the previous fits, including the contamination-source component in the RXTE model, we fit the four spectra jointly with this model.
The reflected- and transmitted-AGN + thermal model gives a good fit (Figure 8, Table 5). The derived photon index is = 1.59 , which is consistent with the canonical value of 1.9 (Pounds et al. 1990). The best-fit solid angle of the reflector, , is 0.51, and the absorption column density, , is found to be cm-2. Since was poorly constrained, the intrinsic luminosity of the AGN has a large error range. If we assume that does not exceed 1.0, is obtained to be ergs/s in the range 2 – 10 keV. When we leave the viewing angle free, the fitting parameters as well as the intrinsic luminosity remain essentially the same, if (Table 5).

So far, we assumed that the matter that obscures the AGN is located only on the line of sight. If the absorbing matter covers a significant solid angle viewed from the AGN such as in the case of a torus, some of the incoming photons will be scattered into our line of sight. Then the model given by eq. 3 would overestimate the AGN luminosity. Matt, Pompilio, & Franca (1999) performed a Monte Carlo calculation of the X-ray transmission through spherically distributed matter for various column densities. According to their result, the true AGN luminosity would be smaller by a factor of , if the absorbing matter is distributed in a spherical geometry. Consequently, for the same flux from the cold reflector, the true value of should be larger by a factor of 2 than that in Table 5. The column density of the absorbing matter is also subject to a slight overestimation.
The case that a heavy absorber exists only on the line of sight is rather unlikely. On the other hand, since the fitting result shows a relatively small absorption for the reflection component, the absorbing matter is probably not covering the entire sphere. There two cases, a cloud on the line of sight are spherically distributed matter, are considered to represent two extremes.
In conclusion, the reflected- and transmitted-AGN model gives the following AGN parameters: , (2–10keV) = – ergs/s, = 0.1–1, and = 1.0 – 2.7 cm-2, where the range of parameters represents not only the statistical errors but also the uncertainties due to unknown inclination angle of the reflector, and the limits for the two extreme geometries of the absorbing/scattering material.
| Parameter | Value (fit 1) | Value (fit 2)a) |
|---|---|---|
| 1.59 | 1.71 | |
| 0.45 (fix) | b)0.91 | |
| Fe abundance (solar) | 0.85 | 0.77 |
| (ASCA)c) | 9.1 | 1.3 |
| (cm-2) | 1.7 | 1.7 |
| 0.51 | 0.34 | |
| (counts s-1 cm-2)d) | 2.4 | 2.3 |
| (keV) | 6.44 | 6.44 |
| / | 1.00 | 1.03 |
| 86.2/85 | 84.8/84 |
-
a)
: In the fit, is left free. Maximum value of is assumed to be 1.
-
b)
: The lower and upper limits correspond to the limitation of the model code.
-
c)
: In the unit of counts s-1 cm-2 keV-1 @1keV.
-
d)
: The physical line width is assumed to be zero. The equivalent width with respect to the reflection continuum is 0.96 keV and 0.95 keV for the fit 1 and 2, respectively.
5 Discussion
The X-ray spectrum of NGC 6240 is satisfactorily explained with a model consisting of a thermal component and an AGN component. For the AGN component, and equally good fit is obtained either by the reflection-only model or by the reflected- and transmitted-AGN model. Hence, we cannot conclude the detection of the direct AGN component from the present data. However, without the direct (transmitted) component the derived photon index is noticeably smaller than the typical values for AGN. We consider it more probable that the direct AGN component is present at high energies.
According to the unified model for Seyfert galaxies (e.g. Antonucci 1993), one can interpret the result in terms of a tilted molecular torus in which the near-side of the torus acts as an absorber and the far-side acts as a reflector. If the torus is axisymmetric, both the reflecting part and the absorbing part would have a similar column density. With the reflected- and transmitted-AGN model, the column density of the obscuring matter is estimated to be cm-2, corresponding to Thomson optical depth of . This is practically enough for a reflector. Thus, the present result is consistent with the interpretation that NGC 6240 has a similar geometry to Seyfert 2 galaxies. The obtained column density gives an IR extinction of , which is consistent with the fact that the previous IR observations did not find the AGN itself. Narrow line region that has not been seen in the optical observations would be obscured as well.
The intrinsic X-ray luminosity of NGC 6240 is estimated in § 4.3 to be in the range ergs/s in the range 2–10 keV. For the reflection-only case (§ 4.2), the luminosity is estimated to be larger than ergs/s, while the upper bound of luminosity is not determined. However, it would be plausible that the solid angle factor is not much less than several %, which gives essentially the same luminosity range as the above. This luminosity is among those of the most luminous Seyfert nuclei, and even comparable to those of quasars. The bolometric luminosity of the AGN may well exceed erg/s.
Concerning the power source of the huge IR luminosity, a measure of the contribution of an AGN to the IR emission is a ratio of X-ray luminosity to IR luminosity, . Based on our results given above and the IR flux calculated from the IRAS result with the formula, = flux(25m)() + flux(60m)(), gives for NGC 6240. This agrees with those of other Seyfert nuclei given by Ward et al. (1988).
Vignati et al. (1999), using the BeppoSAX data of NGC 6240, claim that the direct AGN component was positively detected, though they assumed the photon index of the AGN to be 1.8. Other than that, their results and interpretation are essentially in agreement with ours.
The luminosity of the AGN can be used to infer the mass of the central black hole in NGC 6240. If the AGN accretes about 1% of the Eddington luminosity, the total luminosity of erg/s would lead to a mass of , which is consistent with the value expected from the galaxy-mass to black-hole-mass relation (Lauer et al. 1997), with the estimated galaxy mass of after having completed its merging epoch (Shier & Fisher 1997).
6 Conclusion
The 0.5–200 keV wide band energy spectrum of NGC 6240 obtained with RXTE and ASCA is accounted for in terms of a soft thermal component and a hard AGN component. The soft component is presumably due to star burst activity. The AGN component consists of a Compton reflection component accompanied by an intense Fe-K emission line and probably a transmitted component (a direct component penetrating through a thick absorber). The detection of the transmitted component is not conclusive from the fitting. However, without a transmitted component, the photon index is unusually small. Assuming that the solid angle factor does not exceed 1, we estimated the intrinsic X-ray luminosity of the AGN in the range 2–10 keV to be in the range ergs/s, which yields the ratio of the X-ray luminosity (2–10 keV) to the IR luminosity of . The column density that obscures the central AGN is estimated to be larger than cm-2. These results show that NGC 6240 is among the most luminous Seyfert 2 galaxies.
Acknowledgments
The authors are grateful to Dr. Joachim Siebert for helping the RXTE data analysis. Y.I. was supported by the post-doctoral program of the Max-Planck-Gesellschaft and is currently supported by the Japan Society for the Promotion of Science Postdoctoral Fellowships for Research Abroad. KML gratefully acknowledges support by NAG5-6921 (RXTE) and NAG5-7971 (LTSA).
References
- [1] Antonucci R. R. J., 1993, ARA&A, 31, 473
- [2] Anders E., Grevesse N., 1989, Geochem. Cosmochim. Acta., 53, 197
- [3] Burke B. E., Mountain R. W., Harrison D. C., Bartz M. W., Doty J. P., Ricker G. R., Daniels P. J., 1991, IEEE Trans. ED-38, 1069
- [4] Cappi M., Matsuoka M., Otani C., Leighly K. M., 1998, PASJ, 50, 213
- [5] Carral P., Turner J. L., Ho P. T. P., 1990, ApJ 362, 434
- [6] Chevalier R. A., Clegg A. W., 1985, Nature, 317, 44
- [7] Colbert E. J. M., Wilson A. S., Bland-Hawthorne J., 1994, ApJ, 436, 89
- [8] Dotani T. et al., 1996, ASCA Newsletters (NASA/GSFC), No.4, 3
- [9] Doyon R., Wells M., Wright G. S., Joseph R. D., Nadeau D., James P. A., 1994, ApJ 437, 23
- [10] DePoy D. L., Becklin E. E., Wynn-Williams C. G., 1986, ApJ, 307, 116
- [11] Dickey, Lockman, 1990, ARA&A, 28, 215
- [12] Fosbury R. A. E., Wall J. V., 1979, MNRAS, 189, 79
- [13] Fried J. W., Schulz H., 1983, A&A, 118, 166
- [14] Genzel R., et al., 1998, ApJ, 498, 579
- [15] George I. M., Nandra K., Fabian A. C., 1990, MNRAS, 242, 28
- [16] Gierliński M., Zdziarski A. A., Poutaneu J., Coppi P. S., Ebisawa K., Johnson W. N., 1999, astro-ph/9905146v2
- [17] Heckman T. M., Armus L., Miley G. K., 1987, AJ, 92, 276
- [18] Ikebe Y., Ishisaki Y., Kubo H., Idesawa E., Takahashi T., Makishima K. et al., 1995, ASCA Newsletters (NASA/GSFC), No.3, 13
- [19] Iwasawa K., Comastri A., 1998, MNRAS, 297, 1219
- [20] Jahoda K. et al., 1996, SPIE, 2808, 59
- [21] Joseph R. D., Wright G. S., 1985, MNRAS, 214, 87
- [22] Ishisaki Y., Ueda Y., Kubo H., Ikebe Y., Makishima K. et al., 1997, ASCA Newsletters (NASA/GSFC) No.5, 25
- [23] Kaastra J. S., 1998, in Proc. IAU Symp. 188, The Hot Universe, ed. Koyama, K., Kitamoto, S., and Itoh, M. (Kluwer Academic Publishers), p43
- [24] Komossa S., Schulz H., Greiner J., 1998, A&A, 334, 110
- [25] Lauer T. R., Faber S. M., Tremaine S., 1997, ASP Conf. Ser. 116, 113
- [26] Lightman A. P., White T. R., ApJ, 335, 57
- [27] Liedahl D. A., Osterheld A. L., Goldstein W. H., 1995, ApJ, 438, L115
- [28] Magdziarz P., Zdziarski A. A., 1995, MNRAS, 273, 837
- [29] Matt G., Pompilio F., Franca F. L. 1999, astro-ph/9904341
- [30] Mewe R., Gronenschild E. H. B. M., van den Oord G. H. J., 1985, A&AS, 62, 197
- [31] Mewe R., Lemen J. R., van den Oord G. H. J. 1986, A&AS, 65, 511
- [32] Mitsuda K., 1995, in Proc. 17th Texas Symp. ed. H. Böhringer, G. E. Morfill, & J. Trümper, Annals New York Acad. of Sc. 759, 213
- [33] Morrison R., McCammon D., 1983, ApJ, 270, 119
- [34] Mushotzky R. F., Done C., Pounds K. A., 1993, ARA&A, 31, 717
- [35] Neugebauer G. et al., 1984, ApJ, 278, L1
- [36] Netzer H., Turner T. J., George I. M., 1998, ApJ, 504, 680
- [37] Ohashi T. et al., 1996, PASJ, 46, 87
- [38] Pounds K. A., Nandra K., Stewart G. C., George I. M., Fabian A. C. 1990, Nature, 1990, 132
- [39] Rafanelli P., Schulz H., Barbieri C., et al., 1997, A&A, 327, 901
- [40] Ridgway S. E., Wynn-Williams C. G., Becklin E. E., 1994, ApJ, 428, 609
- [41] Rieke G. H., Cutri R. M., Black J. H., Kailey W. F., McAlary C. W., Lebofsky M. J., Elston R., 1985, ApJ, 290, 116
- [42] Rothschild R. E. et al., 1998, ApJ, 496, 538
- [43] Schulz H., Komossa S., Berghöfer T. W., Boer B., 1998, A&A, 330, 823
- [44] Serlemitsos P. J. et al., 1995, PASJ, 47, 105
- [45] Shier L.M., Fisher J., 1997, ASP Conf. Ser. 116, 502
- [46] Snowden S. L. et al., 1997, ApJ, 485, 125
- [47] Tanaka Y., Inoue H., Holt S. S., 1994, PASJ, 46, L37
- [48] Trümper J., 1990, Phys. Bl. 46, 137
- [49] Turner T. J., George I. M., Nandra K., Mushotzky R. F., 1997, ApJS, 113, 23
- [50] van der Werf P. P., Genzel R., Krabbe A., Blietz M., Lutz D., Drapatz S., Ward M. J., Forbes D. A., 1993, ApJ, 405, 522
- [51] Vignati P. et al., 1999, A&A, in press (astro-ph/9908253)
- [52] Ward M. J., Done C., Fabian A. C., Tennant A. F., Shafer R. A., 1988, ApJ, 324, 767
- [53] Weight G. S., Joseph R. D., Meikle W. P. S., 1984, Nature, 309, 430