Radio Supernovae and GRB 980425
Abstract
Study of radio supernovae (RSNe) over the past 20 years includes two dozen detected objects and more than 100 upper limits. From this work we are able to identify classes of radio properties, demonstrate conformance to and deviations from existing models, estimate the density and structure of the circumstellar material and, by inference, the evolution of the presupernova stellar wind, and reveal the last stages of stellar evolution before explosion. It is also possible to detect ionized hydrogen along the line of sight, to demonstrate binary properties of the stellar system, and to show clumpiness of the circumstellar material. More speculatively, it may be possible to provide distance estimates to radio supernovae.
The interesting and unusual radio supernova SN 1998bw, which is thought to be related to the -ray burst GRB 980425, is discussed in particular detail. Its radio properties are compared and contrasted with those of other known RSNe.
1 Introduction
A series of papers published over the past 20 years on radio supernovae (RSNe) has established the radio detection and/or radio evolution for approximately two dozen objects: 2 Type Ib supernovae (SNe), 5 Type Ic SNe, and the rest Type II SNe. A much larger list of more than 100 additional SNe have low radio upper limits (Table 1).
| SN | Type | Radio | SN | Type | Radio | SN | Type | Radio | SN | Type | Radio |
|---|---|---|---|---|---|---|---|---|---|---|---|
| 1895B | I | 1901B | I | 1909A | II | 1914A | ? | ||||
| 1917A | I? | 1921B | II | 1921C | I | 1923A | IIP | DT | |||
| 1937C | Ia | 1937F | II | 1939C | II | 1940A | IIL | ||||
| 1945B | ? | 1948B | II? | 1950B | II? | DT | 1954A | I | |||
| 1954J | II | 1957D | II? | DT | 1959D | II | 1959E | I | |||
| 1963J | I | 1966B | II | 1968D | II | DT | 1968L | IIP | |||
| 1969L | IIP | 1970A | II? | 1970G | IIL | LC | 1970L | I? | |||
| 1970O | ? | 1971G | I? | 1971I | Ia | 1971L | Ia | ||||
| 1972E | Ia | 1973R | IIP | 1974E | ? | 1974G | Ia | ||||
| 1975N | Ia | 1977B | ? | 1978B | II | 1978G | II | ||||
| 1978K | II | LC | 1979B | Ia | 1979C | IIL | LC | 1980D | IIP | ||
| 1980I | Ia | 1980K | IIL | LC | 1980L | ? | 1980N | Ia | |||
| 1980O | II | 1981A | II | 1981B | Ia | 1981K | II? | LC | |||
| 1982E | Ia? | 1982R | Ib? | 1983G | I | 1983K | IIP/n | ||||
| 1983N | Ib | LC | 1984A | I | 1984E | IIL/n | 1984L | Ib | LC | ||
| 1984R | ? | 1985A | Ia | 1985B | Ia | 1985F | Ib | ||||
| 1985G | IIP | 1985H | II | 1985L | IIL | DT | 1986A | Ia | |||
| 1986E | IIL | LC | 1986G | Ia | 1986I | IIP | 1986J | IIn | LC | ||
| 1986O | Ia | 1987A | IIpec | LC | 1987B | IIn | 1987D | Ia | |||
| 1987F | IIpec | 1987K | IIb | 1987M | Ic | 1987N | Ia | ||||
| 1988I | IIn | 1988Z | IIn | LC | 1989B | Ia | 1989C | IIn | |||
| 1989L | IIL | 1989M | Ia | 1989R | IIn | 1990B | Ic | LC | |||
| 1990K | IIL | 1990M | Ia | 1991T | Ia | 1991ae | IIn | ||||
| 1991ar | Ic | 1991av | IIn | 1991bg | Ia | 1992A | Ia | ||||
| 1992H | IIP | 1992ad | IIP? | DT | 1992bd | II | 1993G | II | |||
| 1993J | IIb | LC | 1993N | IIn | 1993X | II | 1994D | Ia | |||
| 1994I | Ic | LC | 1994P | II | 1994W | IIn | 1994Y | IIn | |||
| 1994ai | Ic | 1994ak | IIn | 1995G | IIn | 1995N | IIn | DT | |||
| 1995X | IIP | 1995ad | IIP | 1995al | Ia | 1996N | Ic | DT | |||
| 1996W | IIpec | 1996X | Ia | 1996ae | IIn | 1996an | II | ||||
| 1996aq | Ic | 1996bu | IIn | 1996cb | IIb? | DT | 1997X | Ic | DT | ||
| 1998bw | Ic | LC |
In this extensive study of the radio emission from SNe, several effects have been noted: 1) Type Ia SNe are not radio emitters to the detection limit of the VLA∗*∗*The VLA is operated by the NRAO of the AUI under a cooperative agreement with the NSF.; 2) Type Ib/c SNe are radio luminous with steep spectral indices (generally ; ) and a fast turn-on/turn-off, usually peaking at 6 cm near or before optical maximum; and 3) Type II SNe show a range of radio luminosities with flat spectral indices (generally ) and a relatively slow turn-on/turn-off, usually peaking at 6 cm significantly after optical maximum. Type Ib/c may be fairly homogeneous in their radio properties, while Type II, as in the optical, are quite diverse.
There are a large number of physical properties of SNe which we can determine from radio observations. VLBI imaging shows the symmetry of the explosion and the local CSM, estimates the speed and deceleration of the SN shock propagating outward from the explosion and, with assumptions of symmetry and optical line/radio sphere velocities, allows independent distance estimates to be made (see, e.g., [Marcaide et al. 1997], [Bartel et al. 1985]).
Measurements of the multi-frequency radio light curves and their evolution with time show the density and structure of the CSM, evidence for possible binary companions, clumpiness or filamentation in the presupernova wind, mass-loss rates and changes therein for the presupernova stellar system and, through stellar evolution models, estimates of the ZAMS presupernova stellar mass and the stages through which the star passed on its way to explosion. It has also been proposed by Weiler et al. (1998) that the time from explosion to 6 cm radio maximum may be an indicator of the radio luminosity and thus an independent distance indicator.
A summary of the radio information on SNe can be found at
http://rsd-www.nrl.navy.
mil/7214/weiler/sne-home.html.
2 Models
All known RSNe appear to share common properties of: 1) nonthermal synchrotron emission with high brightness temperature; 2) a decrease in absorption with time, resulting in a smooth, rapid turn-on first at shorter wavelengths and later at longer wavelengths; 3) a power-law decline of the flux density with time at each wavelength after maximum flux density (optical depth ) is reached at that wavelength; and 4) a final, asymptotic approach of spectral index to an optically thin, nonthermal, constant negative value ([Weiler et al. 1986], [Weiler, Panagia, & Sramek 1990]). Chevalier (1982a,b) has proposed that the relativistic electrons and enhanced magnetic field necessary for synchrotron emission arise from the SN shock interacting with a relatively high density circumstellar medium (CSM) which has been ionized and heated by the initial UV/X-ray flash. This CSM is presumed to have been established by a constant mass-loss () rate, constant velocity () wind (i.e., ) from a red supergiant (RSG) progenitor or companion. This ionized CSM is also the source of the initial absorption. A rapid rise in the observed radio flux density results from the shock overtaking more and more of the wind material, leaving progressively less of it along the line of sight to the observer to absorb the more slowly decreasing synchrotron emission from the shock region.
2.1 Parameterized Radio Light Curves
The parameterized model of Weiler et al. (1986), Weiler, Panagia, & Sramek (1990), and Montes, Weiler, & Panagia (1997) may be written as:
| (2.1) |
where
| (2.2) |
| (2.3) |
and
| (2.4) |
, , and correspond, formally, to the unabsorbed flux density (), and the uniform () and non-uniform () optical depths in the surrounding CSM at 5 GHz one day after the explosion date . represents a non-time dependent HII absorption along the line-of-sight to the radio emitting region (EM = pc cm-6, where is the electron temperature of the ionized absorbing region; Eq. 1 – 223 of Lang 1986). The term describes the attenuation of a local medium with optical depth and time dependence that uniformly covers the emitting source (“uniform external absorption”); the term describes the attenuation produced by an inhomogeneous medium with optical depths distributed between 0 and (“clumpy absorption”) and time dependence ; and the term describes an absorption along the line-of-sight which is sufficiently far removed from the radio generating region to be constant with time. All absorbing media are assumed to be purely thermal, ionized hydrogen with opacity .
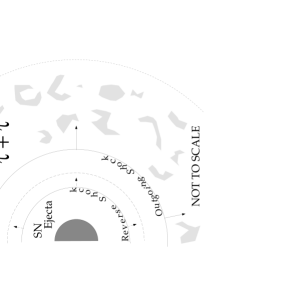
A cartoon of the expected structure of the SN and its surrounding media is presented in Fig. 1. The radio emission is expected to arise near the outgoing shock ([Chevalier & Fransson 1994]).
3 Results
The success of the basic parameterization and model description can be seen in the relatively good correspondence between the model fits and the data for all three subtypes of RSNe, Type Ib SN 1983N (Fig. 2), Type Ic SN 1990B (Fig. 3), and Type II SN 1979C (Fig. 4a) and SN 1980K (Fig. 4b). (Note that after day , the evolution of the radio emission from both SN 1979C and SN 1980K deviates from the expected model evolution; see 4 for discussion of these changes.)


.


3.1 Mass-loss Rate & Change in Mass-loss Rate
From the Chevalier (1982a,b) model, the turn-on of the radio emission for RSNe provides a measure of the presupernova mass-loss-rate to stellar-wind-velocity ratio. Using the formulation of Weiler et al. (1986; Eq. 16), we can write
| (3.5) |
where is the presupernova mass-loss rate, is the presupernova wind velocity, is the same as in Eq. 2.2, is the SN shock deceleration index (shock radius ), is the initial SN shock velocity ( km s-1), and is the temperature of the circumstellar material ( K).
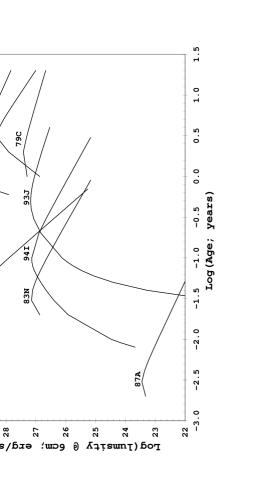
From Eq. 3.5 the mass-loss rates from SN progenitors are generally estimated to be M⊙ yr-1 for Type Ib/c SNe and M⊙ yr-1 for Type II SNe. For the specific case of SN 1993J, where detailed radio observations are available starting just a few days after explosion, Van Dyk et al. (1994) find evidence for a changing mass-loss rate (Fig. 5) for the presupernova star, which was as high as M⊙ yr-1 approximately 1000 years before explosion and decreased to M⊙ yr-1 just before explosion. Recently Fransson & Björgsson (1998) have shown that the observed behavior of the free-free absorption for SN 1993J could alternatively be explained in terms of a systematic decrease of the electron temperature in the circumstellar material as the SN expands. It is not clear, however, what the physical process is which determines why such a cooling occurs efficiently in some SNe and not in others.

3.2 Clumpiness of the Presupernova Wind
In their study of the radio emission from SN 1986J, Weiler, Panagia, & Sramek (1990) found that the simple Chevalier (1982a,b) model could not describe the relatively slow turn-on. They therefore added terms described mathematically by in Eqs. 2.1 and 2.3. This extension greatly improved the quality of the fit and was interpreted by Weiler, Panagia, & Sramek (1990) to represent the possible presence of filamentation or clumpiness in the CSM.
Such a clumpiness in the wind material was again required for modeling the radio data from SN 1988Z ([Van Dyk et al. 1993]) and SN 1993J ([Van Dyk et al. 1994]). Since that time, evidence for filamentation in the envelopes of SNe has also been found from optical and UV observations ([Filippenko, Matheson, & Barth 1994], [Spyromilio 1994]).
3.3 Binary Systems
In the process of analyzing a full decade of radio measurements from SN 1979C, Weiler et al. (1991, 1992a) found evidence for a significant, quasi-periodic, variation in the amplitude of the radio emission at all wavelengths of % with a period of 1575 days or years (see Fig. 4a at age 4300 days). They interpreted the variation as due to a minor ( %) density modulation, with a period of years, on the larger, relatively constant presupernova stellar mass-loss rate. Since such a long period is inconsistent with most models for stellar pulsations, they concluded that the modulation may be produced by interaction of a binary companion in an eccentric orbit with the stellar wind from the presupernova RSG. This concept was strengthened by more detailed calculations for a binary model from Schwarz & Pringle (1996). Since that time, the presence of binary companions has been suggested for the progenitors of SN 1993J ([Podsiadlowski et al. 1993]) and SN 1994I ([Nomoto et al. 1994]), indicating that binaries may be common in presupernova systems.
3.4 HII Along the Line-of-Sight
A reanalysis of the radio data for SN 1978K from Ryder et al. (1993) clearly shows flux density evolution characteristic of normal Type II SNe. Additionally, the data indicate the need for a time-independent, free-free absorption component along the line-of-sight. Montes, Weiler, & Panagia (1997) interpret this constant absorption term as indicative of the presence of HII along the line-of-sight to SN 1978K, perhaps a part of an HII region or a distant circumstellar shell associated with the SN progenitor. SN 1978K had already been noted for its lack of optical emission lines broader than a few thousand km s-1 since its discovery in 1990 ([Ryder et al. 1993]), indeed suggesting the presence of slowly moving circumstellar material.
To determine the nature of this absorbing region, a high-dispersion spectrum of SN 1978K at the wavelength range 6530 – 6610 Å was obtained by Chu et al. (1999). The spectrum shows not only the moderately broad H emission of the supernova ejecta, but also narrow nebular H and [N II] emission. The high [N II] 6583/H ratio of 0.8 – 1.3 suggests that this radio absorbing region is a stellar ejecta nebula. The expansion velocity and emission measure of the nebula are consistent with those seen in ejecta nebulae of luminous blue variables. Previous low-dispersion spectra have detected a strong [N II] 5755Å line, indicating an electron density of (3 – 12) cm-3. These data suggest that the ejecta nebula detected towards SN 1978K is probably part of the pre-shock dense circumstellar envelope of SN 1978K. Another possible example of this type of system may be SN 1997ab, which looks in its optical spectrum like a young version of SN 1978K.
4 Rapid Pre-Supernova Stellar Evolution
SN radio emission that preserves its spectral index while deviating from the standard model is taken to be evidence for a change of the average circumstellar density behavior from the canonical law expected for a pre-SN wind with a constant mass-loss rate, , and a constant wind velocity, . Since the radio luminosity of a SN is proportional to ([Chevalier 1982a]) or, equivalently, to the same power of the circumstellar density (since ), a measure of the deviation from the standard model provides an indication of deviation of the circumstellar density from the law. Monitoring the radio light curves of RSNe also provides a rough estimate of the time scale of deviations in the presupernova stellar wind density. Since the SN shock travels through the CSM roughly 1000 times faster than the stellar wind velocity which established the CSM ( km s-1 vs. km s-1) one year of radio light curve monitoring samples roughly 1000 years of stellar wind mass-loss history.
4.1 Radio Evidence for CSM Structure
SN 1979C (Type IIL) prior to 1991 (age 4300 days; 12 years) follows a standard, albeit sinusoidally modulated, declining radio emission (see 3.3). However, for age 4300 days a slow increase in the radio light curve occurs at all wavelengths (see Fig. 4a). By day , this change in evolution implies an excess in flux density by a factor of 1.7 with respect to the standard model, or a density enhancement by a factor of 1.34 over the expected density at that radius. This may be understood as a change of the average CSM density profile from the law which was applicable until day 4300, to an appreciably flatter behavior of ([Montes et al. 2000]).
SN 1980K (Type IIL) prior to epoch 3700 days ( years) is also well behaved. However, more recent measurements show a steep decline in flux density at all wavelengths by a factor of occurring between day 3700 and day 4900 (see Fig. 4b). Such a sharp decline in flux density implies a decrease in by a factor of below that expected for a CSM density profile ([Montes et al. 1998]).
SN 1988Z (Type IIn), similarly to SN 1980K, shows a sharp drop in its flux density with respect to its expected radio evolution at an age of a few thousand days (several years). Although the parameters of the change are yet to be quantified, it appears to also have evolved rapidly in the last several thousand years before explosion ([Lacey et al. 2000]).
SN 1987A (Type II) is the best studied RSN because its proximity makes it easily detectable even at very low radio brightness. The progenitor to SN 1987A was in a blue supergiant (BSG) phase at the time of explosion and had ended a RSG phase some ten thousand years earlier. After an initial, very rapidly evolving radio outburst ([Turtle et al. 1987]) which reached a peak flux density at 6 cm orders-of-magnitude fainter than other known Type II RSNe (presumably due to sensitivity limited selection effects), the radio emission declined to a low radio brightness within a year. However, at an age of years the radio emission started increasing again and continues to increase at the present time (see [Ball et al. 1995], [Gaensler et al. 1997]). Although its extremely rapid development resulted in the early radio data at higher frequencies being almost non-existent, the evolution of the initial radio outburst is roughly consistent with the models described above in Eqs. 2.1 – 2.4 (i.e., a shock front expanding into a spherically symmetric circumstellar envelope). The density implied by such modeling is appropriate to a pre-SN mass-loss rate of M⊙ yr-1 for a wind velocity of km s-1. Because the Hubble Space Telescope (HST) can actually image the denser regions of the CSM around SN 1987A, we know that the current rise in radio flux density is caused by the interaction of the SN shock with the diffuse material at the inner edge of the well known inner circumstellar ring ([Gaensler et al. 1997]). Since the density increases as the SN shock interaction region moves deeper into the main body of the optical ring, the flux density is expected to continue to increase steadily at all wavelengths. Recently, increases at optical and X-ray have also been reported ([Garnavich, Kirshner, & Challis 1997], [Hasinger, Aschenbach, & Truemper 1996]). Best estimates are that the shock/CSM interaction will reach a maximum by .
4.2 Discussion of CSM Structure
For at least four supernovae, namely SN 1979C, SN 1980K, SN 1988Z, and SN 1987A, we have significant changes in radio flux density occurring a few years after the explosion. Since the SN shock is moving about 1000 times faster than the wind material of the RSG progenitor (i.e., km s-1 vs. km s-1), such a time interval implies a significant change in the pre-supernova stellar wind properties several thousand years before the explosion. Such an interval is short compared to the lifetimes of typical RSN progenitors (say, 10 – 30 Myrs) but is a sizeable fraction of its red supergiant phase (2 – 5 yrs), suggesting that a significant transition occurs in the evolution of pre-supernova stars just before the final explosive event.
Since the radio emission is determined by the mass-loss-rate to stellar-wind-velocity ratio (), one of these quantities, or both are required to change by as much as a factor of 2 over the last few thousand years before the SN explosion. Such a time is too short (for H and He burning), or too long (for C and heavier element burning) to correspond to any of the known nuclear burning phases and, therefore, it is unlikely that the stellar luminosity (which determines the mass-loss rate, ) can vary on a time scale needed to account for the observed changes.
On the other hand, the wind velocity, , is roughly proportional to the square of the effective temperature (, e.g., [Panagia & Macchetto 1982]) so that a change of a factor of in requires a change of a factor of only in , e.g., from K to K or, correspondingly, a change from an early M to an early K supergiant spectrum. Such a transition would define a loop in the HR diagram reminiscent of the blue loops which are characteristic of the evolution of moderately massive stars (e.g., [Brocato & Castellani 1993], [Langer & Maeder 1995]). However, the apparent transition implied by these CSM density changes cannot be classical blue loops, since classical blue loops are much slower and more extreme processes occurring several years before the terminal stages of an RSG and involving temperature excursions from K to K.
The smaller temperature changes which we infer from the radio data require a star to change only from a very red to a moderately red spectrum, and back, corresponding to a transition in the HR diagram which is more appropriately dubbed a “pink loop.” The cause of such loops is not obvious, but may be similar to the not-so-well understood phenomenon that caused the SN 1987A progenitor to move in the HR diagram from being a red supergiant to a blue supergiant some years before explosion.
Another possibility for explaining these implied CSM density changes around at least some presupernova stars derives from a recent study by Panagia & Bono (this Conference). They find from modeling that the pulsational instability of stars in the mass range 10 – 20 may, in some cases, be of suitable period and magnitude to account for the changes of the pre-supernova mass-loss rates implied by radio observations of RSNe.

5 Peak Radio Luminosities and Distances
Our long-term monitoring of the radio emission from supernovae shows that the radio “light curves” evolve in a systematic fashion with a distinct peak flux density (and thus, in combination with a distance, a peak spectral luminosity) at each frequency and a well-defined time from explosion to that peak. Studying these two quantities at 6 cm wavelength, peak spectral luminosity () and time after explosion date () to reach that peak (), we find that they appear related (Fig. 6; see also [Weiler et al. 1998]). In particular, based on twelve objects, Type II supernovae appear to obey a relation
| (5.6) |
with time measured in days. Thus, if this relation is supported by further observations, it provides a means for determining distances to supernovae, and thus to their parent galaxies, from purely radio continuum observations.
Although there are still relatively few objects to which this techniques can be applied, RSNe could eventually provide a powerful and independent technique for investigating the long-standing problem of distance estimates in astronomy. With such intrinsically bright Type II RSNe as SN 1988Z and SN 1986J, the technique can be applied to distances of at least 100 Mpc with current VLA technology. With future sensitivity improvements and planned, new, more sensitive radio telescopes, the technique could be extended to large distances, even for less luminous RSNe. For example, with a sensitivity of 1 Jy, a SN of the same class as SNe 1988Z and 1986J could be detected to a redshift of , while a relatively radio faint Type II SN, such as SN 1980K, could be studied to a redshift of .
6 Sphericity of an SN explosion
It has often been suggested that SN explosions are non-spherical, and there is evidence in a number of stellar systems for jets, lobes, and other directed mass-loss phenomena. Also, the presence of polarization in the optical light from SNe (including SN 1993J) has been interpreted for non-sphericity (see, e.g., [Hoeflich et al. 1996]) and probably the most obvious evidence for non-spherical structure in an SN system is the very prominent inner ring around SN 1987A. However, our most direct evidence for the structure of at least the shock wave from an SN explosion and the CSM with which it is interacting is from VLBI measurements on SN 1993J. A series of images taken by Marcaide and co-workers (Fig. 7; [Marcaide et al. 1997]) over a period of two years from 1994 September through 1996 October show only a very regular ring shape indicative of a relatively spherical shock wave expanding into a relatively uniform CSM. The cause of such apparently conflicting results is still to be resolved.
7 Summary of RSN Studies
Arising from one of the most energetic phenomena in the Universe, the radio emission from supernovae appears to be relatively well understood in terms of shock interaction with a structured circumstellar medium as described by the Chevalier (1982a,b) model and its modifications ([Weiler et al. 1986], [Weiler, Panagia, & Sramek 1990], and [Weiler et al. 1991]). With this modeling, the radio emission can be used to estimate the circumstellar density, the pre-SN mass loss rate and changes therein, to show the existence of filamentation in the pre-SN stellar wind, to indicate the possible presence of binary companions, and to measure the symmetry of the explosion and the CSM with which it is interacting. More speculatively, radio observations may also lead to a more physical classification system for SNe and provide a new technique for estimating distances to SNe and their parent galaxies.
However, the recent suggestion of an association of the -ray burst GRB 980425 with the Type Ic supernova SN 1998bw provides evidence for yet a new phenomenon which may arise in at least some types of SN explosions. Since SN 1998bw is a strong radio emitter, it is important to consider how it compares with the known properties of RSNe discussed above.
8 Gamma-Ray Bursts and SN 1998bw
8.1 Gamma-ray Burst Afterglows
Gamma-ray bursts (GRBs) are “mysterious” flashes of high-energy radiation that appear from random directions in space and typically last a few seconds. They were first discovered by U.S. Air Force Vela satellites in the 1960s and, since then, numerous theories of their origin have been proposed. NASA’s Compton Gamma-Ray Observatory (CGRO) satellite has detected several thousand bursts so far, with an occurrence rate of approximately one per day. The uniform distribution of the bursts on the sky has led theoreticians to suggest that their sources are either very near, and thus uniformly distributed around the solar system, are in an unexpectedly large halo around the Galaxy, or are at cosmological distances – not very restrictive proposals.
The principal limitation to understanding the origin of the bursts has been the difficulty in pinpointing their direction on the sky in order to obtain the multi-wavelength observations necessary to constrain physical models. Gamma-rays are exceedingly difficult to focus on to a position sensitive detector, and the bursts’ short duration exacerbates the problem. Only with the launch of the Italian/Dutch satellite BeppoSAX in 1996 has it been possible to couple a quick response pointing system with relatively high precision position sensitive detectors for -rays and hard X-rays. This quick response, high accuracy position information has finally permitted rapid and accurate follow-up observations with the world’s powerful ground-based and space-based telescopes, and has led to the discovery of long-lived “afterglows” of the bursts in soft X-rays, visible and infrared light, and radio waves. Although the -ray bursts generally last only seconds, their afterglows have, in a few cases, been studied for minutes, hours, days, or even weeks after discovery. These longer wavelength observations have allowed observers to probe the immediate environment of -ray burst sources and to assemble clues as to their nature.
The first GRB related optical transient was identified for GRB 970228 by Groot et al. (1997) and followup with HST by Sahu et al. (1997) demonstrated that the GRB was associated with a faint (thus probably distant) late-type galaxy. A few months later Fruchter & Bergeron 1997; see also [Pian et al. 1998]) imaged the afterglow of another -ray burst, GRB 970508, with the HST WFPC2 finding this source to be associated with a late-type galaxy at a redshift of . GRB 970508 was also the first GRB to be detected in its radio afterglow ([Frail & Kulkarni 1997]).
Heise et al. (1997) detected the very energetic -ray burst GRB 971214 on 1997 December 14 with the BeppoSAX satellite and provided sufficient positional accuracy for Halpern et al. (1997) to identify a visible light afterglow using the KPNO 2.1 m telescope. As the visible light from the burst afterglow faded, an extremely faint galaxy () was detected at its position. Using the 10-meter Keck II telescope on Mauna Kea, Hawaii, Kulkarni et al. (1998a) measured a redshift of . Subsequent images taken with the HST ([Odewahn et al. 1998]) confirmed the association of the burst afterglow and the redshift of this faint galaxy. For such a large distance, Odewahn et al. (1998) estimated that the amount of energy released in the -ray flash was extremely high, erg. Thus, it appears that at least some GRB sources are very energetic explosions (hypernovae?; [Paczynski 1998], [Iwamoto et al. 1998]) occurring at cosmological distances.
8.2 GRB 980425 and SN 1998bw
8.2.1 Background
While still generally accepted that “most” GRBs are extremely distant and energetic, the discovery of GRB 980425 ([Soffitta et al. 1998]) on 1998 April 25.90915 and its possible association with a bright supernova, SN 1998bw at RA(J2000) = , Dec(J2000) = (Tinney et al. 1998), in the relatively nearby spiral galaxy ESO 184-G82 at (distance Mpc for km s-1 Mpc-1; Galama et al. 1998, [Lidman et al. 1998], [Tinney et al. 1998], [Sadler et al. 1998]), has introduced the possibility of multiple origins for GRBs. The estimated explosion date of SN 1998bw in the interval 1998 April 21 – 27 ([Sadler et al. 1998]) corresponds rather well with the time of GRB 980425. Iwamoto et al. (1998) feel that they can restrict the core collapse date for SN 1998bw even more from hydrodynamical modeling of exploding C + O stars and, assuming that the SN 1998bw optical light curve is generated by 56Ni as in Type Ia SNe, they then restrict the coincidence between the core collapse of SN 1998bw to within +0.7/2 days of the detection of GRB 980425.
Classified initially as an SN optical Type Ib ([Sadler et al. 1998]), then Type Ic (Patat & Piemonte 1998), then peculiar Type Ic (Kay, Halpern, & Leighly 1998, Filippenko 1998), then later, at an age of 300 - 400 days, again as a Type Ib ([Patat et al. 1999]), SN 1998bw presents a number of optical spectral peculiarities which strengthen the suspicion that it may be the counterpart of the -ray burst.
However, some doubt remains concerning the association of GRB 980425 with SN 1998bw. When the more precise BeppoSAX NFI was pointed at the BeppoSAX error box 10 hours after the detection of GRB 980425, two X-ray sources were present ([Pian et al. 1999]). One of these, named S1 by Pian et al. (1999), is coincident with the position of SN 1998bw and declined slowly between 1998 April and 1998 November. The second X-ray source, S2, which was from the position of SN 1998bw, was, at best, only marginally detected at six days after the initial detection, and not detectable again in follow up observations in 1998 April, May, and November ([Pian et al. 1999]). Even though the a posteriori statistics indicate a very low probability() of a GRB being nearly coincident in space and time with a SN outburst, the concern remains that the Pian source S2 was the brief afterglow from GRB 980425 rather than the Pian source S1 associated with SN 1998bw.
8.2.2 Radio emission
Since the peak absolute magnitude of Type Ib/c SN 1998bw, while bright at is not much brighter than Type Ib SN 1966J (, converted from km s-1 Mpc-1 to km s-1 Mpc-1, [Miller, & Branch 1990]) and less luminous than the Type Ic SN 1992ar, with ([Hamuy et al. 1992]), much of the argument for the unusual nature of SN 1998bw rests on the radio observations. (N.B.: SN 1966J may have been misclassified. [Van Dyk, Hamuy, & Filippenko 1996] indicate in a Note Added in Proof that D. Branch has reclassified SN 1966J as a Type Ia.)
The radio emission from SN 1998bw reached an unusually high 6 cm spectral luminosity at peak of erg s-1 Hz-1, i.e., about 3 times higher than any of the relatively well studied radio RSNe and 30 – 40 times higher than a typical Type Ib/c SN at peak (see Table 2 and [Weiler et al. 1998]). Unfortunately, it is not clear how significant is this “excess” radio luminosity, since only 6 other examples of radio emitting Type Ib/c SNe are known (see Table 1). Also, one must keep in mind that, contrary to the often stated opinion that SN 1998bw is “the most luminous radio supernova ever observed,” SN 1998bw is still exceeded in peak 6 cm spectral luminosity by the poorly studied, presumed supernova, SN 1982aa ([Green 1994]) in the starburst galaxy NGC 6052 (Markarian 297). SN 1982aa is estimated to have peaked at a 6 cm spectral luminosity of erg s-1 Hz-1. Although SN 1982aa was not optically identified and, therefore, has no optical spectral type classification, its radio evolution strongly resembles that of Type II RSNe ([Yin 1994]).
| SN Name | Type | Peak 6cm Luminosity |
|---|---|---|
| (erg s-1 Hz-1) | ||
| 1983N | Ib | |
| 1984L | Ib | |
| 1990B | Ic | |
| 1994I | Ic | |
| 1997X | Ic | |
| 1998bw | Ib/c |
As a further check for unusual characteristics of SN 1998bw, we can compare a smoothed 6 cm light curve for SN 1998bw with model 6 cm light curves for other RSNe. This is illustrated in Fig. 8. Inspection of the figure shows that SN 1998bw is unusual in its radio emission, but not extreme. For example, the time from explosion to peak 6 cm luminosity for both SN 1987A and SN 1983N was faster and, as mentioned above, the 6 cm spectral luminosity of SN 1998bw at peak is exceeded by that of SN 1982aa. However, as is clear from Fig. 8, SN 1998bw is the most luminous Type Ib/c RSN ever observed by a factor of , and it reached a higher radio luminosity earlier than any RSN known.
8.2.3 Brightness temperature
Although unique in neither the speed of evolution nor in radio luminosity, SN 1998bw is certainly unusual in the combination of these two factors – very radio luminous very soon after explosion. Kulkarni et al. (1998b,c) have used these observed qualities, together with the lack of interstellar scintillation at early times, brightness temperature estimates, and physical arguments to conclude that the shock wave from SN 1998bw giving rise to the radio emission must have been expanding relativistically. On the other hand, Waxman & Loeb (1999) argue that a sub-relativistic shock can generate the observed radio emission. However, both sets of authors agree that a very high expansion velocity () is required for the radio emitting region under a spherical geometry.
Simple arguments confirm this high velocity since, to avoid the well-known “Compton Catastrophe,” Kellermann & Pauliny-Toth (1969) have shown that K must hold, and Readhead (1994) has better defined this limit to K. From geometrical arguments, such a limit requires the radiosphere of SN 1998bw to have expanded at km s-1, at least during the first few days after explosion. While such a value is still only mildly relativistic ( 1.5), it seems very high. However, measurements by Gaensler et al. (1997) have demonstrated that the radio emitting regions of SN 1987A have expanded at an average velocity of km s-1 over the 3 years from 1987 February to mid-1990, so that, in a very low density environment such as one finds around Type Ib/c SNe, very high shock velocities may be possible.
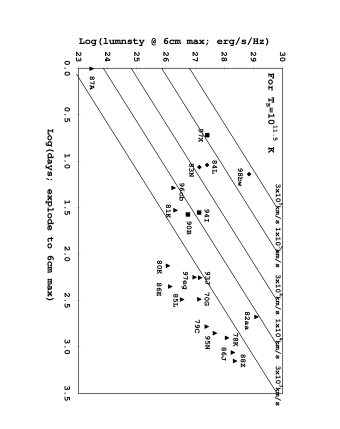
This is illustrated graphically in Fig. 9 where, for an adopted brightness temperature of K, the lines of constant expansion velocity are shown on a plot of the 6 cm spectral luminosity at peak vs. the time to reach that peak for a number of RSNe. Although expected, it is noteworthy that all Type II SNe, which have relatively dense circumstellar envelopes, have the lowest expansion velocities, while the Type Ib/c SNe, with their relatively less dense CSM, have significantly higher expansion rates. Once again, SN 1998bw appears to represent a more extreme form of Type Ib/c RSNe.
8.2.4 Radio light curves
A final, obvious comparison of SN 1998bw with other RSNe is the
evolution of its radio flux density at multiple frequencies. The
radio data for the first 80 days are plotted in Kulkarni et al. (1998c),
up to day 250 on
http://www.narrabri.atnf.csiro.au/public/grb
/grb980425/, and have been
kindly supplied to us in tabular form by D. A. Frail (private
communication). SN 1998bw shows an early peak at higher frequencies
( GHz), which reaches a maximum as early as
day 10 – 12 at 8.64 GHz, drops to a minimum almost simultaneously for the
higher frequencies at day 20 – 24, and then reaches a secondary, somewhat
lower peak at later times after the first dip. An interesting
characteristic of this “double humped” structure is that it dies out
at lower frequencies and is relatively inconspicuous in the 1.4 GHz
radio measurements (see Fig. 10). Such a structure is not as
prominent for other known radio supernovae on such a short time scale,
although the Type Ic SN 1994I (S. D. Van Dyk, private communication)
shows a dip in its 15 GHz flux density, also at an age of
days.
Li & Chevalier (2000) propose an initially synchrotron self-absorbed (SSA), rapidly expanding shock wave in a circumstellar wind model to describe the radio light curve. This is in many ways similar to the Chevalier (1998) model for Type Ib/c SNe, which also included SSA, and the structure described in 2.1, which includes only thermal free-free initial absorption. However, to improve the quality of the fit, Li & Chevalier (2000) introduce the additional free parameters of a boost of shock energy by a factor of on day 22 in the observer’s time frame. This provides the energy necessary to produce the second peak in the radio light curves.
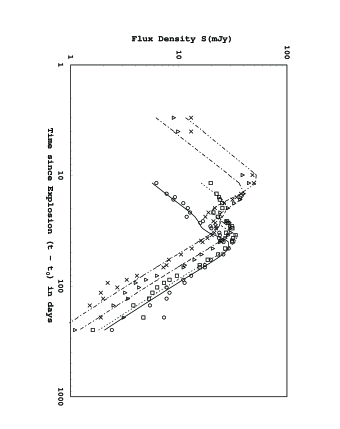
While is not possible to rule out such complexities, we have attempted to describe the radio light curve by a relatively straightforward, two-component model, very similar to those used successfully for previous SNe described above in 2.1. Such an approach has no requirement for shock re-acceleration. Also, although an attempt was made to include the effects of SSA at early times, the fit was not improved by such an addition. The two component model fit which we obtained using only synchrotron emission and thermal, free-free absorption is shown as the lines in Fig. 10, and its parameter values are listed in Table 3. The “double humped” structure of the radio light curves for SN 1998bw is reproduced by a single energy shock wave encountering regions of differing CSM density as it travels rapidly outward.
| Parameter | Component 1 | Component 2 |
|---|---|---|
| -1.08 | -0.80 | |
| -3.13 | -1.55 | |
| 0 | 0 | |
| – | – | |
| -4.43 | -8.80 | |
Since Li & Chevalier (2000) do not give a quantitative indication of the quality of their fit, it is impossible to compare the two models directly. However, a visual comparison of Fig. 10 here with their Fig. 9 indicates that the fits are of similar quality at late times and low frequencies, where the initial absorption mechanisms have become less important. This is not surprising, since they are based on the same models from Chevalier (1982a,b). Both our model and the Li & Chevalier (2000) model have difficulty adequately describing the dip at all frequencies near day 20. However, at early times and high frequencies the free-free absorption model shown in Fig. 10 gives a clearly superior fit to the data to that of Li & Chevalier (2000).
Note that our fit requires essentially no diffuse/uniform absorption ( = 0; see Table 3 and Eqs. 2.1 – 2.4), so that all of the free-free absorption either is due to a clumpy medium or is internal to the emitting zones (which has the same mathematical form), both of which contribute to a term in Table 3 and Eqs. 2.1 – 2.4. These results, combined with the estimate of a high shock velocity, suggest that the CSM around SN 1998bw is highly clumped in numerous and dense knots with little, if any, intra-knot gas. The clump filling factor has to be high enough to intercept a considerable fraction of the shock energy and still be low enough to let radiation escape from any given knot without being appreciably absorbed by any other knot. This can be somewhat quantified by postulating that the covering factor (i.e., the fraction of solid angle occupied by clumps) has to be less than 1/4 and, perhaps, greater than 1/10. In this scenario the shock front can easily move at a speed which is a significant fraction of the speed of light, because it is moving essentially in a vacuum. However, one still has strong energy dissipation and relativistic electron acceleration at the knot surfaces facing the SN explosion center. If the knots are dense and relatively opaque to radio emission, we mainly observe radiation produced at the surfaces of the knots in the CSM on the far-side of the SN in which some internal absorption is also occurring. The radiation from near-side knots is probably absorbed internally by the knots themselves and, therefore, lost from the signal we detect.
The presence of two components, as evidenced by the presence of two peaks in the radio light curve, implies the existence of two regimes within the clumpy CSM that surrounds the SN progenitor with the transition between the two regimes occurring at about 10 to 20 light-days from the star, i.e., at about 3 1016 cm or 3000 AU from the stellar progenitor. This distance may be somewhat speculatively interpreted as the separation of the exploding primary from a lower-mass binary companion, which is reminiscent of the binary structure inferred for SN 1979C (Weiler et al. 1992a, Boffi & Panagia 1996). In the case of SN 1998bw a mass at explosion of about 14 M⊙ and an original progenitor mass of 30 – 40 M⊙ has been proposed (Danziger et al., this Conference). A binary hypothesis is also the best explanation for the large mass loss that the progenitor star must have suffered to expose the H-free layers typical of Type Ib/c supernovae before exploding. Within this framework, one may argue that the CSM within the SN progenitor Roche lobe was mostly determined by the progenitor mass-loss itself, whereas at larger distances the CSM was largely determined by the interaction of the progenitor wind with the companion wind, thus leading to a two-component CSM structure.
Clearly, there is much more complexity in the physics of the GRB phenomenon and the structure of the SN 1998bw system than can be described by simple models, and none proposed is completely satisfactory as yet. However, while the -ray emission itself appears to require relativistic boosting, the radio emission from the best-studied possible example, SN 1998bw, need not be interpreted as proof of relativistic beaming, highly relativistic shock waves, or other esoteric phenomena. Only mildly relativistic processes and thermal absorption by the ionized CSM appear at least satisfactory and the arguments for a SN 1998bw/GRB 980425 connection are correspondingly weakened.
8.2.5 Summary of SN 1998bw/GRB 980425 relations
On balance, SN 1998bw appears to be a relatively normal, if rather over-bright example of the SN Type Ib/c phenomenon. Many observers tend to accept that it is associated with GRB 980425, and it is impossible to disprove that postulate. On the other hand, neither the optical nor radio emission are sufficiently unusual to firmly establish a connection, and the Pian et al. (1999) X-ray source S2 in the GRB field remains a distinct possibility for the location of GRB 980425. We can only hope that both the continued study of the GRB phenomenon and its (sometimes) associated afterglows, and the slowly increasing statistics of observations of Type Ib/c SNe, will be able to establish the true nature of both phenomena and any possible relation.
8.3 Acknowledgments
CKL, KWW, & MJM wish to thank the Office of Naval Research (ONR) for the 6.1 funding supporting this research.
References
- Ball et al. 1995 Ball, L., Campbell-Wilson, D., Crawford, D. F. & Turtle, A. J. 1995, Astrophys. J. 453, 864
- Bartel et al. 1985 Bartel, N. et al. 1985, Nature 318, 25
- Boffi & Panagia 1996 Boffi, F. R. & Panagia, N. 1996. In Radio Emission from the Stars and the Sun (ed. A. R. Taylor & J. M. Paredes). Astr. Soc. Pacific Conf. Series, vol. 93, p. 153
- Bono & Panagia 2000 Bono, G. & Panagia, N. 2000, in preparation.
- Brocato & Castellani 1993 Brocato, E. & Castellani, V. 1993, Astrophys. J. 410, 99
- Chevalier 1982a Chevalier, R. A. 1982a, Astrophys. J. 259, 302
- Chevalier 1982b Chevalier, R. A. 1982b, Astrophys. J. Lett. 259, L85
- Chevalier 1998 Chevalier, R. A. 1998, Astrophys. J. 499, 810
- Chevalier & Fransson 1994 Chevalier, R. A. & Fransson, C. 1994, Astrophys. J. 420, 268
- Chu et al. 1999 Chu, Y.-H., Caulet, A., Montes, M. J., Panagia, N., Van Dyk, S. D., & Weiler, K. W. 1999, Astrophys. J. Lett. 512, L51.
- Filippenko 1998 Filippenko, A. 1998, IAUC 6969
- Filippenko, Matheson, & Barth 1994 Filippenko, A., Matheson, T., & Barth, A. 1994, Astron. J. 108, 222
- Frail & Kulkarni 1997 Frail, D. A. & Kulkarni, S. R. 1997, IAUC 6662
- Fransson & Björgsson 1998 Fransson, C. & Björgsson, C.-I. 1998, Astrophys. J. 509, 861
- Fruchter, & Bergeron 1997 Fruchter, A. & Bergeron, L. 1997, IAUC 6674
- Gaensler et al. 1997 Gaensler, B. M., Manchester, R. N., Staveley-Smith, L., Tzioumis, A. K., Reynolds, J. E., & Kesteven, M. J. 1997, Astrophys. J. 479, 845
- Galama et al. 1998 Galama, T. J. et al. 1998, IAUC 6895
- Garnavich, Kirshner, & Challis 1997 Garnavich, P., Kirshner, R., & Challis, P. 1997, IAUC 6710
- Green 1994 Green, D. W. E. 1994, IAUC 5953
- Groot et al. 1997 Groot, P. J. et al. 1997, IAUC 6584
- Halpern et al. 1997 Halpern, J. et al. 1997, IAUC 6788
- Hasinger, Aschenbach, & Truemper 1996 Hasinger, G., Aschenbach, B., & Truemper, J. 1996, Astron. Astrophys. 312, 9
- Heise et al. 1997 Heise, J. et al. 1997, IAUC 6787
- Hoeflich et al. 1996 Hoeflich, P., Wheeler, J. C., Hines, D. C., & Tramaell, S. R. 1996, Astrophys. J. 459, 307
- Hamuy et al. 1992 Hamuy, M. et al. 1992, IAUC 5574
- Iwamoto et al. 1998 Iwamoto, K. et al. 1998, Nature 395, 672
- Kay, Halpern, & Leighly 1998 Kay, L. E., Halpern, J. P., & Leighly, K. M. 1998, IAUC 6969
- Kellermann & Pauliny-Toth 1969 Kellermann, K. I. & Pauliny-Toth, I. I. K. 1969, Astrophys. J. Lett. 155, L71
- Kulkarni et al. 1998a Kulkarni, S. et al. 1998a, Nature 393, 35
- Kulkarni et al. 1998b Kulkarni, S. R., Bloom, J. S., Frail, D. A., Ekers, R., Wieringa, M., Wark, R., & Higdon, J. L. 1998b, IAUC 6903
- Kulkarni et al. 1998c Kulkarni, S. R., Frail, D. A., Wieringa, M. H., Ekers, R. D., Sadler, E. M., Wark, R. M., Higdon, J. L., Phinney, E. S., & Bloom, J. S. 1998c, Nature 395, 663
- Lacey et al. 2000 Lacey, C. K., Weiler, K. W., Sramek, R. A., Panagia, N., & Van Dyk, S. D. 2000, in preparation
- Lang 1986 Lang, K.R. 1986. In Astrophysical Formulae, 47. Springer-Verlag
- Langer & Maeder 1995 Langer, N. & Maeder, A. 1995, Astron. Astrophys. 295, 685
- Li & Chevalier 2000 Li, Z.-Y. & Chevalier, R. A. 2000, in press (also astro-ph/9903483)
- Lidman et al. 1998 Lidman, C. et al. 1998, IAUC 6895
- Marcaide et al. 1997 Marcaide, J. M. et al. 1997, Astrophys. J. Lett. 486, L31
- Miller, & Branch 1990 Miller, D. L. & Branch, D. 1990, Astron. J. 100, 530
- Montes, Weiler, & Panagia 1997 Montes, M. J., Weiler, K. W., & Panagia, N. 1997, Astrophys. J. 488, 792
- Montes et al. 1998 Montes, M. J., Van Dyk, S. D., Weiler, K. W., Sramek, R. A., & Panagia, N. 1998, Astrophys. J. 506, 874
- Montes et al. 2000 Montes, M. J., Weiler, K. W., Van Dyk, S. D., Sramek, R. A., Panagia, N., & Park, R. 2000, Astrophys. J., in press (also astro-ph/9911399)
- Nomoto et al. 1994 Nomoto, K., Yamaoka, H., Pols, O. R., van den Heuvel, E., Iwamoto, K., Kumagai, S., & Shigeyama, T. 1994, Nature 371, 227
- Odewahn et al. 1998 Odewahn, S. C. et al. 1998, Astrophys. J. 509, 5
- Paczynski 1998 Paczynski, B. 1998, Astrophys. J. Lett. 494, L45
- Panagia & Macchetto 1982 Panagia, N. & Macchetto, F. 1982, Astron. Astrophys. 106, 266
- Patat et al. 1999 Patat, F., Cappellaro, E., Rizzi, L., Turatto, M., & Benetti, S. 1999, IAUC 7215
- Patat & Piemonte 1998 Patat, F. & Piemonte, A. 1998, IAUC 6918
- Pian et al. 1998 Pian, E. et al. 1998, Astrophys. J. Lett. 492, L103
- Pian et al. 1999 Pian, E. et al. 1999, Astron. Astrophys. Suppl. Ser. 138, 463
- Podsiadlowski et al. 1993 Podsiadlowski, P., Hsu, J., Joss, P., & Ross, R. 1993, Nature 364, 509
- Readhead 1994 Readhead, A. C. S. 1994, Astrophys. J. 426, 51
- Ryder et al. 1993 Ryder, S., Staveley-Smith, L., Dopita, M., Petre, R., Colbert, E., Malin, D., & Schlegel, E. 1993, Astrophys. J. 417, 167
- Sadler et al. 1998 Sadler, E. M., Stathakis, R. A., Boyle, B. J., & Ekers, R. D. 1998, IAUC 6901
- Sahu et al. 1997 Sahu, K. C. et al. 1997, Astrophys. J. Lett. 489, L127
- Schwarz & Pringle 1996 Schwarz, D. H. & Pringle, J. E. 1996, Mon. Not. R. Astr. Soc. 282, 1018
- Soffitta et al. 1998 Soffitta, P. et al. 1998, IAUC 6884
- Spyromilio 1994 Spyromilio, J. 1994, Mon. Not. R. Astr. Soc. 266, 61
- Tinney et al. 1998 Tinney, C., Stathakis, R., Cannon, R., & Galama, T. 1998, IAUC 6896
- Tully 1988 Tully, R. B. 1988. In Nearby Galaxies Catalogue. Cambridge Univ. Press.
- Turtle et al. 1987 Turtle, A. J., Campbell-Wilson, D., Bunton, J. D., Jauncey, D. L., Kesteven, M. J., Manchester, R. N., Norris, R. P., Storey, M. C., & Reynolds, J. E. 1987, Nature 327, 38
- Van Dyk et al. 1993 Van Dyk, S. D., Sramek, R. A., Weiler, K. W., & Panagia, N. 1993, Astrophys. J. Lett. 419, L69
- Van Dyk et al. 1994 Van Dyk, S. D., Weiler, K. W., Sramek, R. A., Rupen, M., & Panagia, N. 1994, Astrophys. J. Lett. 432, L115
- Van Dyk, Hamuy, & Filippenko 1996 Van Dyk, S. D., Hamuy, M., & Filippenko, A. V. 1996, Astron. J. 111, 2017
- Waxman & Loeb 1999 Waxman, E. & Loeb, A. 1999, Astrophys. J. 515, 721
- Weiler et al. 1986 Weiler, K. W., Sramek, R. A., Panagia, N., van der Hulst, J. M., & Salvati, M. 1986, Astrophys. J. 301, 790
- Weiler, Panagia, & Sramek 1990 Weiler, K. W., Panagia, N., & Sramek, R. A. 1990, Astrophys. J. 364, 611
- Weiler et al. 1991 Weiler, K. W., Van Dyk, S. D., Panagia, N., Sramek, R. A., & Discenna, J. 1991, Astrophys. J. 380, 161
- Weiler et al. 1992a Weiler, K. W., Van Dyk, S. D., Pringle, J., & Panagia, N. 1992a, Astrophys. J. 399, 672
- Weiler et al. 1992b Weiler, K. W., Van Dyk, S. D., Panagia, N., & Sramek, R. A. 1992b, Astrophys. J. 398, 248
- Weiler et al. 1998 Weiler, K. W., Van Dyk, S. D., Montes, M. J., Panagia, N., & Sramek, R. A. 1998, Astrophys. J. 500, 51
- Yin 1994 Yin, Q. F. 1994, Astrophys. J. 420, 152