Hot Stars and Cool Clouds: The Photodissociation Region M161
Abstract
We present high-resolution spectroscopy and images of a photodissociation region (PDR) in M16 obtained during commissioning of NIRSPEC on the Keck II telescope. PDRs play a significant role in regulating star formation, and M16 offers the opportunity to examine the physical processes of a PDR in detail. We simultaneously observe both the molecular and ionized phases of the PDR and resolve the spatial and kinematic differences between them. The most prominent regions of the PDR are viewed edge-on. Fluorescent emission from nearby stars is the primary excitation source, although collisions also preferentially populate the lowest vibrational levels of H2. Variations in density-sensitive emission line ratios demonstrate that the molecular cloud is clumpy, with an average density . We measure the kinetic temperature of the molecular region directly and find K. The observed density, temperature, and UV flux imply a photoelectric heating efficiency of 4%. In the ionized region, and K. In the brightest regions of the PDR, the recombination line widths include a non-thermal component, which we attribute to viewing geometry.
Subject headings:
infrared: ISM: lines and bands — ISM: individual (M16) — molecular processes1. Introduction
Star formation occurs in dense regions of the interstellar medium, and as a result, the environments of early-type stars often contain molecular clouds. In addition to creating an H II region, where hydrogen is predominantly ionized, stellar ultraviolet radiation creates a photodissociation region (PDR) when it interacts with molecular material. The feedback between extant stars and the nearby clouds in PDRs is important in regulating subsequent episodes of star formation. The UV flux determines the ionization fraction in molecular clouds, which in turn sets the ambipolar diffusion rate and thereby the rate of low-mass star formation (McKee (1989)).
Hollenbach & Tielens (1997, 1999) comprehensively review the physical and chemical processes of PDRs. Far-ultraviolet (FUV) photons () dissociate molecules and excite the gas on the surface () of the molecular cloud. The result is spatial stratification of molecular, atomic, and ionic components of a given element. At higher densities (), collisional excitation also populates the excited states (Sternberg & Dalgarno (1989)).
The columns of M16 (the Eagle Nebula) are PDRs. Most of the mass in the nebula is in molecular clouds, and a variety of molecular transitions are observed directly (Pound (1998); White et al. (1999)). H2 is observed on the cloud surfaces (Allen et al. (1999)), and at the interface with the H II region, the columns are prominent in optical emission lines (Hester et al. (1996)). The young cluster NGC 6611 contains many massive stars, which illuminate the columns with total FUV flux (Allen et al. (1999)) from a distance of about 2 pc (Hester et al. (1996)) .
We simultaneously observe the spatial and spectral relationship of the excited molecular and ionized phases of the PDR. Based on these observations (described in §2), we determine physical conditions in §3, and summarize the conclusions in §4.
2. Observations and Data Reduction
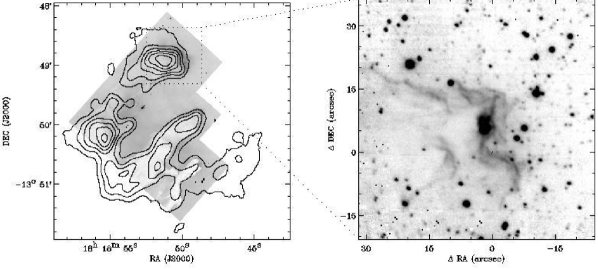
We obtained images and high resolution longslit spectra of the northernmost column of M16 using NIRSPEC, the facility near-infrared spectrometer on the Keck II 10-m telescope (McLean et al. (1998)). Figure 1a identifies the observed region on the Hubble Space Telescope H image of M16 (Hester et al. (1996)) with contours of integrated CO intensity (Pound (1998)). We used the slit-viewing camera to image M16 on 1999 July 6 (UT), obtaining 9 exposures of 60 s each. In addition to the H2 1-0S(1) filter, (bandpass 2.110–2.129 m) the NIRSPEC-6 filter (1.558–2.315 m) was in the optical path. We combined several observations of a blank field in the NIRSPEC-6 filter alone to use as a flat field and scaled this for sky subtraction from this crowded field. Figure 1b shows the resultant 2.12 m image and the spectroscopy slit.
We employed the NIRSPEC-6 blocking filter and selected echelle and cross disperser positions to detect several H2 rovibrational transitions, Br, and He I 2.06 m in our spectroscopic observations. We used the slit at position angle 135∘ for resolution , where is the observed of an unresolved emission line. We obtained six exposures of 300 s each on the night of 1999 April 30 (UT), nodding along the slit between each exposure.
We subtracted a median dark frame from each image, divided by a flat field, and interpolated over deviant pixels, removing both cosmic rays and bad detector pixels. The spectra required rectification in both the spectral and spatial dimensions. We used the OH night sky lines and wavenumbers tabulated by Abrams et al. (1994) for wavelength calibration and the continuum emission of the telluric standard for spatial rectification. We observed HD 161056 and reduced the spectra similarly, then modelled this B1.5V star as a K blackbody and interpolated over the stellar Br feature. We divided the M16 data by this spectrum to correct for atmospheric absorption and normalized the stellar spectrum from this standard at 2.2 m to flux calibrate the data.
Figure 3.1 contains the resultant two-dimensional spectra of several bright lines. We have subtracted off-source emission from each of these spectra. For the molecular emission, the background is near the edge of the slit toward the ionizing source, while for Br, the background lies away from the ionizing source. We list the complete set of detected lines, their vacuum wavelengths, their total fluxes in the slit, and their peak fluxes in Table 1.
3. Physical Conditions
3.1. Geometry
The gross structure of the photodissociation region is evident in the images (Fig. 1) and two-dimensional spectra (Fig. 3.1). Fewer stars are observed directly through the cloud than in the surrounding region (Fig. 1b), implying . From the center of the molecular cloud out to the photoionizing source, distinct regions of quiescent molecular, excited molecular, atomic, and ionized material appear. The FUV photons do not fully penetrate the molecular cloud, so the excited H2 resides only on the cloud’s surface. The optically-thin ionized emission is brightest in the regions of highest density, near the cloud, and it is spatially more extended than the H2 emission. The slit is aligned toward the ionizing source and covers several edges on the irregular surface of the cloud. Thus, we observe several distinct regions of photoevaporative flow. The greatest intensities are detected in the regions that are viewed edge-on.
In these observations, each of the bright regions within the PDR consists of spatially segregated molecular and recombination line emission. The two brightest regions at slit positions and in the 1-0S(1) emission, for example, are physically associated with the ionized emission at and , respectively (Fig. 3.1d). (Note, however, that the more spatially extended Br peak at the top of slit includes some contribution from a nearby surface north of the slit, which we do not observe in H2.) Moderate emission peaks appear at and , and fainter surfaces at , , and in the 1-0S(1) line. The first two of these are blended in the spatially extended Br emission, while the latter correspond to local emission maxima at , , and , so the projected separations of the H2 and Br emission regions in the plane of the sky range from 1.8 to cm at the 2000 pc distance of M16 (Humphreys (1978); Hillenbrand et al. (1993)). The transition from the atomic to molecular zone typically occurs at (Tielens & Hollenbach (1985)), or in terms of column density, . Thus, the average gas density in the bright regions of the PDR is 1.6–.
We determine the density in the ionized region and use the molecular line width (discussed below) to calculate the average density in the molecular region of the PDR. Bertoldi & Draine (1996) show , where is the Lyman continuum flux, is the distance to the ionizing source, accounts for attenuation of the ionization in the evaporative flow, and is the isothermal sound speed in the ionized medium. We determine the value of (Bertoldi (1989)), where is the cloud radius. We find the density of the ionized region , for (calculated for K, below) and . For pressure balance across the ionization front, , where is the of the molecular line width, so in the molecular region, . This is significantly greater than the density calculated above, which integrated over contributions from the ionized to the molecular region. Here, is determined in the molecular zone alone, which should be denser.
![[Uncaptioned image]](/html/astro-ph/0002491/assets/x2.png)
Two-dimensional spectra of bright lines. (a) H2 1-0S(1), 2.12 m, scaled linearly from 0 to . (b)H2 1-0S(0), 2.22 m, scaled linearly from 0 to . (c) Br, 2.17 m, scaled linearly from 0 to . (d) Contours of Br (solid lines) and H2 1-0S(1) (dotted lines) emission, in logarithmic intervals from 0.6 to . The Br emission is broader and closer to the ionizing source (located at the top of the slit) than the molecular lines. The two brightest regions in Br at slit positions and correspond to the H2 peaks at and , respectively.
3.2. Kinematics
The various gas phases exhibit distinct kinematic structure. We measure the line profiles at slit position in 1-0S(1) emission, which is clearly distinguished in the Br and He emission at . Because we observe this PDR nearly edge-on, the central velocities of the H and ionized material are not significantly different; the average motion occurs in the plane of the sky. We measure for this 1-0S(1) feature and in Br. In H2, , in Br, and in He I , after correcting for the instrumental profile. In the molecular gas, the velocity width corresponds to a kinetic temperature K. This value is reasonable near the edge of the cloud in the H zone where maximum temperature of the PDR occurs (Tielens & Hollenbach (1985)).
Accounting for the mass difference between H and He demonstrates that these line widths are not purely thermal, however. Assuming that they each consist of a macroscopic component that is independent of molecular weight in addition to the thermal component, we find . For Br, , and K. This temperature is hotter than typically observed in H II regions, but several factors tend to increase at the PDR-H II interface: increased photoelectric heating near a greater population of grains; the harder radiation field, which reduces the contribution of significant low-ionization coolants, such as O+; and increased density, which reduces the radiative cooling rate by increasing the collisional de-excitation rate (e.g., Spitzer (1978)).
The non-thermal recombination line widths may also be attributable to bulk motion of material flowing off the cloud surface. In the bright region discussed above, we view the PDR nearly edge-on, along a line of sight that includes both redshifted and blueshifted velocity components of the material that evaporates off the curved surface of the cloud. When the view of the PDR is closer to face-on, the intensity is less enhanced, and only the blueshifted velocity component arises. This is the case for the minor emission peaks at the bottom of the slit, which occur on the near surface of the cloud. These central velocities are slightly lower (by approximately 7) than those of the brightest peaks, and the observed widths are narrower. At slit position , for example, we find and in Br and He I, respectively. These both correspond to kinetic temperature K. If this is a more accurate measurement of the temperature at the edge of the H II region, then we have underestimated the contribution of the non-thermal velocity component above. While at the interface is likely higher than the typical temperatures in the diffuse central portions of H II regions, as argued above, it may be less than 14,000 K.
3.3. H2 Excitation
In a PDR, UV pumping is the primary source of H2 excitation. In M16, such fluorescent emission obviously occurs. A variety of lines that originate in high vibrational levels are observed, including 7-5O(4) and 3-2S(5) (Table 1), whereas thermal population of these high- levels would dissociate the molecules. We detect emission from all of the strong transitions in our bandpass that Black and van Dishoeck (1987) predict, except those originating in levels or lie in regions of poor atmospheric transparency.
Collisional excitation is also important, however. The ratio of line intensities (1-0S(1))/(2-1S(1))–5, and the average ratio over the slit is 4. As we found above in §3.1, this requires (Burton, Hollenbach, & Tielens (1990)), so collisions aid in populating the level. We do not, however, observe line ratios as high as Allen et al. (1999), who find (1-0S(1))/(2-1S(1)) in similar regions with Fabry-Perot imaging. We expect our results to be more accurate, having better flux calibration and simultaneous sky measurements.
Line ratios also directly measure excitation temperatures. Across the slit, we find from the 1-0S(1) and 2-1S(1) lines vibrational temperature –3800 K, with a median K. Using (1-0S(1))/(1-0S(3)), we find rotational temperature –2100 K and median K. Comparing (1-0S(1))/(1-0S(0)), –870 K, with a median K. The relatively low value of and relatively high value of (particularly in the brightest regions) distinguish the M16 PDR from purely fluorescent emission in a low density medium, where and from (1-0S(1))/(1-0S(3)) are typical.
We compare the line intensities of the three brightest regions with the models of Draine & Bertoldi (1996). Considering all observed lines, all three regions are best fit with , and K, where measures the incident UV flux ( is the Habing [1968] flux), and is the temperature at the edge of the PDR. The observed line ratios clearly rule out models of a weak field () and low density (). Both and are acceptable. For consistency with other density measurements and the UV field expected from members of NGC 6611, and is the preferred model. Although the grid of models is coarse, we identify trends by contrasting these regions. For example, the variation of density-sensitive line ratios along the spatial extent of the slit demonstrates that the cloud density is not constant. The decreased ratios (1-0S(1))/(1-0S(0)) and (1-0S(1))/(2-1S(1)) at slit position relative to slit position show that the former region has lower density.
In thermal equilibrium, the ratio of ortho-hydrogen (having odd rotational level, ) to para-H2 (having even ) is 3, and only collisions can change the ortho:para ratio. This abundance ratio is therefore a significant parameter in PDRs and affects the emission line ratios. We calculate the ratio of ortho-H2 and para-H2 from the 1-0S(1) and 1-0S(0) lines, finding ratios of 1.3–2.2, with an median value of 1.7. Because UV pumping of the damping wings of optically thick lines populate the excited levels, the expected ratio of column densities in the vibrationally excited levels is 1.7, while the true ortho:para abundance is 3 (Sternberg & Neufeld (1999)).
The photoelectric effect on interstellar grains is likely to be the primary heating source in PDRs, but its exact process is uncertain. We determine the efficiency of converting FUV flux to photoelectric heating, , assuming thermal equilibrium. Emission in the [O I] 63 m and [C II] 158 m fine structure lines cools the gas. For the measured temperature and density, we calculate a net cooling rate in M16, with 96% due to [O I]. In the parameterization of Bakes & Tielens (1994), the heating function . Thus, we find , for (Allen et al. (1999)). The theoretical prediction, (Bakes & Tielens (1994)), is a function of , where is the electron density. We have assumed that the ionization of carbon provides the electrons; increasing would increase , without significantly altering the cooling rate. Alternatively, decreasing the gas to dust ratio would allow a lower efficiency in equilibrium with the cooling rate we predict.
4. Conclusions
Spectroscopy of M16 with NIRSPEC offers the advantage of simultaneous observation of both the molecular and ionized phases of its photodissociation regions. At high resolution, we detect the spatial and kinematic signatures of photoexcitation of molecular material. Most of the emission is due to distinct regions of photodissociation on the molecular cloud’s surface that we observe edge-on. The spectrum includes several lines that originate in high vibrational levels, which demonstrates that fluorescent excitation predominates. The density and varies among the emitting regions, so collisions also preferentially populate low-lying vibrational levels. We measure kinetic temperature K in the molecular gas, which requires efficient photoelectric heating near the cloud’s surface. In the spatially-segregated ionized region, K, and the velocity widths of the brightest regions include a macroscopic contribution.
References
- Abrams et al. (1994) Abrams, M. C., Davis, S. P., Rao, M. L. P., Engleman, R., Jr., & Brault, J. W. 1994, ApJS, 93, 351
- Allen et al. (1999) Allen, L. E., Burton, M. G., Ryder, S. D., Ashley, M. C. B., & Storey, J. W. V. 1999, MNRAS, 304, 98
- Bakes & Tielens (1994) Bakes, E. L. O., & Tielens, A. G. G. M. 1994, ApJ, 427, 822
- Bertoldi (1989) Bertoldi, F. 1989, ApJ, 346, 735
- Bertoldi & Draine (1996) Bertoldi, F., & Draine, B. T. 1996, ApJ, 458, 222
- Black & van Dishoeck (1987) Black, J. H., & van Dishoeck, E. F. 1987, ApJ, 322, 412
- Burton, Hollenbach, & Tielens (1990) Burton, M. G., Hollenbach, D. J., & Tielens, A. G. G. M. 1990, ApJ, 365, 620
- Draine & Bertoldi (1996) Draine, B. T., & Bertoldi, F. 1996, ApJ, 468, 269
- Habing (1968) Habing, H. J. 1968, Bull. Astron. Inst. Netherlands, 19, 421
- Hester et al. (1996) Hester, J. J., et al. 1996, AJ, 111, 2349
- Hillenbrand et al. (1993) Hillenbrand, L. A., Massey, P. Strom, S. E., & Merrill, K. M. 1993, AJ, 106, 1906
- (12) Hollenbach, D. J., & Tielens, A. G. G. M. 1997, ARA&A, 35, 179
- (13) Hollenbach, D. J., & Tielens, A. G. G. M. 1999, Rev. Mod. Phys. 71, 173
- Humphreys (1978) Humphreys, R. M. 1978, ApJS, 38, 309
- McKee (1989) McKee, C. F. 1989, ApJ, 345, 782
- McLean et al. (1998) McLean, I. S., et al. 1998, Proc. SPIE, 3354, 566
- Pound (1998) Pound, M. W. 1998, ApJ, 493, L113
- Spitzer (1978) Spitzer, L., Jr., 1978, Physical Processes in the Interstellar Medium, (New York: Wiley)
- Sternberg & Dalgarno (1989) Sternberg, A., & Dalgarno, A. 1989, ApJ, 338, 197
- Sternberg & Neufeld (1999) Sternberg, A., & Neufeld, D. A. 1999, ApJ, 516, 371
- Tielens & Hollenbach (1985) Tielens, A. G. G. M., & Hollenbach, D. 1985, ApJ, 291, 722 (TH)
- White et al. (1999) White, G. J., et al. 1999, A&A, 342, 233
| Transition | Wavelength | Total Flux | Peak Surface Brightness |
|---|---|---|---|
| [m] | [] | [] | |
| H2 | |||
| 7-5O(4) | 1.94343 | ||
| 2-1S(5) | 1.94486 | ||
| 1-0S(3)aaCorrection for atmospheric transparency is large, around 2 | 1.95756 | ||
| 3-2S(5) | 2.06556 | ||
| 8-6O(4) | 2.12155 | ||
| 1-0S(1) | 2.12183 | ||
| 3-2S(4) | 2.12799 | ||
| 1-0S(0) | 2.22329 | ||
| 2-1S(1) | 2.24772 | ||
| Recombination Lines | |||
| Br | 2.16609 | ||
| Bra,ba,bfootnotemark: | 1.94509 | ||
| He I | 2.05869 | ||
| He I | 2.11259 | ||