A New Complete Sample of Sub-millijansky Radio Sources: An Optical and Near-Infrared Study
Abstract
The Very Large Array (VLA) has been used in C-configuration to map an area at 1.4 GHz with sensitivities of 0.305, 0.325, 0.380 and 0.450 mJy beam-1 over four equal subareas. Radio properties are presented for 62 detected sources. Deep optical imaging to Gunn mag using the Hale 5-m telescope covering is reported for a subset of 43 sources. This optical follow-up is much deeper than that of existing larger area radio surveys of similar radio sensitivity. Archival , and -band photometry from the Two-Micron All Sky Survey (2MASS) is also presented. Using a robust likelihood-ratio technique, we optically identified 26 radio sources with probabilities , nine are uncertain/ambiguous detections, and eight are empty fields. Comparisons with a stellar synthesis model that includes radio emission and dust reddening suggests that the near-infrared–to–optical emission in a small, bright sub-sample is reddened by ‘optically thin’ dust with absorption mag, regardless of morphological type. This is consistent with other, more direct determinations of absorption. The radio–to–optical(–near-infrared) flux ratios of early-type galaxies require significant contamination in the radio by an active galactic nucleus (AGN), consistent with the current paradigm. Using our simple modeling approach, we also discuss a potential diagnostic for selecting Ultraluminous Infrared Galaxies (ULIGS) to from microJansky radio surveys.
1 INTRODUCTION
The advent of deep radio surveys reaching flux densities well below 1 mJy (Mitchell & Condon 1985; Windhorst et al. 1985; Oort 1987; Windhorst et al. 1993; Hopkins et al. 1998; Richards 2000) revealed a new population of faint sources more numerous than the AGN-powered radio galaxies dominating the strong-source population. This corresponds to a steepening of the differential source counts over non-evolving predictions at levels mJy. The faint counts suggest that significant evolution has occured over the redshift range spanned by the observed population. Photometric and spectroscopic studies (Thuan et al. 1984; Windhorst et al. 1985; Thuan & Condon 1987; Benn et al. 1993) suggest that the faint excess at 1.4 GHz is composed predominately of star-forming galaxies similar to the nearby starburst population dominating the Infrared Astronomical Satellite (IRAS) 60-m counts (Benn et al. 1993). Indeed, this is supported by the strong correlation between radio (1.4 GHz) and far-infrared (60-m) flux densities of disk galaxies (Helou, Soifer & Rowan-Robinson 1985), implying a significant proportion of starburst galaxies at faint radio flux densities.
The overall observed source-count distribution from faint (Jy) to bright (mJy) flux densities cannot be explained by starbursts alone. Evolutionary models of radio source counts need to invoke two separate populations (eg. Danese et al. 1987; Rowan-Robinson et al. 1993; Hopkins et al. 1998). Condon (1989) describes these populations as starbursts and monsters, each powered by different mechanisms: ‘starbursts’ deriving their radio emission from supernova remnants and HII regions and ‘monsters’ from compact nuclear related activity (eg. active galactic nuclei; AGNs). The proportion of AGN is much greater at higher flux densities mJy (Kron, Koo & Windhorst 1985; Gruppioni et al. 1998), where a majority are associated with classical radio galaxies exhibiting extended (FRI and FRII-type) morphologies (Fanaroff & Riley 1974). The optical counterparts to sources at bright radio flux densities mJy is comprised mostly of ellipticals while at sub-mJy to Jy levels, the optical counterparts are identified as blue galaxies exhibiting peculiar (compact, interacting and irregular) morphologies (Kron, Koo & Windhorst 1985; Gruppioni et al. 1998). Studies of faint radio sources, namely their stellar population, how they evolve with redshift, and how they relate to local normal galaxies is progressing rapidly, however, much remains to be learned from the faintest (Jy) radio populations at redshifts .
Radio surveys are insensitive to the effects of absorption by dust which is known to bias surveys severely at optical/UV wavelengths. This is particularly important for derivations of the cosmic history of star formation and its relation to hierarchical models of galaxy formation. Optical/UV studies have shown that there is an increase in both the space density of star-forming, morphologically disturbed galaxies (eg. Richards et al. 1999) and also, the global star formation rate with redshift to (eg. Madau et al. 1996). Similar evidence is emerging from studies of sub-mm sources (Blain et al. 1999) and amongst the faint radio population at - the redshift range probed by the deepest surveys (eg. Cram 1998; Haarsma et al. 1999).
There has been much speculation as to whether global star-formation rates (SFRs) derived from radio observations exceed those determined from optical/UV studies. Cram et al. (1998) note that systematic discrepancies may exist between the various star formation indicators, which are not well understood (see also Schaerer 1999). It is encouraging to see however that Haarsma et al. (2000) find global SFRs derived from 1.4GHz observations of the Hubble Deep Field to exceed optically detetermined values by a factor of a few out to . Indeed, an analysis of Balmer decrements and optical–near-infrared colors in star forming galaxies by Georgakakis et al. (1999) from the Phoenix Deep Survey (Hopkins et al. 1998), finds evidence for visual extinctions from one to a few magnitudes. Currently, about 20% of existing micro-jansky radio samples remain unidentified to mag in Hubble Deep Field images (eg. Richards et al. 1999). A majority of these could represent a significant population of dust-enshrouded starbursts and/or AGN at high redshift. These results are in support of efforts to further understand the dust properties of star-forming galaxies.
The primary aim of this paper is to introduce a new complete sample of radio sources selected at 1.4 GHz, uniformly selected over the flux range mJy (5) from an area covering . Although much larger area surveys to deeper radio sensitivities have been carried out (eg. Hopkins et al. 1998), the present study reports the results of more sensitive optical observations. Archival near-infrared data for a subset of the sample are also presented. The near-infrared data is from the ongoing 2MASS project, and represents a unique aspect of this study in the identification of radio-selected starbursts. Although we currently lack valuable spectroscopic information, we combine radio–near-infrared–optical flux ratios, radio maps, and optical images to explore the properties of the entire sample. Our deep optical identifications provide the opportunity to asses the importance of dust in star-forming systems via the observed radio–to–optical and near-infrared–to–optical colors. Simple stellar synthesis models that include radio emission and reddening are used to constrain possible amounts of absorption.
This paper is organised as follows. In §2, we discuss the radio observations and data reduction, present the radio catalog, and compare our results with data available from (shallower) all sky radio surveys. The optical photometric observations, their reduction and astrometric calibrations are discussed in §3. Our method for radio-optical identification, the archival near-infrared data, radio-optical image overlays, and our optical/near-infrared catalog are presented in §4. A study of the radio, near-infrared, and optical colors and constraints on synthesis models incorporating dust is presented in §5. An application of our color-color analysis to select high-redshift ultraluminous infrared galaxies from deep radio surveys is discussed in §6. All results and future prospects are summarised in §7.
2 RADIO OBSERVATIONS
2.1 Strategy
Observations were made with the VLA C-configuration at 1.4 GHz on 1998 December 19. This configuration yields a good compromise for resolution and surface-brigntness sensitivity. The confusion limit for this configuration is only Jy/beam at 1.4 GHz (Mitchell & Condon 1985) since the synthesised beam size (Full Width at Half Power; FWHP) is arcsec. The resulting radio positions have rms errors arcsec, except for extended sources with multiple components, sufficient for making optical identifications. At 1.4 GHz the FWHP of the VLA primary beam is 31 arcmin and approximately corresponds to the diameter of our final imaged field. This relatively large coverage avoids field-to-field variations in source counts induced by high-redshift clustering. Although surveys at higher frequencies (eg. 8 GHz) can reach lower flux densities than at 1.4 GHz, most radio sources have spectral indices () so that the population being sampled is similar.
To provide uniform sensitivity over the full area of our field, we observed seven positions arranged in a filled hexagonal pattern with a separation of between pointing centers. The resulting root mean square (rms) map noise is thus nearly constant (cf. Condon et al. 1998). Our field was centered on RA(2000)=, Dec.(2000)=. This field was chosen for its relatively low foreground galactic-cirrus emission likely to affect optical/near-infrared identifications and also for the absence of bright radio galaxies. The integration time on each pointing was hour. This allowed us to reach an rms noise of Jy in regions free from bright contaminating sources (see § 2.3 for more details).
Our observations were made in spectral line mode with four Intermediate Frequencies (IFs), each divided into 7 spectral channels of width 3.125 MHz. The advantage of this mode is to minimize bandwidth smearing (i.e. chromatic aberration) which reduces the point-source sensitivity away from the pointing center and causes appreciable image distortion. Additionally, the spectral line mode is less prone to narrowband interference noise spikes. With continuum mode however, we would have had a little over twice the bandwidth and a factor lower noise.
2.2 Data Reduction
The data were analysed with the NRAO AIPS reduction package. We observed 3C 48 to calibrate the visibility amplitudes, using and Jy at 1.365 and 1.435 GHz, respectively. The calibration was applied using the SPLIT task. The calibrated data from each pointing were edited and imaged separately, CLEANed, and restored with 15 arcsec FWHP Gaussian beams. The seven separate images were weighted and combined as described in Condon et al. (1998) to produce a final map with nearly uniform sensitivity and corrected for primary-beam attenuation.
2.3 Noise and Source Extractions
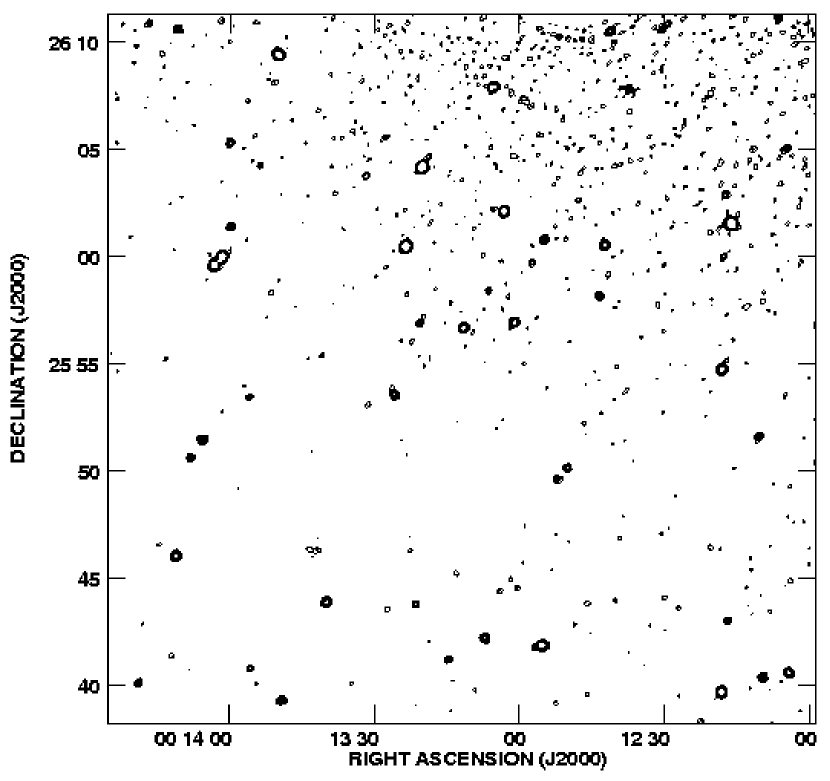
The resulting rms noise of our final map after correcting for primary-beam attenuation is not uniform over the entire field, but increases by up to 30% near a strong ( mJy) source near the edge of our field. Despite this variation in sensitivity, we were able to divide our field into four equal () regions within which the rms noise varies by no more than a few percent. These constant-noise regions simplify the application of an automated source-finding algorithm over a single continuous region (see below). The lowest and highest rms noise amongst these regions was Jy/beam and Jy/beam respectively. See Table 1 for the region definitions. The rms noise of each region was estimated from the Gaussian core of the amplitude distribution of the pixel values as produced by the AIPS task IMEAN. In Figure 1, we show the distribution in pixel values of our entire field. The rms deviation in peak flux density derived from a fit to this histogram is Jy/beam. Figure 2 shows a contour map of our entire radio field.

Each constant-noise region in Table 1 was used for the source extractions. Within each region, we searched for radio sources down to a peak flux density times the rms value of the region. The sources were extracted by the AIPS task SAD which uses Gaussian fits to estimate the fluxes, positions, and angular sizes of the selected sources. For faint sources however, unconstrained Gaussian fits may be unreliable (see Condon 1997). For this reason, we adopted the following method for the source extraction: first, we ran the task SAD with a detection threshold to obtain an initial list of candidates, we then derived the peak flux densities of the faint sources (with ) using the MAXFIT task. This task uses a second order interpolation algorithm and is known to be more accurate. Only sources with a MAXFIT peak flux density were retained. For these faint sources, the total flux density was estimated using the task IMEAN, which integrates the (median background subtracted) pixel values in a specific rectangle. The rectangle was chosen to encompass as much of the source as possible. For all other parameters (sizes, positions and position angles) we retained the values obtained from the initial Gaussian fits. Only two sources had irregular morphologies showing multiple components. For these, the total (background subtracted) flux was determined using the task TVSTAT which allows an integration over a specific irregular area defined to encompass as much of the source as possible.
The numbers of sources detected in each constant-noise region are summarised in Table 1. A total of 62 sources were detected with flux densities over an area of . Within poisson uncertainties, this number is consistent with source counts from surveys by Ciliegi et al. (1999) and Hopkins et al. (1998). To our limiting (mean) sensitivity of 0.35mJy and within , they report a source count of typically . This confirms the reliability of our radio source detections and flux density estimates.
Table 2 shows the full radio catalog which reports (in column order): the source name; RA and Dec.(J2000); errors in RA and Dec.; the peak flux density ; error in ; the total flux density ; error in ; the full width half maximum (FWHM) of the major and minor axes and (determined from Gaussian fits); the position angle of the major axis (in degrees); and the rms errors associated with , , and respectively. The different components of multiple sources are labelled “C1” and “C2”. In Figure 3, we show the distribution of peak flux densities and the total to peak flux ratio as a function of peak flux for all sources. Sources with ratios in Figure 3b are primarily due to uncertainties on measured fluxes as estimated from the two dimensional Gaussian fits. Uncertainties in peak fluxes are typically , while total flux estimates are more uncertain due to a sensitive dependence on the Gaussian fitting procedure. Errors in total fluxes are typically . Contour maps of radio sources with available optical data are shown in Figure 8.

2.4 Comparison with the NVSS Catalog
The region that we observed with the VLA was also covered by the NRAO VLA Sky Survey (Condon et al. 1998, NVSS). The NVSS covers the sky north of at 1.4 GHz with resolution and limiting flux density of mJy (). To this limit, 17 of our sources were found to be in common with the NVSS public catalog. One source in our catalog however is a double component source and is unresolved by the NVSS. A comparison of flux densities derived in this study with those from this catalog is shown in Figure 4. It is evident that our derived flux densities are on average slightly lower than those from the NVSS. This was also reported in a larger comparison study by Ciliegi et al. (1999) using a similar observational set-up and can be explained by the difference in resolutions used in the two surveys: vs. . High-resolution surveys tend to miss flux from low-surface-brightness emission. Although the effect is only marginal for bright sources, it may become important for attempts to detect faint, low-surface-brightness objects at high redshift.

3 OPTICAL PHOTOMETRIC OBSERVATIONS
3.1 Observations and Data Reduction
Optical CCD photometry of our radio field was carried out on the 5-m Hale telescope at Palomar111Operated by California Institute of Technology, Pasadena, CA 91125 Observatory during the nights of 27-29 August 1997. These fields were initially selected for subsequent deep mid-IR imaging with the Wide Field Infrared Explorer mission (WIRE), but the mission failed to perform to expectations. The Carnegie Observatories Spectroscopic Multislit and Imaging Camera (COSMIC; Kells et al. 1998) mounted at the prime focus with a TEK 2K CCD was used to image nine fields in the Gunn (6550Å) filter. Each optical field comprised of three optical pointings offset by , each with integrations of 600 sec giving a total 1800 sec per field. This resulted in a limiting magnitude of mag (). The seeing was typically (FWHM). The optical fields do not cover our entire radio field. The nine slightly overlapping optical fields correspond to an areal coverage , or about 70% of the radio map.
The CCD data were reduced with standard tasks in the IRAF package. Frames were first bias-subtracted, then flat-fielded using dome flats. Bad pixels and columns were removed by interpolating between adjacent pixels and lastly, the individual dithered frames were median combined to remove cosmic ray hits. Calibration was performed using standard stars from Thuan & Gunn (1976). These were used to correct for atmospheric extinction from varying airmass and provide the instrumental zero point. Photometric uncertainties, estimated using these standards, are no more than mag.
Sources in the reduced optical frames were extracted using the DAOPHOT package in IRAF (Stetson 1987). This package has the benefit of performing photometry in crowded fields, which is the case in most regions of our optical fields. It performed the following steps: first, sources were extracted above a given threshold, given as a multiple of the total CCD noise (sky and read noise, ). We adopted threshold values of 4.5-5, just high enough to avoid large numbers of spurious detections. Second, simple aperture photometry was performed on these identified sources. This required a specification of the aperture radius which is likely to contain most of the light of our target source, and width of a surrounding annulus to estimate and subtract the sky background. We adopted a radius of six arcsec and annulus width of four arcsec. Next, a point spread function (PSF) was determined in each of our nine fields. This involved an interative technique to remove contamination from neighbouring sources in crowded fields near our PSF candidates. Simultaneous PSF fitting on all sources was then performed to identify sources which were previously hidden in crowded regions. Finally, the magnitudes determined from PSF fits were aperture corrected to a common aperture size as used on our standard stars. Aperture corrections were typically 0.22 mag. A final visual inspection removed any spurious detections. A total of -390 sources were extracted from each field to a limit of mag. Previous optical surveys find typically 380-520 sources within this area to this limit, and the variation is primarily due to clustering. Such fluctuations are found to be significant on such relatively small scales (eg. Metcalfe et al. 1991).
3.2 Astrometry
The astrometry on the optical images was based on 10-12 APM catlog stars in each field (Maddox et al. 1990). The ccmap and cctran tasks in the IRAF immcoords package were used to compute plate solutions relating pixel positions to astrometric coordinates. Astrometric coordinates for all sources on the frames were then determined. By comparing the positions of several sources common to the APM catalog and our fields, we found that our rms position uncertanties are typically .
4 OPTICAL/NEAR-INFRARED IDENTIFICATION OF RADIO SOURCES
4.1 Method for Optical Identification
We assigned optical identifications and estimate their reliability using a robust likelihood ratio () analysis. This general method has frequently been used to assess identification probabilities for radio and infrared sources (eg. de Ruiter, Willis & Arp 1977; Prestage & Peacock 1983; Sutherland & Saunders 1992; Lonsdale et al. 1998). The method, which computes the probability that a suggested identification is the ‘true’ optical counterpart, is outlined as follows:
For each optical candidate in the search area of some radio source , we calculated the value of the dimensionless difference in radio and optical positions:
| (1) |
where the ’s and ’s represent right ascensions and declinations respectively, and ’s standard deviations. We chose a moderately large search radius of to allow for the maximal position uncertainties: and (assuming , where ). Such a radius is also small enough to avoid large numbers of chance associations.
Given , we must now distinguish between two mutually exclusive possibilities: (1) the candidate is a confusing background object that happens to lie at distance from the radio source or (2) the candidate is the ‘true’ identification that appears at distance owing solely to radio and optical position uncertainties. We assume that the radio and optical positions would coincide if these uncertainties were zero. This assumption however is not valid when the centroid of an extended radio source is used, and is further discussed below.
To distinguish between these cases, we compute the likelihood ratio , defined as:
| (2) |
where is the local surface density of objects brighter than candidate . The likelihood ratio is simply the ratio of the probability of an identification (the Rayleigh distribution: ), to that of a chance association at (). therefore represents a ‘relative weight’ for each match , and our aim is to find an optimum cutoff above which a source is taken to be a reliable and likely candidate. Its advantage over alternative methods (purely based on finding the lowest random chance match, eg. Downes et al. 1986) is that it allows for a possible distant candidate to still be the ‘true’ identification even when there is still a high chance of it being a spurious background source.
It is important to note that our form for (eq. 2) slightly differs from that used by earlier studies (eg. Lonsdale et al. 1998) in that it doesn’t contain the multiplicative “” factor in the numerator. This factor represents the apriori probability that a “true” optical counterpart brighter than the flux limit exists amongst the identifications. For our purposes, we will treat as simply a a relative weight measure for each radio-optical match, just for the purposes of assigning an optimal cutoff for reliable identification (see below). We are not concerned with its absolute value, which is required when computing formal probability measures from . For simplicity, we have therefore set in this work.
The optical surface density as a function of magnitude to be used in computing was determined from the total number of objects visible in our optical frames. The variation in surface density in the vicinity of each radio source caused by possible clustering effects was found to be small: no more than 5% on scales.
The distribution of values for all possible radio source-candidate matches is shown by the shaded histogram in Figure 5. Following Lonsdale et al. (1998), we generate a truly random background population with respect to the radio sources by offseting the radio source positions by . values for each radio source were then re-computed and their distribution is given by the thick-lined histogram in Figure 5. A comparison of the number of associations for (true) radio source positions with the number of associations found for random (offset) positions will enable us to determine a critical value for reliable identification. From these distributions, we compute the reliability as a function of :
| (3) |
where and are the number of true and random associations respectively. The reliability computed in this way also represents an approximate measure of the identification probability for a candidate with given .
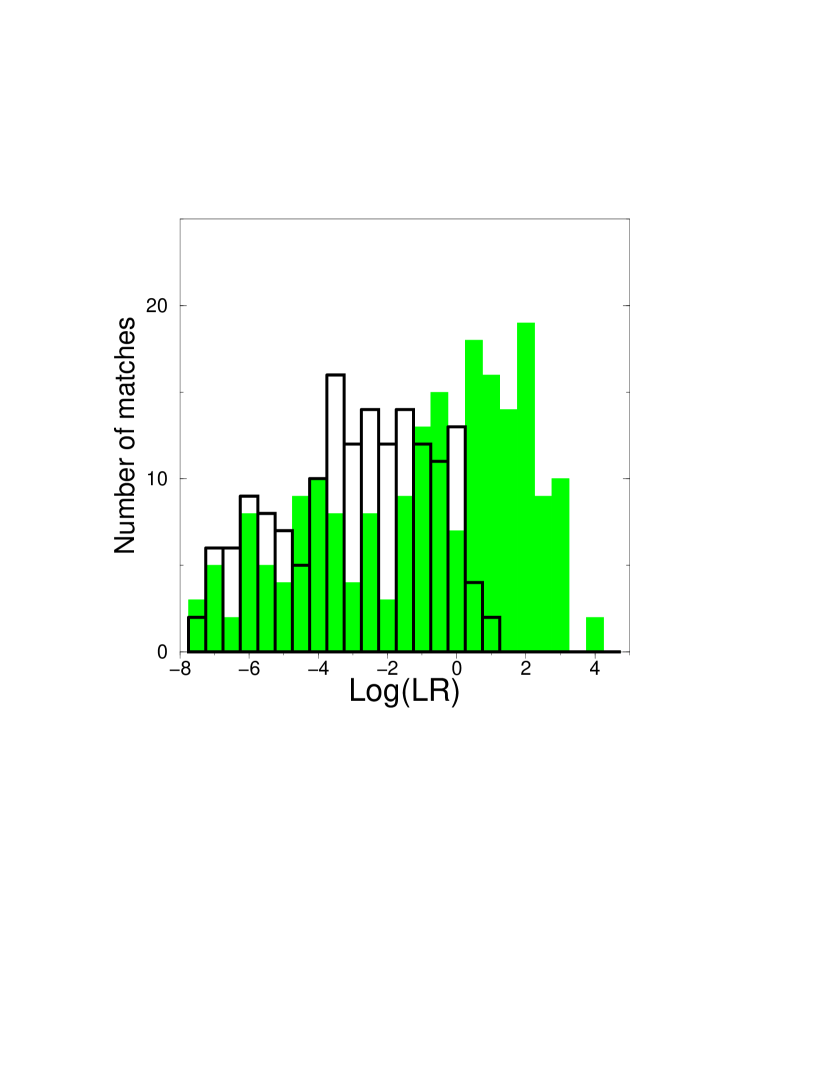

Figure 6 illustrates the reliability as a function of . Above , the reliabilities are because few random associations exceed this value of (Fig. 5). As a good working measure we therefore assume a cutoff above which a source is taken to be a likely candidate. The determination of reliabilities via the method is insensitive to variations in across the field or uncertainties in its derivation, and also the assumption of Gaussian error ellipses in the radio and optical positions. Such uncertainties are “normalised out” when one computes the ratio of random to true number of associations within a search radius when estimating the reliability (eq. 3). Lonsdale et al. (1998) have shown that the absolute value of itself depends on the characteristics of the source population being identified (eg. stars versus galaxies). Different populations (assuming they could be classified a-priori using some diagnostic) map into different underlying surface densities at the ‘identifying’ wavelength, implying that distributions in (eq. 2) will also be different. For a robust determination of the reliability in such situations, see Lonsdale et al. (1998).
There are two complications to consider in the above method. The first is when one attempts to identify extended (or resolved) radio sources with this method. For all radio sources, we have used the positions of centroids derived from two-dimensional Gaussian fits in computing the for optical candidates. For unresolved sources with (Gaussian fitted) sizes (the synthesised FWHP beam width), the source is likely to have a compact central component and the optical position is expected to lie close to its quoted radio centroid. For an extended (resolved) source however, the radio and optical positions may differ considerably since errors in the radio centroids are only . In such cases, if the identification may still be valid, since its low value could purely be due to a real large positional offset. The second complication is when a radio source has more than one optical candidate within its search radius with . This occured in about 20% of cases and was primarily due to contaminating stars. We assess these ambiguities and increase the robustness of our identifications by visually examining all optical candidates according to the following criteria:
-
1.
If candidates have for a radio source with , then identification is classified as uncertain.
-
2.
If candidates have very low reliability, (for unresolved radio sources), or there are no objects in the search radius, then radio source is classified as empty field.
-
3.
If , i.e. where reliability is moderately “low”, then identification is also uncertain.
-
4.
If more than one optical candidate exists with , then only source(s) with extended (galaxy-like) optical profile is taken as the identification. Point sources associated with quasar nuclei are not considered in our identification scheme due to their relatively low surface density compared to galaxies () in sub-millijansky radio samples.
-
5.
For unique, candidates, its optical profile is also checked for confirmation.
4.2 Results
Of the 62 radio sources, 43 lie within our optically imaged field. We found optical identifications for 26 to mag with reliabilities . Four sources have identifications classified as uncertain owing to a moderately low identification reliability of (and ). Five more are uncertain because they have extended radio structure and large possible positional offsets between optical and radio centroid positions. Eight radio sources lie in “definite” optical empty fields with no candidates brighter than mag.
Other optical follow-up studies found similar results. Georgakakis et al. (1999) identified of sources to mag from the Phoenix Deep Survey ( mJy) (Hopkins et al. 1998). Deeper indentifications of sources as faint as Jy from Hubble Deep Field images revealed a 80% success rate to mag (Richards et al. 1999). Ignoring the uncertain identifications in our study (from criteria 1 and 3 above and which are excluded from our analysis), we find that 18% of our sources are unidentified to . Accounting for differences in bandpasses and sensitivity, this is broadly consistent with the above studies. Figure 7 shows the distribution of apparent magnitude for all reliable (robust) and uncertain identifications in our sample.

4.3 Near-Infrared Data
Near-infrared data in the (1.25m), (1.65m) and (2.17m) photometric bandpasses were obtained from the Two Micron All Sky Survey (2MASS) project database. For multi-band detection of point sources, this survey is currently scanning the sky to sensitivities 16.5, 16.0 and 15.5 mag at signal-to-noise ratios , and respectively in , and . The data relevant to this study are not yet released in the public catalogs, and was retrieved from the ‘internal working database’ at IPAC222The Infrared Processing and Analysis Center, California Institute of Technology.. Photometry in this database was determined using custom PSF-fitting software and algorithms are described in Cutri et al. (2000). Since such data have not been subjected to the rigorous quality assurance as that in the public release catalogs, we have examined individual images for quality and any possible systematic uncertainties in the photometry.
To maximise the possible number of detections, we searched for near-infrared counterparts to each radio source with a conservatively low signal-to-noise ratio threshold of in each band. In cases where a source was detected in only one or two of the three bandpasses: , and , we note its “band-filled” 95% confidence upper-limit in the undetected band. In other words, the 2MASS catalog also reports upper limits to measurements in an undetected band by placing an aperture over the position inferred from detections in other bands. The image pixel scale of the 2MASS detectors is and the positional uncertainties are . Owing to the relatively shallow flux limits of the 2MASS survey, the background source surface density is low enough that chance associations with radio positions are very unlikely.
We searched the 2MASS database for near-infrared counterparts to our 43 radio sources that have available optical information from our deep optical survey and examined their images for quality. We found 7 reliable matches with 6 detections in , 7 in , and 4 in at the level. Upper limits were available for the remainding “band-filled” values.
Results of our optical identification analysis and available near-infrared data are shown in Table 3. In column order, this table reports: the radio source name (see Table 2); RA and Dec.(J2000) of the optical counterpart of the radio source; optical-radio position separation () in arcsec; logarithm of the liklihood ratio (); reliability of the optical identification (see eq.[3]); apparent -band magnitude; , and magnitudes with errors or upper limits; color; color, and last, the optical morphology if the optical counterpart is visually resolved with size .
Optical morphologies were determined from light profile fitting of individual sources and comparison with -law (elliptical-like) and exponential (disk-like) profiles. In cases where a disturbed or interacting morphology is apparent, then it is designated to have an irregular (labelled as ‘Irr’) morphology. Sources unresolved in the optical with typically are designated as ‘unknown’ and labelled as ‘?’ in Table 2.
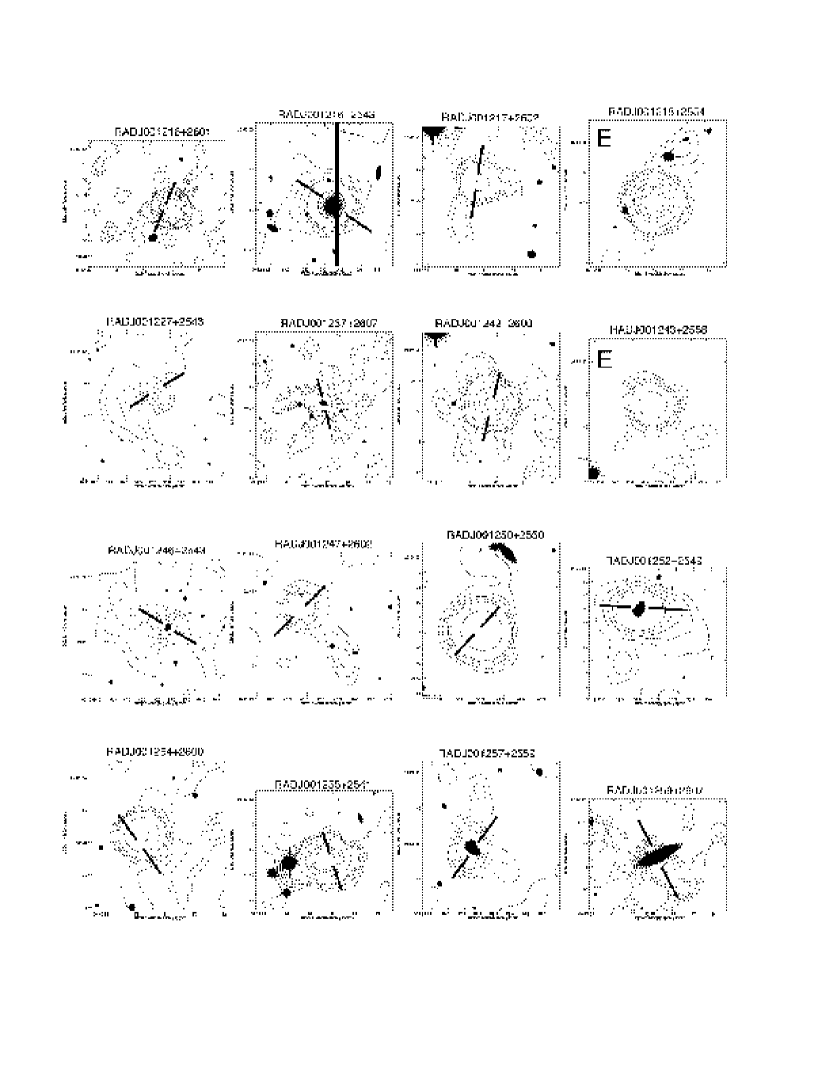
![[Uncaptioned image]](/html/astro-ph/0002490/assets/x9.png)
Fig. 8.— contd…
![[Uncaptioned image]](/html/astro-ph/0002490/assets/x10.png)
Fig. 8.— contd…
4.4 Optical and Radio Map Overlays
In Figure 8 we show the optical image – radio map overlays for the 43 radio sources with available optical information. A visual inspection of the optical images of resolved counterparts shows a diverse morphological mix, consistent with previous studies. About 40% of our optical identifications have elliptical/disk-like morphology, while can be identified as exhibiting peculiar (either interacting or disturbed) morphologies. It is important to note that these ‘disturbed’ sources are based on visual inspection alone and their morphology could still be uncertain until future spectroscopy confirms their nature. The elliptical/disk hosts also tend to be associated on average with sources of relatively brighter radio flux density ( mJy) than the irregular class. This is consistent with previous radio-optical identification studies which find an increasing fraction of irregular-type galaxies at mJy (eg. Kron, Koo, & Windhorst 1985, Hammer et al. 1995, Gruppioni et al. 1998) and a significant number of elliptical galaxies hosting the brighter extended radio galaxies and AGN (Condon 1989).
A further observation is the unique radio structure exhibited by our eight optical empty field sources with mag. These are represented by maps in Fig. 8 labelled by the letter “E”. All show compact and symmetric (presumably unresolved) structures and could represent either of the following: distant (possibly dusty) AGN where with our radio sensitivity, we could have detected a nominal FR-I galaxy to , or, nearby, compact dusty starbursts at as constrained by typical starburst luminosities: . The second explanation for the nature of the empty fields is more plausible, given that the majority of submillijansky radio sources are associated with star-forming galaxies and less than 5% are usually identified with bright FR-Is at (Kron, Koo & Windhorst 1985).
5 ANALYSIS OF RADIO AND OPTICAL–NEAR-INFRARED COLORS
This section presents an analysis of flux ratios between the radio, near-infrared, and optical bands to explore possible contributions from AGN and starbursts to the observed radio emission as well as the importance of absorption by dust. Because we lack spectroscopic information, our analysis treats the sub-mJy sources as one homogeneous population and uses a simple stellar synthesis model to interpret its properties quantitatively.
5.1 A Simple Synthesis Model
We can predict the radio–to–optical(–near-IR) flux ratios and colors for a range of galaxy types using the stellar population synthesis code of Bruzual & Charlot (1993) (hereafter BC). On its own however, the BC model does not directly predict the amount of radio emission expected from a star-forming galaxy, which we need for the determination of flux ratios involving the radio band. We do this by relating the star-formation rates derived from empirical calibrations involving the UV and radio bands as follows.
The 1.4 GHz radio emission from star-forming systems is believed to be primarily synchrotron emission from cosmic rays accelerated in supernova remnants plus a small () thermal contribution from HII regions (Condon & Yin 1990, Condon 1992). Thus to a good approximation, the radio luminosity is taken to be proportional to the formation rate of stars with :
| (4) |
(Condon 1992). These same massive stars will also contribute significantly to the UV continuum emission in the range -Å. In particular, there have been many different calibrations of the SFR from the UV-flux. For a Salpeter initial mass function (IMF) from to 100, the calibration of Madau et al. (1998) (which assumes no dust correction) yields
| (5) |
We have modified the initial relation of Madau et al. (1998) to include the factor , which represents the fraction of stellar masses contributing to the observed SFR,
| (6) |
where is the IMF. For , we have . Assuming a Salpeter IMF (), we find that for stars with , . With this fraction, and equating the two SFR calibrations (eqs [4] and [5]), we find that the luminosity densities at 1.4 GHz () and Å () are very nearly equal. We therefore assume that the rest frame 1.4 GHz flux density is directly given by the flux density at Å as specified by the synthesized model spectrum. In general terms, the observed radio flux (in the same units as the synthesised UV spectrum) can be written:
| (7) |
where is the radio spectral index (Condon 1992) and is the rest frame (unreddened) UV spectral flux. We must emphasise that this relative radio flux is only that associated with the star-formation process. Possible additional contributions, such as contaminating AGN, are not considered in this model.
We calculated flux ratios involving the radio, near-infrared and optical bands using evolutionary synthesis models for ellipticals (E/SO), early (Sab/Sbc) and late (Scd/Sdm) type spirals, and “very blue” starbursts (SB). These are meant to represent the possible contributions to the sub-mJy radio sources, and each class is defined by a characteristic star formation rate as a function of time. As supported by local observations (eg. Gavazzi & Scodeggio 1996), we assumed that E/SO and Sab/Sbc galaxies have an exponentially decaying SFR of the form , where is the e-folding time. Values of and Gyr were adopted for the E/SO and Sab/Sbc galaxies respectively. For late-type spirals (Scd/Sdm) and young starbursts (SB), we assumed constant SFRs with different ages. All models used to generate the spectral energy distributions (SEDs) are summarised in Table 4. The models assume , and a galaxy formation redshift , which corresponds to an age of 12.7 Gyr at .
To explore the effects of dust on our flux ratios and colors, each model SED was reddened in the source rest frame with an extinction curve characteristic of the Small Magellanic Cloud (SMC), which appears to be a good approximation for the ISM of nearby galaxies (Calzetti et al. 1994). This approximation is most accurate for the reddest wavelengths of starburst galaxy spectra (Å-m), although breaks down severely at Å(Calzetti et al. 1999). We have used the analytical fit for as derived by Pei (1992) for the SMC. For simplicity, we assumed that the dust is distributed in a homogeneous foreground screen at the source redshift.
5.2 Data and Model Comparions
In Figure 9 we plot the radio–to–optical flux ratio, , defined as
| (8) |
where and are the radio flux and optical -band magnitude respectively. The distribution seen in observed values of is larger at the faintest optical magnitudes . There are few galaxies however with , and nonetheless, the scatter at is consistent with that found at in a larger follow-up study of sub-mJy radio sources by Georgakakis et al. (1999).

Figure 10 shows as a function of color for all sources with available optical and near-infrared data. Our reason for using color is that the band yielded more “definite” detections than the other near-infrared bandpasses. Although the numbers are still relatively small, this facilitates the best comparison with the synthesis models. The predictions for four galaxy types (see Table 4 and §5.1) are shown for no dust reddening (thin curves) and a rest-frame extinction mag. The morphological mix of data shows a relatively large dispersion in color that is more consistent with the range predicted by the models that include dust. This suggests that on average, the optical–to–near-infrared continua of most sources in Fig. 10 are reddened by a uniform (possibly “optically thin”) dust component with mag absorption. This measure is consistent with spectroscopic studies of nearby starbursts by Calzetti et al. (1996), Meurer et al. (1997) and photometric modelling by Nakata et al. (1999).
We must emphasise that our models only account for radio emission produced from star-formation processes. The sources labelled as elliptical (or early type) in Fig. 10 are not expected to lie on any of the star-formation derived locii. An AGN most likely dominates their radio emission. We include them here merely as a comparision, and their relationship to normal starbursts is discussed further below.

The sources in Fig. 10 appear more-or-less consistent with the dusty “0.1 Gyr starburst” model. This could in principle apply to the two sources with spiral/disk-like morphology (labelled “S”), but is unconventional for the five elliptical morphologies (see below). A comparison with radio–to–near-infrared flux ratios further constrains the underlying properties of these sources. Figure 11 shows the radio–to–near-infrared flux ratio , defined analagous to eq.[8], as a function of color. The near-infrared emission is dominated by old stars and is less affected by dust than the optical. The radio–to–near-infrared flux ratio should therefore be relatively insensitive to dust. Given the simplicity of our models, the two disk-like sources may not necessarily represent “0.1 Gyr starbursts” as indicated in Fig. 11. They could also belong to the Sab/Sbc or Scd/Sdm classes. For this to be true, the following additional components may play an important role in more ‘realistic’ models: ‘optically-thick’ dust that completely obscures both the and emission without causing appreciable reddening in color, or, contamination by at least an order of magnitude times more radio emission from a central AGN than that produced purely by supernovae. The second possibility is favored by radio observations of a number of luminous infrared galaxies by Norris et al. (1988), where some showed evidence for significant radio emission from compact Seyfert-like nuclei.

The large discrepancy between the four sources with elliptical morphologies (labelled “E”) and predictions from the early-type E/SO models suggests the importance of a significant AGN contribution to the radio emission. Appreciable amounts of optically-thick dust suppressing the optical and near-infrared light (except for extinction by diffuse, optically-thin dust) is not favored by observations (eg. Goudfrooij & de Jong 1995). Most, if not all of these ellipticals are likely to be radio-powered by AGN. At the limiting sensitivity of our radio survey ( mJy), a nominal FR-I galaxy (with ) could be detected to , and indeed the spread in color for the ellipticals in Fig. 11 is consistent with the E/SO (optically-thin dust) model to this redshift. A comparison between the model values with actual observed values implies that such AGN will contribute a factor times more radio emission than that produced by any underlying star formation activity in these systems. It is important to note that the ratio of AGN-to-stellar powered radio activity has a huge spread for the elliptical population in general, and that the factor only illustrates a property specific to the ellipticals in our radio sample.
To summarise, our use of a simple synthesis model that includes radio emission and dust reddening to analyse the properties of sub-mJy radio sources has shown the following: first, the presence of dust with extinctions mag and possibly greater, consistent with previous more direct determinations, and second, that the level of radio emission from non-stellar processes such as AGN could be easily inferred and constrained. This will be particularly important for starbursts hosting Seyfert nuclei where a comparison with more sophisticated dust models may be required to infer the relative contributions.
6 A Method to Select “ULIGS” via Radio/Optical Color
Since the emission (and dust absorption) properties from normal galaxy populations are reasonably well known, a color-color diagram such as Fig. 10 could provide a potential diagnostic for selecting ultraluminous infrared galaxies (ULIGS) to high redshift. The relatively low sensitivity of the Infrared-Astronomical Satellite (IRAS) has primarily confined ULIG selection to the local Universe (Sanders & Mirabel 1996), although there is some speculation that recently discovered faint “SCUBA” sources at sub-millimetre wavelengths could represent their high-redshift counterparts (eg. Blain et al. 1999). Approximately 80% of local ULIGS are believed to be powered by starbursts and the remainder show evidence for an AGN contribution (Genzel et al. 1998; Lutz et al. 1998). Far-infrared observations have shown that dust and molecular gas in local ULIGS is concentrated in compact regions kpc (Okumura et al. 1991, Bryant 1996) and that a large fraction of the optical/UV emission is hidden by optically-thick dust (Sanders et al. 1988). A study of their properties and importance to galaxy evolution therefore requires observations at wavelengths virtually immune to dust absorption. Radio frequencies provide an excellent window of opportunity.
Figure 12 illustrates the predicted locus in color-color space using the synthetic SEDs of three local far-IR selected systems: Arp 220 () - a ULIG undergoing a powerful starburst as seen via high resolution radio observations by Smith et al. (1998); M82 () - a system undergoing a weak-to-moderate starburst, and Mrk 273 () - a ULIG whose bolometric emission is believed to be dominated by a hidden central AGN from the presence of strong Seyfert-2 lines and moderately strong hard X-ray (2-10 keV) emission (Turner et al. 1997). We have used the synthetic SEDs generated by Devriendt et al. (1999) to model the starburst emission. These authors used a self-consistent modelling approach to predict the stellar optical/UV/near-IR emission, its reprocessing into the mid-IR–to–sub-mm by dust, and the nonthermal stellar-powered radio emission based on the empirical radio–to–far-IR luminosity correlation. Due to its strong AGN-dominated nature, the starburst synthetic SED predicted by Devriendt et al. for Mrk 273 differs appreciably from that observed in the radio. For this source, we therefore used the Devriendt et al. SED at wavelengths mm and extrapolated into the radio using its actual observed radio–to–1mm spectral slope and fluxes (obtained from the NASA/IPAC Extragalactic Database 333The NASA/IPAC Extragalactic Database (NED) is operated by the Jet Propulsion Laboratory, California Institute of Technology, under contract with the National Aeronautics and Space Administration.).
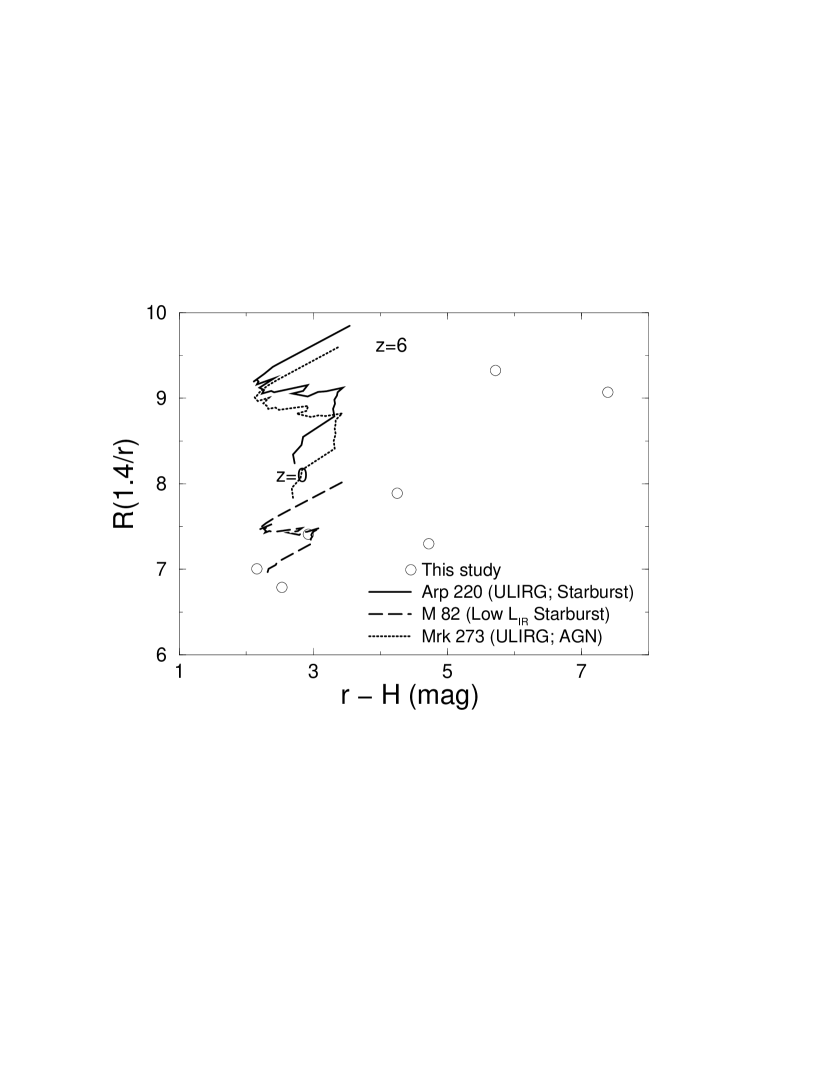
Figure 12 shows that a galaxy characteristic of the (low-IR luminous) M82 system will occupy a region similar to that occupied by normal galaxies in this study (and also their predicted synthetic colors in Fig. 10). Luminous systems classified as ULIGS however (Arp 220 and Mrk 273), will tend have higher radio–to–optical flux ratios which could be easily selected. This can be explained by the well-observed correlation between far-infrared luminosity and far-IR (m)–to–optical spectral slope (Soifer et al. 1987). Consequently, the most IR-luminous systems with the largest far-IR–to–optical ratios are also likely to have a high level of radio-emission due to its strong correlation with IR luminosity. This will lead to a larger than average radio–to–optical flux ratio for ULIGS in general as shown in Fig. 12.
The existence of systems with either larger rest-frame optical/UV extinction or excess AGN contribution to the radio than the ULIGS considered here will be shifted further upwards on this plot. Diagnostics to distinguish between AGN and starburst dominated ULIGS using radio-to-optical color alone will not be trivial and is left to a future study. The three ULIGS in Fig. 12 represent a range of known ULIGS and their location on this plot simply serves as a diagnostic to pre-select ULIG candidates for further study.
A system like Arp 220 (with ) could be observed to redshift 444Assumes , if initially selected from a radio survey limited to Jy. Thus, to limiting sensitivities reached by existing 1.4 GHz surveys, such a method may not probe the highest redshifts. Nonetheless, as shown in Fig. 12, such systems could still be well separated from normal galaxies to this redshift. Assuming an Arp 220-like SED and moderate luminosity evolution (), the surface density of ULIGS to is expected to be of order at Jy, or about of the integral count to this sensitivity (Richards 2000). They should therefore exist in significant numbers in deep large-area radio surveys.
7 SUMMARY AND CONCLUSIONS
We have used the VLA radio telescope to image a contiguous area to a (mean) limiting () sensitivity of mJy. From a total of 62 detections, the results of optical and near-infrared photometry are reported for 43 sources. Our optical photometry is more sensitive than previous optical follow-up studies of radio surveys of similar depth. Our main findings are:
(1) We have used a robust, likelihood-ratio method for determining optical identifications and their reliability. This method is seldom used in identification studies and is insensitive to assumptions concerning fluctuations in background source density and Gaussian error distributions. We assigned optical candidates to 26 radio sources with reliability . Nine radio sources are uncertain and/or ambiguous, and eight are empty fields. Near-infrared photometry from the 2MASS database was reported for 7 sources.
(2) The eight optical empty field sources all display compact and symmetric radio morphologies and most probably represent compact starbursts at strongly obscured by dust. They may require at least 4 magnitudes optical extinction to account for their large radio–to–optical flux ratio compared to the identified population. Our conclusion for them being ‘compact starbursts’ is very tentative as it is purely based on starburst versus AGN number statistics expected from sub-mJy radio surveys. Further deep infrared/optical imaging and spectroscopy will be necessary.
(3) Consistent with previous studies, our deep () optical imaging shows that the optical appearence can be divided into two classes according to radio flux-density: elliptical-like morphologies for mJy, and peculiar or disturbed for mJy.
(4) Using a stellar synthesis model which includes radio emission and dust reddening, we find that the near-infrared–to–optical emission in a small, bright sub-sample is reddened by ‘optically thin’ dust with mag, regardless of morphological type. This appears consistent with other more direct determinations. Consistent with previous studies, the radio emission from early-type systems seems to be powered by AGN rather than star-formation to account for their anomalously large radio–to–optical(–near-infrared) ratios.
(5) Our analysis shows that a radio/optical or radio/near-IR color selection technique could provide a potential means for detecting ULIG-type objects to .
Despite the lack of spectroscopic information, our study of a homogeneous population of faint radio sources has stressed the importance of dust on studies of intrinsic galaxy properties and their evolution at optical wavelengths. A future goal would be to obtain spectra, or multi-color optical/near-infrared photometry to better explore these sources and the validity of the simple stellar synthesis models presented in this paper. The ever improving resolution (and sensitivity) capabilities of optical/near-IR detectors over those feasible at (the longest) radio wavelengths requires robust identification techniques to better ascertain their properties. Likelihood-ratios provide one such technique. The present study complements other deep optical studies of faint radio sources to constitute a statistically significant sample for inferring their nature and importance to galaxy evolution.
| Region | RA(J2000)aaDefines the center of each region with size . | Dec(J2000)aaDefines the center of each region with size . | 5 limit | # sourcesbbTotal number of sources with flux density . | |
|---|---|---|---|---|---|
| (mJy) | (mJy) | ||||
| 1 | 0.061 | 0.305 | 15 | ||
| 2 | 0.065 | 0.325 | 15 | ||
| 3 | 0.090 | 0.450 | 20 | ||
| 4 | 0.076 | 0.380 | 14ccIncludes the separate components of two double-component sources. |
![[Uncaptioned image]](/html/astro-ph/0002490/assets/x15.png)
![[Uncaptioned image]](/html/astro-ph/0002490/assets/x16.png)
![[Uncaptioned image]](/html/astro-ph/0002490/assets/x17.png)
| Type | SFR() | IMF | Age (Gyr)aaFor the SB-type, an age of 0.1 Gyr is assumed to apply at all redshifts. For other types, this refers to the present day age. |
|---|---|---|---|
| E/SO | Scalo | 12.7 | |
| Sab/Sbc | Scalo | 12.7 | |
| Scd/Sdm | constant | Salpeter | 12.7 |
| SB | constant | Salpeter | 0.1 |
References
- (1) Benn, C. R., Rowan-Robinson, M., McMahon, R. G., Broadhurst, T. J., & Lawrence, A., 1993, MNRAS, 263, 98
- (2) Blain, A. W., Smail, I., Ivison, R. J., & Kneib, I. -P., 1999, MNRAS, 302, 632
- (3) Bruzual, A. G., & Charlot, S., 1993, ApJ, 405, 538
- (4) Bryant, P., 1996, In CO observations of Luminous Infrared Galaxies, PhD thesis, California Institute of Technology
- (5) Calzetti, D. Kinney, A. L., & Storchi-Bergmann, T., 1994, ApJ, 429, 582
- (6) Calzetti, D. Kinney, A. L., & Storchi-Bergmann, T., 1996, ApJ, 458, 132
- (7) Calzetti, D., Armus, L., Bohlin, R. C., Kinney, A. L., Koornneef, J., Storchi-Bergmann, T., 2000, ApJ, 533, 682
- (8) Ciliegi, P., McMahon, R. G., Miley, G., Gruppioni, C., Rowan-Robinson, M. et al., 1999, MNRAS, 302, 222
- (9) Condon, J. J., 1989, ApJ, 338, 13
- (10) Condon, J. J., & Yin, Q. F., 1990, ApJ, 357, 97
- (11) Condon, J. J., 1992, A&A Rev., 30, 575
- (12) Condon, J. J., 1997, PASP, 109, 166
- (13) Condon, J. J., Cotton, W. D., Greison, E. W., Yin, Q. F., Perley, R. A., Taylor, G. B., & Broderick, J. J., 1998, AJ, 115, 1693
- (14) Cram, L. E., 1998, ApJ, 506, L85
- (15) Cram, L. E., Hopkins, A. M., Mobasher, B., & Rowan-Robinson, M., 1998, ApJ, 507, 155
- (16) Cutri et al., 2000, Explanatory Supplement to the 2MASS Second Incremental Data Release, http://www.ipac.caltech.edu/2mass/releases/second/doc/explsup.html
- (17) Danese, L., De Zotti, G., Franceschini, A., & Toffolatti, L., 1987, ApJ, 318, L15
- (18) de Ruiter, H. R., Willis, A. G., & Arp, H. C., 1977, A&AS, 28, 211
- (19) Devriendt, J. E., Guiderdoni, B., & Sadat, R., 1999, A&A, 350, 381
- (20) Downes, A. J. B., Peacock, J. A., Savage, A., Carrie, D. R., 1986, MNRAS, 218, 31
- (21) Fanaroff, B. L., & Riley, J. M., 1974, MNRAS, 167, 31
- (22) Gavazzi, G., & Scodeggio, M., 1996, A&A, 312, L29
- (23) Georgakakis, A., Mobasher, B., Cram, L., Hopkins, A., & Lidman, C., 1999, MNRAS, 306, 708
- (24) Genzel, R., Lutz, D., Sturm, E., Egami, E., Kunze, D., Moorwood, A. F. M., Rigopoulou, D., Spoon, H. W. W., Sternberg, A., Tacconi-Garman, L. E., Tacconi, L., and Thatte, N., 1998, ApJ, 498, 579
- (25) Goudfrooij, P., & de Jong, T., 1995, A&A, 298, 784
- (26) Gruppioni, C., Mignoli, M., & Zamorani, G., 1998, MNRAS, 304, 199
- (27) Haarsma, D. B., Partridge, R. B., Waddington, I., & Windhorst, R. A., 1999, 19th Texas Symposium on Relativistic Astrophysics and Cosmology, Paris 1998, ed. J. Paul, T. Montmerle, & E. Aubourg (CEA Sarclay), 600
- (28) Haarsma, D. B., Partridge, R. B., Windhorst, R. A., & Richards, E. A., 2000, astro-ph/0007315, To appear in ApJ
- (29) Hammer, F., Crampton, D., Lilly, S. J., Le Fèvre, O., & Kenet, T., 1995, MNRAS, 276, 1085
- (30) Helou, G., Soifer, B. T., & Rowan-Robinson, M., 1985, ApJ, 298, L7
- (31) Hopkins, A. M., Mobasher, B., Cram, L., & Rowan-Robinson, M., 1998, MNRAS, 296, 839
- (32) Kells, W., Dressler, A., Sivaramakrishnan, A., Carr, D., Koch, E., Epps, H., Hilyard, D., & Pardeilhan, G., 1998, PASP, 110, 1487
- (33) Kron, R. G., Koo, D. C., & Windhorst, R. A., 1985, A&A, 146, 38
- (34) Lonsdale, C. J., Conrow, T., Evans, T., Fullmer, L., Moshir, M., Chester, T., Yentis, D., Wolstencroft, R., MacGillivray, H., & Egret, D., 1998, New Horizons From Multi-Wavelength Sky Surveys, Proc. IAU Colloquium 179, Johns Hopkins University, ed. B. McLean, D. Golombek, J. Hayes, & H. Payne, Kluwer Academic Publishers, p. 450
- (35) Lutz, D., Spoon, H. W. W., Rigopoulou, D., Moorwood, A. F. M., Genzel, R., 1998, ApJ, 505, L103
- (36) Madau, P., Ferguson, H. C., Dickinson, M. E., Giavalisco, M., Steidel, C. C., & Fruchter A., 1996, MNRAS, 283, 1388
- (37) Madau, P., Pozetti, L., Dickinson, M., 1998, ApJ, 498, 106
- (38) Maddox, S. J., Sutherland, W. J., Efstathiou, G., Loveday, J., 1990, MNRAS, 243, 692
- (39) Metcalfe, N., Shanks, T., Fong, R., Jones, L. R., 1991, ApJ, 249, 498
- (40) Meurer, G., Heckman, T. M., Lehnert, M. D., Leitherer, C., & Lowenthal, J., 1997, AJ, 114, 54
- (41) Mitchell, K. J. & Condon, J. J., 1985, AJ, 90, 1957
- (42) Mobasher, B., Cram, L., Georgakakis, A., & Hopkins, A., 1999, MNRAS, 308, 45
- (43) Nakata, F., Shimasaku, K., Doi, M., Kashikawa, N., Kawasaki, W. et al., 1999, MNRAS, 309, L25
- (44) Norris, R. P., Allen, D. A., & Roche, P. F., 1988, MNRAS, 234, 773
- (45) Okumura, S. K., Kawabe, R., Ishiguro, M., Kasuga, T., Morita, K. I., Ishizuki, S., 1991, In Dynamics of Galaxies and Their Molecular Cloud Distributions, ed. F. Combes, F. Casoli, p. 425, Dordrecht:Reidel
- (46) Oort, M. J. A., 1987, A&AS, 71, 221
- (47) Pei, Y. C., 1992, ApJ, 395, 130
- (48) Prestage, R. M., & Peacock, J. A., 1983, MNRAS, 204, 355
- (49) Richards, E. A., Fomalont, E. B., Kellermann, K. I., Windhorst, R. A., Partridge, R. B., Cowie, L. L., Barger, A. J., 1999, ApJ, 526, L73
- (50) Richards, E. A., 2000, astro-ph/9908313, To appear in ApJ
- (51) Rowan-Robinson, M., Benn, C. R., Lawrence, A., McMahon, R. G., & Broadhurst, T. J., 1993, MNRAS, 263, 123
- (52) Sanders, D. B., Soifer, B. T., Elias, J. H., Madore, B. F., Matthews, K., Neugebauer, G., Scoville, N. Z., 1988, ApJ, 325, 74
- (53) Sanders, D. B., & Mirabel, I. F., 1996, ARA&A, 34, 749
- (54) Schaerer, D., 1999, astro-ph/9906014, To appear in Building the Galaxies: from the Primordial Universe to the Present, XIXth Moriond astrophysics meeting, F. Hammer et al. (eds.), Editions Frontieres (Gif-sur-Yvette)
- (55) Scoville, N. Z., Sargent, A. I., Sanders, D. B., & Soifer, B. T., 1991, ApJ, 366, L5
- (56) Serjeant, S., Gruppioni, C., & Oliver, S., 1998, preprint astro-ph/9808259
- (57) Smith, H. E., Lonsdale, C. J., Lonsdale, C. J., & Diamond, P. J., 1998, ApJ, 493, 17
- (58) Soifer, B. T., Sanders, D. B., Madore, B. F., Neugebauer, G., Danielson, G. E., Elias, J. H., Lonsdale, C J., & Rice, W. L., 1987, ApJ, 320, 238
- (59) Stetson, P. B., 1987, PASP, 99, 191
- (60) Sutherland, W., & Saunders, W., 1992, MNRAS, 259, 413
- (61) Thuan, X. T., & Gunn, J. E., 1976, PASP, 88, 543
- (62) Thuan, X. T., & Condon, J. J., 1987, ApJ, 322, L9.
- (63) Thuan, X. T., Windhorst, R. A., Puschell, J. J., Isaacman, B. R., & Owen, F. N., 1984, ApJ, 285, 515
- (64) Turner, T. J., George, I. M., Nandra, K., Mushotzky, R. F., 1997, ApJS, 113, 23
- (65) Windhorst, R. A., Miley, K. G., Owen, F. N., Kron, R. G., & David, C. K., 1985, ApJ, 289, 494
- (66) Windhorst, R. A., Fomalont, E. B., Partridge, R. B., Lowenthal, J. D., 1993, ApJ, 405, 498