email: patricia.lampens@oma.be 22institutetext: National Observatory of Athens, Lophos Nymphon, GR-11810, Greece
Scuti stars in stellar systems: on the variability of HD 220392 and HD 220391††thanks: Based on observations done at La Silla (ESO, Chile) and on data obtained by the Hipparcos astrometry satellite
Abstract
HD 220392 (HR 8895), the brightest member of the visual double star CCDM 23239-5349, is a new short-period variable bright star, probably of the Scuti type. The period analysis performed on the complete set of definitive Geneva photometry as well as on the data obtained at the ESO 0.5m telescope shows two periodicities of about 4.7 and 5.5 cycles per day (cpd) with amplitudes of 0.014 and 0.011 mag respectively. A similar period search on the (smaller) dataset obtained for the 1 mag fainter B-component, HD 220391, however shows no periodicity with an amplitude significantly above the noise level of the data (about 0.006 mag). This difference in variability behaviour is discussed from the consideration that both stars form a common origin pair and are located in the Scuti instability strip.
Key Words.:
Sct – binaries: visual – Stars: individual: HD 220391, HD 220392 – Stars: fundamental parameters1 Introduction
The very wide double star CCDM 23239-5349 is an interesting study case of a
pulsating star within a common origin pair or wide binary. The detailed
investigation of the difference in variability and physical parameters between
two components of a physical couple is particularly worthwhile when both
stars are located in the same area of the colour-magnitude diagram, in this
case both components are in the Scuti instability strip. The aim of
such a study is to search for clues to understand what factors determine the pulsation
characteristics such as modes and amplitudes among Scuti stars in general.
The Hipparcos satellite measurements confirm what was already hinted by
the ground-based astrometric data in the Washington Double Star Catalogue (WDS 1996.0,
Worley & Douglass wor97 (1997)), namely that the wide angular
separation of 26.5 ″of the system is accompanied by a very small
relative proper motion ( milli-arcsec/yr (mas/yr),
mas/yr with errors of the same order).
The new parallaxes are furthermore compatible to better than .
This may indicate a common origin if not a true physical association (Sect. 4.1).
Regular short-period light variations on a time scale of 5 hr have been detected for the brightest component of this visual double star (Lampens lam92 (1992)). We describe the available observations and the reduction methods in Sect. 2. The results of the period analyses are presented in Sect. 3. Also included is the analysis of a selection of the Hipparcos Epoch Photometry data. We discuss the nature of the association and of the variability in Sect. 4. Finally we draw our conclusions in Sect. 5 and we explain why additional observations for both stars of the system would be highly desirable.
2 Observations and reductions
The photometric data have been gathered during three campaigns at La Silla, Chile. For the A-component HD 220392, 7 nights of measurements were made in June 1990, 11 nights were obtained in September 1991 and 3 in October 1992. For the B-component HD 220391, only observations made in September 1991 and October 1992 are available. The June 1990 and September 1991 campaigns have been performed by P. Lampens with the Swiss 0.7m telescope of the Geneva Observatory while the October 1992 data were obtained with the ESO 0.5m telescope by D. Sinachopoulos. We have collected a total of 396 data for the brightest component HD 220392 and 245 for HD 220391. The characteristics of these data are mentioned in Table 1. Standard and additional programme stars have also been observed during these nights. All Geneva measurements are absolute measurements in the filters UBVB1B2V1G obtained through a centralized reduction scheme at the Geneva observatory (Rufener ruf88 (1988)). This centralized Swiss processing has not been applied to the ESO data taken in the UBV photometric system. The reduction of the October data implied using a check-star HD 220729 [F4V, V=5.52, B-V=+0.40] whose measurements were interpolated between the two other ones. We have verified the constancy of this star in the Hipparcos catalogue (mag,mag) and we have fitted a 5th degree polynomial to the check-star data for each night separately. Then we have subtracted this polynomial from the data of both programme stars in order to suppress as well as possible common variations. The ESO data are thus being interpreted as differential measurements relative to HD 220729 only. We kept the differential data acquired at the end of the nights at relatively large airmasses ( 1.6) though they are affected by larger noise, after some trials with various combinations. Our results will thus be based on the largest available datasets. In addition we made use of the data provided in the Hipparcos Epoch Photometry Catalogue (ESA esa97 (1997)).
| Identifier | Instrument | Epoch | Number | Time base |
|---|---|---|---|---|
| [mo/yr] | of data | [days] | ||
| HD 220392 | Geneva | 06/90-09/91 | 124 | 464 |
| ESO | 10/92 | 272 | 9.2 | |
| Gen.+ESO | 06/90-10/92 | 396 | 866 | |
| Hipparcos | 11/89-03/93 | 176 | 41 months | |
| HD 220391 | Geneva | 09/91 | 98 | 19.1 |
| ESO | 10/92 | 146 | 9.2 | |
| Gen.+ESO | 09/91-10/92 | 245 | 416 | |
| Hipparcos | 11/89-03/93 | 172 | 41 months |
3 Period analyses
3.1 HD 220392
3.1.1 Geneva data
The block of 124 data for HD 220392 covers an interval of 464 days (Table 1).
We used the frequency step of cpd () with the PERIOD98
software (Sperl spe98 (1998)). After Fourier analysis of the visual magnitudes, mV,
the frequencies, amplitudes and phases were improved by a least squares fit that gave a main
frequency around 4.679 cpd, the same one as previously reported by Lampens
(lam92 (1992)). The standard deviation dropped by more than 28 % after
prewhitening for this frequency. Since the theoretically expected noise level
of 0.006 mag for a bright constant star observed in the Geneva Photometric
System (Rufener ruf88 (1988)) was not yet reached, a search for a second frequency
in the prewhitened data was performed, revealing either 5.520 or 6.520 cpd.
The (1 day)-1 ambiguity due to the spectral window in the search
for the second frequency is obvious (called ”leakage effect” in Bloomfield blo76 (1976),
see Sect. 3.1.2 below).
The second highest amplitude was found for a two-frequency fit with 5.520 cpd:
results of the simultaneous fits are presented in Table 2(b).
After prewhitening for the frequencies 4.679 and 5.520 cpd, the residual standard
deviation falls to 0.0085 mag, still larger than expected. However, there is very
clear evidence from the plots of the phase diagrams that the 7 data points on
JD 2448518 have a level that is about 0.01 mag off compared to the rest of the data.
This accounts for an extra 0.001 mag residual dispersion. A last Fourier analysis
was done, giving 4.32 cpd and a standard deviation of 0.0073 mag after a third
prewhitening. Evidence for this frequency is small (Sect. 3.1.2).
Similar results are found for the Geneva mU and mB magnitudes.
The fitted amplitudes for a two-frequency fit (preference was given to 5.520 cpd)
are also listed in Table 2(a).
| Set | Filter | Frequency | Semi-ampl. | Residual | Reduction |
|---|---|---|---|---|---|
| [cpd] | [mag] | [mag] | % | ||
| (a) | U | f1, 4.679 | 0.0125 | 0.01302 | 24.2 |
| f2, 5.520 | 0.0125 | 0.01008 | 17.1 | ||
| B | f1, 4.679 | 0.0158 | 0.01397 | 28.0 | |
| f2, 5.520 | 0.0139 | 0.01048 | 18.0 | ||
| (b) | V | f1, 4.679 | 0.0137 | 0.01070 | 28.7 |
| (f2, 6.520) | 0.0096 | 0.00845 | 15.1 | ||
| f1, 4.679 | 0.0128 | 0.01070 | 28.7 | ||
| f2, 5.520 | 0.0099 | 0.00845 | 15.1 | ||
| (c) | V | f1, 4.67437 | 0.0155 | 0.00911 | 40.8 |
| f2, 6.52260 | 0.0097 | 0.00644 | 17.3 | ||
| f1, 4.67439 | 0.0139 | 0.00915 | 40.6 | ||
| f2, 5.52234 | 0.0110 | 0.00614 | 19.5 |
3.1.2
ESO and Geneva data
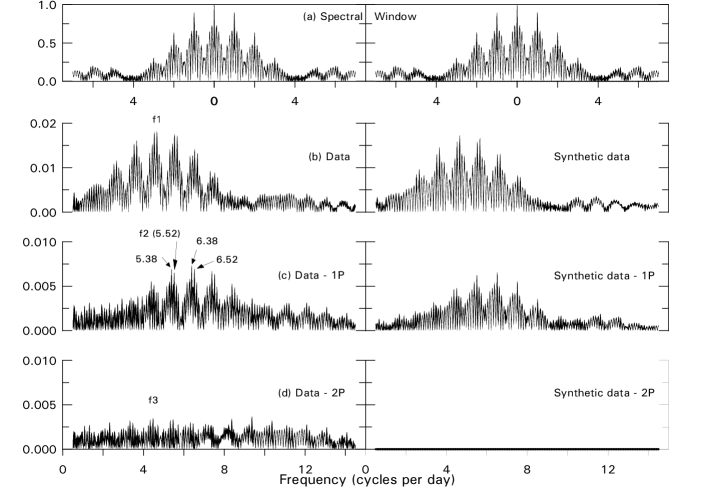
The combination of data was done in the V filter only, as the signal-to-noise ratio of the ESO B data is not as good as that of the V data and because there are fewer ESO U data. To this effect we adjusted for both stars the mean V values of the ESO (differential) data to the corresponding mean Geneva V magnitudes of the September 91 set. Thus adding the ESO data taken in October 1992 to the Geneva observations, a total of 396 V data with a time base of 866 days is available. We have tried different combinations with the datasets that confirm the results obtained with the Geneva data (Table 3). The number of nights (Nights) and the resolution per dataset (Resol.) are given as well. After prewhitening for 4.67 cpd, a new spectral analysis gives peaks at 6.52 or 6.38 cpd for all datasets, except for the complete set of 21 nights which gives 5.52 cpd. These frequencies are shown in brackets on Table 3. Among them, we have preferred 5.52 cpd for three reasons. First, it is the second dominant frequency in the largest dataset. Second, amplitudes for given by the least squares fit are always larger with 5.52 than with 6.52 cpd while standard deviations of the residuals are generally smaller after prewhitening with 5.52 cpd than in the case with 6.52 cpd. Third, an analysis made with the synthetic wave using the time window of September 1991/October 1992 gives as main frequencies 4.664 and 6.52 cpd, occulting the one of 5.52 cpd. This phenomenon is illustrated by Fig. 1 and is due to the ”leakage effect” induced by the night/day alternation. Using these same arguments, we found that the frequency of 6.38 cpd as observed with the October and September/October datasets is also due to leakage, caused by a gap in the October 1992 campaign.


On Fig. 1, there is an additional peak at 9.37 cpd but a least squares fit gives 4.32 cpd as a result for all datasets. However, evidence for this frequency is small as slight changes in the datasets do not confirm its existence: e.g. if we remove the data of only one night of Geneva photometry (JD 8518) this peak disappears. The frequencies for a double-frequency fit were determined by minimization of a subset of 321 data with no quality degradation (i.e. we removed the data of JD 8518 and the high-airmass data obtained at ESO). The results of the final fit for all 396 data are found in Table 2(c). The best match is obtained with the set of frequencies (4.67439,5.52234). We present both mean light curves in Figs. 2 and 3: the first one shows all the data plotted against a frequency of 4.67439 cpd after having taken the 5.52 cpd variation into account while the latter one shows the same but this time against a frequency of 5.52234 cpd. The dispersion around both light curves is fair as it amounts to respectively 0.009 and 0.006 mag. Some 60 % of the initial standard deviation is thus removed.
3.1.3
HIPPARCOS data
The Hipparcos Epoch Photometry Catalogue contains 183 measurements of HD 220392 (HIP 115510). The note in the Main Catalogue however mentions that the ”data are inadequate for confirmation of the period from Ref. 94.191” (ESA esa97 (1997)). The reason is that all the quality flags are equal to or larger than 16, meaning ”possibly interfering object in either field of view”. The effective width of the aperture (called Instantaneous-Field-of-View) is 38 arcsec, so companions at angular separations between 10 and 30 arcsec may interfere significantly during the measurement. We selected 177 data with a value of the quality flag not worse than 18, with a transit error on the (dc) magnitude not larger than 0.015 mag (2 data have not) and with good agreement between the (ac) and the (dc) magnitudes (1 datum has not) (ESA esa97 (1997), Vol. 1, Appendix A). In addition, we had to eliminate one more datum, the brightest one. The mean of the remaining data is 6.204 mag with a standard deviation of 0.024 mag. Fourier analysis between 0. and 23. cpd shows a peak at 4.6743 0.0001 cpd, i.e. the same main frequency as found in all former datasets. The corresponding phase diagram is illustrated in Fig. 4: the amplitude associated with is 0.013 mag large. The second frequency (5.52 or 6.52 cpd) is below detection: prewhitening for the main frequency still leaves a (large) dispersion of 0.021 mag. A double-frequency simultaneous fit attributes an amplitude of 0.013 mag to but only 0.003 mag to .
| Freq. | Sept.’91 | June’90 | Oct.’92 | Sept.’91 | Total |
|---|---|---|---|---|---|
| + Sept.’91 | + Oct.’92 | ||||
| Nights | 11 | 18 | 3 | 14 | 21 |
| Resol. | 0.0523 | 0.0022 | 0.1082 | 0.0024 | 0.0012 |
| f1 | 4.674 | 4.679 | 4.661 | 4.664 | 4.674 |
| (f2) | (6.520) | (6.520) | (6.398) | (6.383) | 5.522 |
| f2 | 5.523 | 5.520 | 5.536 | 5.523 | 5.522 |
| f | 4.320 | 4.316 | 4.320 | 4.321 | 4.320 |
3.2 HD 220391
3.2.1
ESO and Geneva data
245 observations were obtained during the last two seasons only, spanning 14 nights. Again the data obtained on JD 8518 are conspicuously ”low”: the same effect as in the former data analysis was detected, implying an artificial increase in standard deviation of about 0.001 mag. We note the much smaller standard deviation of 0.0061 mag in the rest of the measurements. A frequency search was performed in a similar way as for HD 220392: only one peak at the frequency 0.42 cpd was found. However, the associated amplitude is below the expected noise level and the reduction of the standard deviation is very low (Table 4). Additional observation campaigns should be undertaken to investigate the reality of this frequency.
| Campaign | Frequency | Semi-ampl. | Resid. | Reduction |
|---|---|---|---|---|
| [cpd] | [mag] | [mag] | % | |
| Sept. 1991 | 0.425 | 0.0034 | 0.0062 | 7.3 |
| Oct. 1992 | 0.422 | 0.0059 | 0.0041 | 33.0 |
| Total | 0.426 | 0.0050 | 0.0051 | 19.0 |
3.2.2
HIPPARCOS data
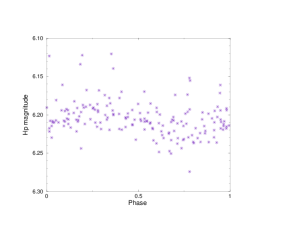
The Hipparcos Epoch Photometry Catalogue contains 182 measurements of HD 220391 (HIP 115506). As in the first case, all quality flags are equal to or larger than 16. We selected 172 data with a value of the quality flag not worse than 18, with a transit error on the (dc) magnitude not larger than 0.020 mag (6 data have not) and with good agreement between the (ac) and the (dc) magnitudes (3 data have not). The mean of these is 7.227 mag with a standard deviation equal to 0.026 mag. Fourier analysis between 0. and 23. cpd displays a peak at 11 cpd (with an associated amplitude of 0.013 mag!), an artefact frequency of order , introduced by the rotation period of the satellite and very conspicuous in the spectral window Fouriergrams.
4 Astrophysical considerations
4.1 The nature of the association
| Identifiers | HD | 220392 | 220391 |
|---|---|---|---|
| Hip | 115510 | 115506 | |
| CCDM | 23239-5349A | 23239-5349B | |
| Sp. Type | F0IVn | A9Vn | |
| mag | 6.124 0.014 | 7.103 0.007 | |
| U | mag | 1.608 | 1.538 |
| V | mag | 0.647 | 0.662 |
| B1 | mag | 0.958 | 0.954 |
| B2 | mag | 1.422 | 1.426 |
| V1 | mag | 1.364 | 1.379 |
| G | mag | 1.769 | 1.790 |
| d | mag | 1.314 | 1.259 |
| m2 | mag | -0.491 | -0.494 |
| BV1 | mag | 0.058 | 0.047 |
| mag | +0.83 0.15 | +1.62 0.15 | |
| mag | +0.87 0.15 | +1.66 0.15 | |
| log | K | 3.856 0.008 | 3.867 0.009 |
| dex | -0.05 0.09 | -0.12 0.10 | |
| log g | dex | 3.77 0.07 | 4.06 0.07 |
| 2.3 0.2 | 1.8 0.2 | ||
| km | 165 | 140 | |
| mas | 6.79 1.43 | 9.19 2.44 | |
| mas | 8.7 1 | 8.0 1 | |
| mag | +0.28 0.46 | +1.92 0.58 | |
| ”/yr | 0.073 | 0.071 | |
| ”/yr | -0.035 | -0.033 |
(1)from the Geneva Photometry calibration
(2)based on the Hipparcos parallax
From the mean colour indices in the Geneva Photometric System and the corresponding calibrations for A-F type stars (Hauck hau73 (1973), Künzli et al. kun97 (1997)), we derive the physical parameters presented in the upper part of Table 5. An estimation of the masses is obtained utilising the calibrations from Kobi & North (kob90 (1990)) and North (private comm.). Spectral types were determined by Gray & Garrison (gra89 (1989)). Rotational velocities are from Levato (lev75 (1975)). Bolometric corrections have been taken from Flower (flo96 (1996)). In addition, we have the Hipparcos trigonometric parallaxes and proper motions, useful to establish the nature of the association between both stars: the values of the parallaxes differ by only 1 to 1.5 and the resemblance of the proper motions is striking (bottom part of Table 5)(ESA esa97 (1997)). A very small relative proper motion of magnitude 0.0029″/yr in the direction of 315∘ accompanies the large angular separation of 26.5″, which is the reason of its classification as a common proper motion pair. For this reason and because both parallaxes are in reasonable agreement, the physical association of the pair is probable (van de Kamp vdk82 (1982)). The fact that both stars share the same location in space augments the probability that they were formed at the same time from the same parent cloud. Adopting the mean of both values as the system’s parallax ( = , in good agreement with ), we obtain a real separation of the order of 3300 AU between the two components (neglecting the effect). For a mass sum of 4.1 M⊙, the orbital period is very long, years. Both stars also share the same projected rotational velocity. We checked for radial velocity data as a further evidence of the wide association (i.e. we expect a small radial velocity difference). Grenier et al. (gre99 (1999)) published radial velocities for both stars only very recently: they determined 17.2 0.69 km/s for HD 220392 and 10.75 4.06 km/s for HD 220391 (while Barbier-Brossat et al. bar94 (1994) listed +6.7 km/s for HD 220392). Thus, not only is there a good agreement between both values, in addition it seems that component B has a variable radial velocity (No further conclusion can be drawn for the latter component as this is based on three measurements only). Again making use of the Hipparcos parallax and of the definition of distance modulus, one can derive an absolute magnitude, , but - due to the relative error of 20-25% on the parallaxes - the absolute magnitudes thus derived are too imprecise.
We give preference to the absolute magnitudes derived from the photometric calibration, , to fit a model of stellar evolution of solar chemical composition (Schaller et al. sch92 (1992)) in a theoretical H-R diagram. The same isochrone with an estimated age of years for the system appears to fit both stars well (Fig. 5), as was also verified by Tsvetkov (tse93 (1993)). We conclude that both stars form a common origin pair and probably even a true binary system.

4.2 The effects of rotation
In this section we want to investigate whether rotation could have an influence on the derived physical quantities from Table 5 and on the previously determined age and evolutionary phases. Both stars indeed seem to present rapid rotation and their photometric indices might be affected by the rotation effects such as described by Pérez Hernández et al. (per99 (1999)) (hereafter PH99). In some cases these effects appear to be larger than the errors from the calibration: corrections for rotation have been considered by Michel et al. (mic99 (1999)) when analysing several fast rotating Scuti stars of the Praesepe cluster.
We recall here that the calibration of the multicolour Geneva colour indices in terms of various physical stellar parameters rests on a large sample of stars with well known spectroscopic characteristics (i.e. with known abundances, vsini, spectral classification, etc) that have been measured in this photometric system. Such calibrations are therefore in the first place empirical (Golay gol80 (1980)). They are based on real stars and do not exactly correspond to non-physical objects (such as zero-rotating stars). Spectroscopically calibrated parameters (such as Teff and log g) will not suffer too much from the effects of rotation however, mainly because slow rotators will preferentially be chosen as reference objects because of a higher precision of the stellar parameters. On the other hand, one must also recall that the mean rotational velocity of normal A9V and F0IV stars is 130 km/s (Schmidt-Kaler sch82 (1982)). When we thus wish to correct the photometric indices for the effects of rotation, we will not need to apply the full range of proposed colour differences: the true correction in the sense observed minus reference object will be smaller than the corrections computed by comparing a uniformly rotating model (represented by the observed star) to a non-rotating model (represented by the zero-rotation ”copartner”).
Because our targets have such similar properties, both in temperature and in projected rotational velocity, we determined the corrections for the secondary (a MS star) and applied identical corrections to the more evolved component. To do this, we have estimated the break-up velocity and the rate of rotation for each of them. Using and Eq. (27) (PH99) with a polar radius Rp= 1.5 R⊙ we find that = 41-42 Hz. Since = 165 km/s and = 140 km/s, we determine a rotation rate = / smaller than 40% for both. In addition, we may deduce that the inclination is probably . We applied the (excessive) colour differences corresponding to = 50%, i = , log ge = 4.34 and log Te = 3.89, where
(Eqs. (21) and (22) in PH99).
The (over)corrected photometric parameters then are:
B2-V1=0.042,d=1.335, m2=-0.489 for star A and
B2-V1=0.031,d=1.281, m2=-0.492 for star B.
The corresponding new locations of both stars in the H-R diagram are represented by
the filled symbols in Fig. 5. The differences are of the order of the respective errors
but somewhat larger in Teff: 0.04-0.05 dex in log g (or -0.03 to -0.07 in Mbol)
and 100 K in temperature.
One may therefore safely state that the application of realistic corrections for the
rotation of both stars does not really affect the previous conclusions
re their physical properties, their age and evolutionary phases.
4.3 The nature of the variability
The mean (d, B2-V1)-values place both stars well within the
Scuti instability strip as observed in the Geneva Photometric
System. We note the interesting situation that two stars having such similar
characteristics behave quite differently from the variability point-of-view.
In the previous sections we have shown that the brighter component has a
Scuti type of variability with a total amplitude of 0.05 mag while the
fainter component presents no short-period variability of amplitude larger
than 0.01 mag. What could the cause(s) be for this observed difference in variability?
From the Geneva colour indices, it appears that the
brightest component has , thus it is more evolved
than its companion. From the isochrone fit, one may also notice the
probable core hydrogen burning evolutionary phase of HD 220391 and the overall
contraction or shell hydrogen burning phase of the
brighter component, HD 220392. Evolution appears here to be the most
probable cause for the diversity in variability (in period and/or amplitude)
between the two stars.
Many Scuti stars are evolved objects (e.g. North et al. nor97 (1997)).
It is further known that many Scuti stars in the advanced shell H burning
stage showing single or double-mode pulsation with high amplitudes
(semi-amplitude mag) are confined to the cooler part of the
instability strip (Andreasen and83 (1983)). In addition, these are slow rotators.
We here have a case of an evolved Scuti star of low amplitude (with
a semi-amplitude of 0.014 mag if one considers only the main frequency - which is
disputable), presenting the signature of multiple frequencies and of rapid
axial rotation. This is not surprising since low-amplitude pulsators cover the entire
instability strip (Liu et al. liu97 (1997)). We might conjecture that, in this case,
the amplitude of the pulsation could be limited due to fast rotation.
In fact, from the point-of-view of pulsation versus rotation, Solano & Fernley
(sol97 (1997)) tend to believe that fast rotation favours the Scuti type
of pulsation. One could wonder why there is no evidence for short-period
variability of this type in the less evolved companion star. (A possible explanation
might be that the companion is an even faster rotator with a different
(smaller) inclination than the more evolved star and that the amplitude(s) of the pulsation
are further damped, possibly beyond photometric detectability.)
Can we identify any pulsation mode for HD 220392?
Expected values for a 2 standard Population I model are 0.033 days (F),
0.025 days (1H), 0.020 days (2H) or 0.017 days (3H) in the case of radial modes (l=0).
For non-radial pressure modes (l=1), these values may be slightly larger: 0.036 days
(f), 0.029 days (p1), 0.022 days (p2) …(Fitch fit81 (1981); Andreasen et al. ane83 (1983)).
The physical parameters of
Table 5 may be used for the computation of the pulsation constant Q:
log Q = log() + 0.5 log() + 0.3 + 3 log() -12.697, where is the frequency in cpd.
The propagation of errors shows that the error on the pulsation constant is
of order 0.003 days (0.07 on ). The results are given in
Table 6. The values thus computed are on the high side for a definitive mode
identification: one could draw the conclusion that the frequency
possibly corresponds to the fundamental radial mode (F). We wish to
remark that non-radial g modes as well as undetected binarity are possible
reasons for higher values of Q (There is however no indication for the latter
from the Hipparcos results). The frequency ratio f2/f1, 0.84,
is not very helpful in this case.
We stress the fact that additional photometric observations for this interesting
couple of stars are highly recommended. The obtained data are not sufficiently
numerous to allow unambiguous solutions nor to solve for the multiple frequencies.
Radial velocities would be needed too.
| Identifier | Frequency | log Q | Q | Comment |
|---|---|---|---|---|
| [cpd] | [days] | [days] | ||
| HD 220392 | 4.674 | -1.358 | 0.044 0.003 | |
| 5.522 | -1.431 | 0.037 0.003 | F? | |
| (6.522) | -1.501 | 0.032 0.003 | (F?) |
5 Conclusion
Binary and multiple systems with pulsating variable components offer a unique opportunity of coupling the information obtained by astrometric means (association type - parallax - total mass) to the astrophysical quantities gained from the photometry /spectroscopy (luminosity ratio - colours - pulsation characteristics)(see Lampens & Boffin lam00 (2000) for a review of Scuti stars in stellar systems). The detailed investigation of the differences in variability and simultaneously in physical properties between two components of a binary system may provide clues with respect to the pulsation: differences in origin and age can be ruled out as well as differences in overall chemical composition. Stronger constraints exist for the determination of the position of the components in the H-R diagram, there is therefore less ambiguity in determining the evolutionary status and the mass than in the case of single variable stars. This is important when one of the components is located in the zone where evolutionary tracks are bent (e.g. near the end of the core hydrogen burning phase).
A relevant question is what factors determine the pulsation characteristics (the amplitudes and the modes) in the Scuti instability strip? We addressed this from the point-of-view of two bright A/F-type stars that are both located in the Scuti instability strip and that are shown to be physically associated, i.e. they either form a common origin pair or they are the components of a true wide binary system. In this case, evolution (and mass) is the most pronounced physical difference between both stars and it is very probable that this is the cause for the observed difference in variability behaviour. Further observations are needed, the more that, since there is no evidence for any metal lines in the spectra, a comprehensive variability analysis of this system might also help explaining the presence of non-variable, non-metallic stars in the instability strip.
In the light of the discussion by Solano & Fernley (sol97 (1997)) on the relation between rotational velocity and amplitude, we noted the remarkable similarity of the projected rotational velocities: both stars are rather fast rotators. If fast rotation favours pulsation of the Scuti type, we expect to find short-period variability for the B-component as well! Since it is less evolved than its brighter companion, smaller amplitudes are expected. This is another reason why intensive monitoring of this southern system is certainly worthwhile. In our example it was very easy to identify the short-period pulsating component and the information obtained from the astrometry could be coupled to the astrophysical parameters of each component individually. Even better would be to investigate these characteristics in a close visual binary for which information on the orbital motion can also be derived. This will allow to obtain a direct estimation of the stellar mass, independent from the choice of modelisation. The derivation of the pulsation constant will be more straightforward (the error on the mass defines the accuracy of Q). More cases like this one should be looked into (see Frandsen et al. fra95 (1995)).
With this application in mind, we made a crossidentification between
the Annex of Variable Stars and the Annex of Double and Multiple Stars from
the Hipparcos Catalogue (ESA esa97 (1997)). Some 2500 systems with at least one
variable component have been identified. But the description of the
variability or the light curve in the Annex always refer to the combined
magnitudes. Additional observations should help identify which component is
variable and which are the binaries that offer the opportunity of
coupling the information obtained by astrometric means to the physical properties
in order to obtain a consistent picture of the system and its components.
Acknowledgements
We thank the Geneva team (especially Dr. G. Burki) for the telescope time put at our
disposal in June 1990 and September 1991. Dr. Sperl is kindly acknowledged
for making the programme Period98 available for this application. We appreciate
the help of Dr. L. Eyer (Geneva Observatory) in the selection of the Hipparcos Epoch
Photometry data. We thank our colleague, Dr. J. Cuypers, for a critical reading and
the referee, Dr. P. North, for constructive comments on this manuscript. The Geneva
data can be requested from the Geneva photometry team. The ESO data are available on
request from the authors. This work has made use of the Simbad database,
operated by the Centre de Données astronomiques de Strasbourg (France).
References
- (1) Andreasen G.K., 1983, A&A 121, 250
- (2) Andreasen G.K., Hejlesen P.M., Petersen J.O., 1983, A&A 121, 241
- (3) Barbier-Brossat M., Petit M., Figon P., 1994, A&AS 108, 603
- (4) Bloomfield P., 1976, Fourier Analysis of Time Series: An Introduction, Wiley & Sons (eds.), New York
- (5) ESA, 1997, The Hipparcos and Tycho Catalogues, ESA SP–1200
- (6) Fitch W.S., 1981, ApJ 249, 218
- (7) Flower Ph., 1996, ApJ 469, 355
- (8) Frandsen S., Jones A., Kjeldsen H., et al., 1995, A&A 301, 123
- (9) Golay M., 1980, Vistas Astron. 24, 141
- (10) Gray R.O., Garrison R.F., 1989, ApJS 69, 301
- (11) Grenier S., Burnage R., Faraggiana, R., et al., 1999, A&AS 135, 503
- (12) Hauck B., 1973, Three-Dimensional Representation of A0-G5 Stars. In: Hauck B., Westerlund B.E. (eds.), Proc. IAU Symp. 54, Problems of Calibration of Absolute Magnitudes and Temperature of Stars. Reidel, Dordrecht, p.117
- (13) Kobi D., North P., 1990, A&AS 85, 999
- (14) Künzli M., North P., Kurucz R.L., Nicolet B., 1997, A&AS 122, 51
- (15) Lampens P., 1992, Delta Scuti Newslet. 5, 9
- (16) Lampens P., Boffin H.M.J., 2000, Scuti Stars in Stellar Systems: a Review. In: Breger M., Montgomery M. (eds.), 6th Vienna Workshop in Astrophysics on Delta Scuti and Related Stars. Vienna (in press)
- (17) Levato A., 1975, A&AS 19, 91
- (18) Liu Y.Y., Baglin A., Auvergne M., Goupil M.J., Michel E., 1997, ESA SP-402, 363
- (19) Michel E., Hernández M.M., Houdek G. et al., 1999, A&A 342, 153
- (20) North P., Jaschek C., Egret D., 1997, ESA SP-402, 367
- (21) Pérez Hernández F., Claret A., Hernández M.M., Michel E. 1999, A&A 346, 586 (PH99)
- (22) Rufener F., 1988, Catalogue of stars measured in the Geneva Observatory Photometric System, 4th Ed., Geneva Observatory (ed.), Geneva
- (23) Schaller G., Schaerer D., Meynet G., Maeder A., 1992, A&AS 96, 269
- (24) Schmidt-Kaler T.H., 1982, in: Landolt-Bornstein New Series 2b, Schaifers K., Voigt H.H. (eds.), Springer-Verlag
- (25) Solano E., Fernley J., 1997, A&AS 122, 131
- (26) Sperl M., 1998, Manual for Period98 : V1.0.4, (http://dsn.astro.univie.ac.at/period98)
- (27) Tsvetkov Ts.G., 1993, Ap&SS 208, 285
- (28) van de Kamp, P. 1982, Evolutionary Trends in Wide Binaries. In: Kopal Z., Rahe J. (eds.), Proc. IAU Coll. 69, Binary and Multiple Stars as Tracers of Stellar Evolution. Reidel, Dordrecht, p.81
- (29) Worley C., Douglass G., 1997, A&AS 125, 523