A Comparison of the Extra Nuclear X-ray and Radio Features in M87
Abstract
ROSAT High Resolution Imager (HRI) data from eight observations have been co-added to obtain an effective exposure of 230 ksec. We have identified a number of features and regions with excess X-ray brightness over that from a circularly symmetric model of the well known hot gas component. A prominent ‘spur’ extends 4′ from the vicinity of knot A towards the south-west. The brightness to the south and east of this spur is significantly higher than that to the north and west. Excess brightness is also found to the East of the nucleus, with a local maximum centered on the eastern radio lobe 3′ from the core.
There are two well known relationships between radio and x-ray emission for radio galaxies in clusters: coincidence of emissions because the X-rays come from inverse Compton or synchrotron processes; and anti-coincidence caused by exclusion of hot gas from radio entities. We present a radio/X-ray comparison to determine if either of these relationships can be isolated in M87. The greatest obstacle we face is the unknown projection which affects both bands.
1 Introduction
Eight ROSAT/HRI observations of M87 were made between 1992Jun and 1998Jan to study the X-ray structure and variability of the core and jet (Harris, Biretta, and Junor, 1997 and 1998a). To study the large scale X-ray features of M87, we have used these data to make an image with effective exposure of 230 ksec. A preliminary analysis based on the data then available was presented at the Ringberg Workshop on M87 held in 1997Sep (Harris, Biretta, and Junor 1998b).
The radio map of M87 (see Owen, this volume) appears to indicate an exceedingly complex structure, for which it is difficult to make meaningful measurements of isolated features. Generally, we need to define volumes and measure their emission properties. Once you leave the inner (brightest) lobes and jet, this is not easily done. Even for definable filaments and other features, the surface brightness is often a sum of emissivities from various entities along the line of sight. The X-ray map suffers from the same problem although generally there is less fine structure than in the radio (at similar resolutions). An additional complexity for the X-ray analysis is that we cannot be certain that the very large scale X-ray distribution from the hot gas of the Virgo cluster is circularly symmetric.
2 M87 as a Wide Angle Tailed Radio Galaxy
One possible interpretation of the radio map is that we are viewing a Wide Angle Tailed (WAT) radio galaxy from an angle such that a large fraction of the radio source is well beyond (or in front of) the central part of the galaxy. Thus the observed radio brightness at any given location will usually be the sum of contributions from several different emitting volumes. There are at least three supporting arguments for this hypothesis, although none is conclusive.
Without invoking substantial projection effects, it is difficult to maintain continuity between various radio features. In the bright inner region, we see the primary jet bending around to the south, yet the larger scale emission which one might expect to connect to the bright features, is found due West. The same situation occurs on the East side of the source.
Without projection, many features display rather strong curvature. Besides the inner lobes, projection effects may be the cause for the apparent curvature in the eastern double ring and in the ‘L’ filament at the south-east edge of the source. The double ring itself is difficult to understand if it were completely in the plane of the sky. The radio galaxy in Abell 119 (Feretti et al. 1999; see also Govoni et al. in thses proceedings) shows a helical structure which, if viewed along the arm of the tail, could project to something like the apparent structure of the double ring.
Pressure balance between the ambient gas and the non-thermal pressure within radio features is expected for most of the radio structures except those within the very bright central region. We have compared non-thermal pressures for two low brightness regions close to the center with the expected thermal pressure derived from the work of Nulsen and Böhringer (1995). As shown in Table 1, the thermal pressure exceeds the minimum non-thermal pressures for both regions. We integrated the radio spectrum between 107 and 1010 Hz and used spectral index values of 0.8 and 0.9 (from a spectral index map between 74 and 327 MHz provided by N. Kassim). The entries for k=0 represent the minimum pressure for the case of the filling factor, =1 and no contribution to the particle energy density from relativistic protons (k=0). The entries with k=100 correspond to either protons having 100 times the energy density of the relativistic electrons or =0.01. The last column indicates the radial distance required to reach pressure balance between the thermal gas and the non-thermal radio feature. In all cases, these distances are greater than the projected distance from the center.
-
a
The cube is located 90′′ SW of the nucleus (the head of the ‘cobra’, RA12h30m43s and DEC12∘23′). The cylinder is 72′′ due east of the nucleus, a segment of the ‘eastern arm’ at RA12h30m54s, DEC12∘23′45′′. is the factor for energy density from relativistic protons. k=100 is equivalent to a filling factor of =0.01. The thermal pressure expected at the radial distances of the cube and cylinder are 1.05 and 1.2 10-10 dyne cm-2.
-
b
B is the magnetic field strength for equipartition.
-
c
P(nt) is the non-thermal pressure.
-
d
ne(bal) is the thermal electron density required to balance the non-thermal pressure for a temperature of 2 keV.
-
e
R is the radial distance at which the model density equals ne(bal).
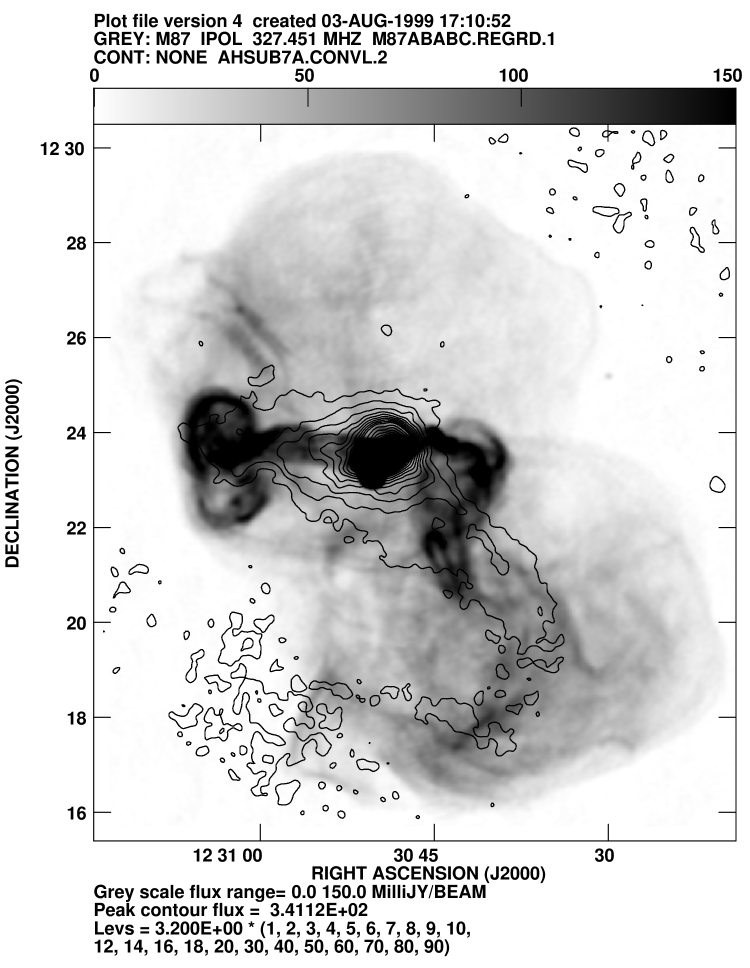
There are various possible reasons for a relative motion between the ICM and M87 which could produce a WAT structure. Harris et al. (1998b) suggested that the SW X-ray spur (see fig. 1) might be caused by a shock between the ISM of M87 and the ICM disturbed by a merger of the M86 subgroup with the M87 subgroup. We note the relative velocity of M87 and M86, km s-1, is sufficient to shock K gas. Other possibilities are that M87 might not be at the center of the potential well of the Virgo cluster or that the cooling flow might be asymmetric if the kinetic energy supplied by the movement of radio structures supplied heat to the local gas in a non symmetric fashion.
3 Data
The data reduction for the present comparison of radio and X-ray maps involved the following steps.
-
•
Five of the eight X-ray observations were corrected for the bug in the standard processing which used incorrect aspect times (see the documents available at the anonymous ftp server: sao-ftp.harvard.edu; cd to pub/rosat/aspfix). The other three observations were made after 1997Jan when this bug had essentially no effect on image quality.
-
•
The centroid of the core emission was measured for each observation and each map was then shifted to a common position before stacking.
-
•
The radial profile of the total emission was measured in a 90∘ quadrant towards the north west, centered on the peak of the core emission.
-
•
On the basis of this profile, a circularly symmetric King model was constructed to represent the bulk of the cluster emission. The model was then subtracted from the data and the residual was smoothed with Gaussians of various widths. Note that this was more of a procedural process than a true modelling of the emission since the profile does not match a simple King model. It does, however, emphasize the contrast between residual features and the remaining background.
-
•
Finally, the radio map was precessed to J2000 and the X-ray map was shifted so as to align the X-ray and radio core emissions.
4 Radio/X-ray Coincidence
Coincidence between radio and X-ray emissions can be expected when both arise from non-thermal processes: i.e. the X-ray emission is either synchrotron or inverse Compton emission. Although successful models for synchrotron X-ray emission from knot A in the M87 jet have been published (Biretta, Stern, and Harris 1991), the (presumably) older and larger radio structures (fig. 1) under discussion here are not expected to provide the environment to produce the very high energy electrons (Lorentz energy factors 107) required for X-ray synchrotron emission. Inverse Compton emission however, will be present, both from the 3K background photons (‘IC/3K’) and from other photons such as star light.
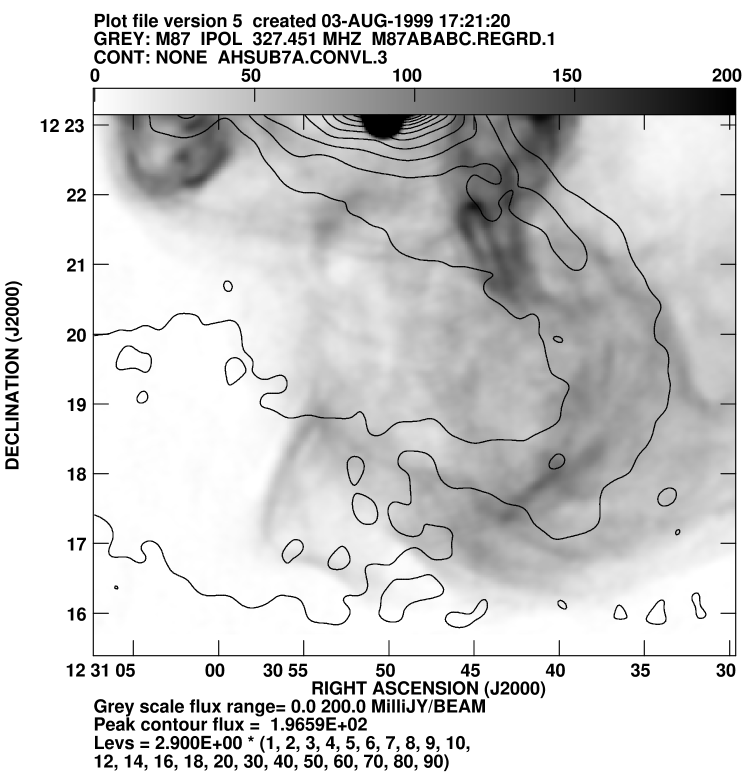
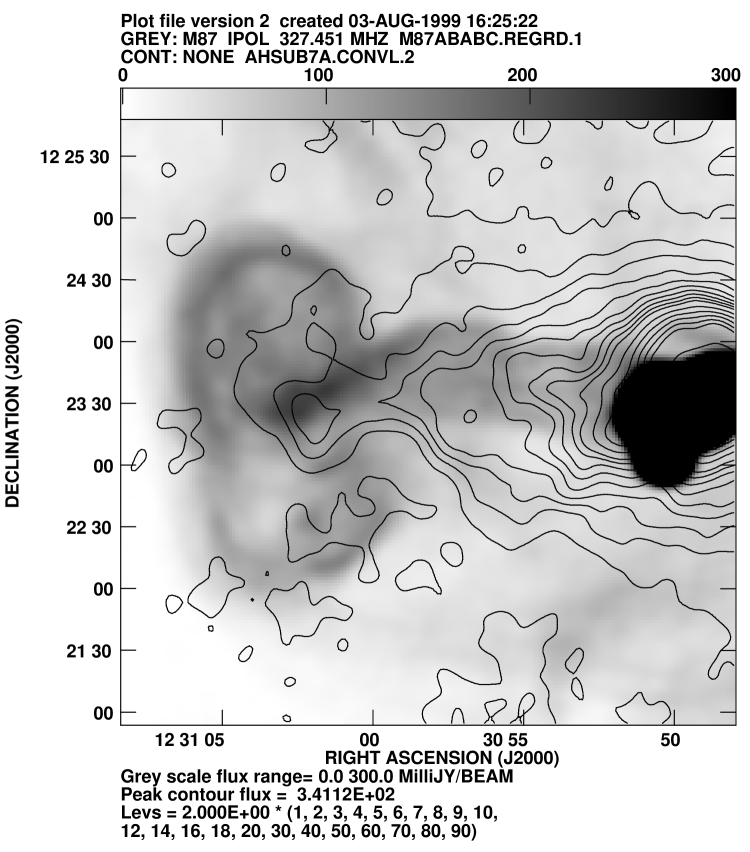
There are only two regions where a general coincidence of radio and X-ray emissions are found. These are (a) in the southern part of the radio source where a curved feature, the bottom of the (so-called) ‘cobra’ shows low brightness enhancements in both bands (fig. 2); and (b) the ‘eastern radio arm’ extending due East from the core and ending in the region at the center of the double radio rings (fig. 3). Note however that even here, the spatial agreement is not precise.
Because most of the radio and residual X-ray emissions are not co-spatial in a detailed sense, we conclude that the bulk of the residual X-ray emission is likely to be thermal. For example, the general association of the radio and X-ray emission might arise from heating of the ISM by the passage of the radio jets. It has become fashionable (at least at this meeting) to suggest that relativistic particles do not necessarily occupy the same volumes defined by radio emitting regions containing the strongest average magnetic field strength. Thus one could have IC/3K emission from regions essentially devoid of radio emission. While this is a valid physical scenario, with our presently available technology, we have no methods to demonstrate that any given X-ray brightness comes from IC processes other than coincidence with known non-thermal emission at other bands and the requisite calculations to demonstrate that the observed intensity and implied field strengths are reasonable. We also note that many of the brighter radio features are devoid of spatially coincident X-ray emission, which tends to argue against the IC process.
5 Radio/X-ray Anti-coincidence
Anti-coincidence is expected for cases in which radio features exclude the hot gas and thus diminish the X-ray surface brightness for particular lines of sight. Convincing examples of this behavior have been found for Cygnus A (Carilli, Perley, and Harris, 1994) and for NGC 1275 (Böhringer et al. 1993). For simple models of lobe expansion, the change in X-ray surface brightness between lines of sight which intersect the lobe and those that traverse only undisturbed ICM can be either positive or negative. This is because we expect to find a sheath of enhanced density around the inflating lobe. The precise behavior for any given situation depends on the energy range covered by the telescope system and on the density, temperature, and thickness of the sheath (Clarke, Harris, and Carilli, 1997).
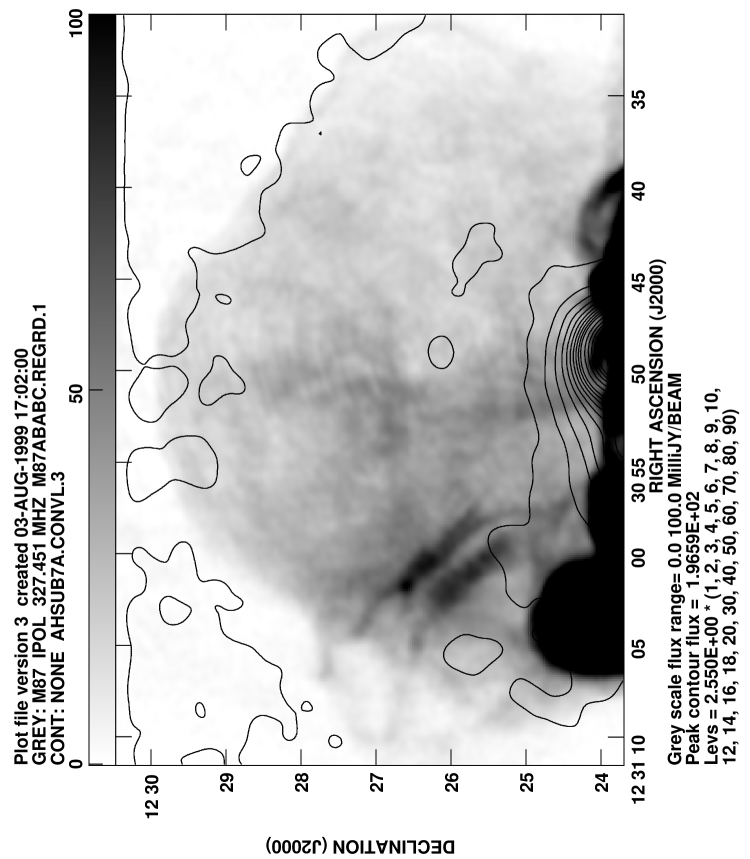
For M87, most of the source outside the high brightness (inner) radio lobes may not fulfill the simple conditions of an expanding lobe with a well defined wall separating it from the ICM and the unknown projection effects may mask the signatures of cavities in the gas. However, there are two possibilities for this sort of effect. The residual map shows a slight discontinuity in brightness gradient along the northern boundary of the radio source which may indicate a smaller integrated emissivity when looking through the lobe (see fig. 4). The other effect is evidenced by two regions of slightly negative brightness in the residual map. These areas are identified in the color figure by the single contour level with center 4′ to the northeast of the core and a similar feature located 3′ west of the core. It is difficult to evaluate the reality of these features because the subtraction of the model is somewhat arbitrary since there is no suitable pie segment in which to measure the true radial profile of ‘undisturbed’ gas.
6 Conclusions
-
•
We suspect that projection effects confuse the interpretation of both radio and X-ray features. Harris et al. (1998b) suggested that the SW spur might be caused by a bow shock between the ICM and the ISM, and the resulting change in temperature and density might explain the presence of knot A in the jet. Since the current evidence supports the notion that the spur is a thermal feature, a convincing explanation for the spur will probably await the spectral/spatial capabilities of Chandra and XMM.
-
•
Many X-ray and radio features are located in the same general region, but it appears that they do not actually occupy the same volumes.
-
•
There is some evidence for edge effects and cavities.
Acknowledgements.
N. Kassim kindly provided us with an unpublished spectral index map. WJ thanks the National Science Foundation for support under Grant AST-980307. The work at SAO was partially supported by NASA contract 5-99002.References
- [1] Biretta, J.A., Stern, C.P., and Harris, D.E. 1991 AJ 101, 1632
- [2] Böhringer, H., Voges, W., Fabian, A.C., Edge, A.C., and Neumann, D.M. 1993 MNRAS 264, L25
- [3] Carilli, C.L., Perley, R.A., and Harris, D.E. 1994 MNRAS 270, 173
- [4] Clarke, D.A., Harris, D.E., and Carilli, C.L. 1997 MNRAS 284, 981
- [5] Feretti, L., Dallacasa, D., Govoni, F., Giovannini, G., Taylor, G.B., and Klein, U. 1999 A&A 344, 472.
- [6] Harris, D.E., Biretta, J.A., and Junor, W. 1997 MNRAS 284, L21
- [7] Harris, D.E., Biretta, J.A., and Junor, W. 1998a to appear in the proceedings of the Ringberg Workshop on M87 (also available from astro-ph/9804201).
- [8] Harris, D.E., Biretta, J.A., and Junor, W. 1998b to appear in the proceedings of the Ringberg Workshop on M87 (also available from astro-ph/9804200).
- [9] Nulsen, P.E.J. and Böhringer, H. 1995 MNRAS 274, 1093.
- [10]