The hard X-ray emission of luminous infrared galaxies
Abstract
We present a study of the hard X-ray properties of a sample that includes all the Luminous Infrared Galaxies (LIGs, L⊙) observed in the 2-10 keV energy band (new and archival data). We find that a significant fraction of the sources optically classified as AGNs do not show any indication of nuclear activity in the X rays, thus suggesting heavy absorption along our line of sight. The absence of strong emission in the 20-200 keV band in a subsample of LIGs observed with BeppoSAX suggests that in many cases these sources are completely Compton thick ( cm-2). From a comparison between the infrared and the X-ray emission we deduce that the mid-IR emission is absorbed by a lower column density than the X-ray emission or, alternatively, that the dust-to-gas ratio is lower than Galactic. We describe a simple model that reproduces the IR–X correlation by means of mixed AGN and starburst contributions and we compare the predictions of this model with the observational data at X-ray and optical wavelengths. Finally, we discuss the biases that affect the currently available samples of LIGs and briefly analyze a small unbiased sample, finding that at least 50% of the sources host a (weak) AGN.
Key Words.:
Galaxies: active - Galaxies: starburst - Infrared: galaxies - X-rays: galaxies1 Introduction.
The nature and the energy source of the Luminous Infrared Galaxies (LIGs) has been a matter of debate since their discovery by IRAS, more than 10 years ago. This class of sources is characterized by a very high luminosity emitted mostly in the far–infrared (). Such a luminosity is higher than in normal galaxies ( erg s-1 for a large spiral like the Milky Way or M31) and therefore an additional source of energy is required. The infrared emission of LIGs is due to the presence of a large amount of dust that reprocesses optical and UV radiation to IR wavelengths. Since the primary emission is often not directly observable, its origin remains controversial.
Two main mechanisms have been invoked in this context: an intense starburst activity and/or an Active Galactic Nucleus (AGN). It is now widely accepted that in general both sources can be present in the LIGs, but the relative contribution of each is still unclear.
Recent studies with ISO of a sample of ULIGs (Ultra Luminous Infrared Galaxies, ) indicate that the bulk of the IR emission is due to starburst activity (Genzel et al. 1998, Lutz et al. 1998). The diagnostic used in these works is mainly based on mid-infrared spectroscopy: in particular, the policyclic aromatic hydrocarbon features at 7.7 m are claimed to be better than optical lines at discriminating between starburst and AGN, because of the lower extinction.
On the other side, numerous X-ray observations performed in the last few years, which will be in part reviewed in this paper, suggest that an AGN contribution to the observed IR luminosity is common.
Resolving this issue would be important not only for the understanding of the LIG phenomenon, but also to assess the contribution of the LIGs to the diffuse X-ray background (XRB). The knowledge of the fraction of the bolometric luminosity which emerges in the hard X-ray domain would allow the inclusion of the LIGs in the models of the XRB. These models are by and large successful in synthesizing the XRB from the contributions of individual AGNs; they must however include a dominant contribution from absorbed, type 2 AGNs, which up to now have been observed directly only at low luminosities and low redshifts. The zeroth-order extrapolation, which assumes that type 2s and type 1s evolve in the same way (“unified model”), has to face several discrepancies, and could be cured only by adding extra type 2 sources at intermediate or high redshifts (Gilli et al. 1999). Some of the LIGs could very well be the required additional sources, but their mean X-ray properties are still poorly known.
The expected X-ray spectrum, and the relative contribution of the X-ray emission to the bolometric luminosity are very different in the cases of AGN and starburst dominance, therefore hard (2-10 keV) X-ray data can be a powerful diagnostic.
The typical X-ray starburst spectrum is a thermal continuum with temperatures ranging from a fraction of a keV to several keV (in units of kT), plus several emission lines at low energies, and a Kα feature of highly ionized iron at the energy of E keV (Cappi et al. 1999, Persic et al. 1998). The 2-10 keV luminosity is less than one part in 103 of the total emission.
The AGN spectrum between 2 and 10 keV is strongly dependent on the amount of obscuration suffered by the primary continuum component: if the absorbing column density is lower than cm-2, the direct continuum spectrum is visible at energies higher than the photoelectric cutoff EC, whose value depends on NH. The mean direct continuum, as deduced from the spectra of unabsorbed AGNs, is well represented by a powerlaw with photon index . In addition, a Kα iron line is observed at energies ranging from 6.4 keV (neutral iron) to 6.95 keV (hydrogen-like iron). The current view is that the iron line originates both from the accretion disc and from a reprocessing medium located farther away (1–10 pc): the first component can be broadened by relativistic effects and is suppressed if the absorbing column density is higher than several times 1023 cm-2, the second component is narrow, and its energy depends on the ionization degree of the reprocessing medium. The equivalent width (EW) of the line is EW 100-200 eV with respect to the intrinsic continuum, and can be much higher (up to some keV) if the continuum is heavily absorbed at the line energy (while the line, produced in a different region, is still visible).
If the column density is higher than cm-2 (i.e. the medium is Compton thick), the intrinsic emission is completely absorbed and only a reflected component survives. The X-ray spectrum of Compton thick sources is generally characterized by an Fe line with large equivalent width ( 1 keV) and a reflection dominated continuum flatter than the intrinsic spectrum (see Maiolino et al. 1998 for further details). While the observed 2–10 keV contribution to the bolometric luminosity can be higher than 10% in unabsorbed AGNs, in Compton thick Seyfert 2s it can be lower than 0.1%.
Summarizing, the X-ray continuum of a starburst is expected to have a thermal high energy cutoff and a soft spectrum with emission lines, while an AGN is characterized by a hard power law with a possible low energy cutoff due to absorption or, in the extremely absorbed cases (Compton thick), a flat reflection spectrum. Cold (E 6.4 keV) and broad iron lines, or a large relative X-ray luminosity are clear signatures of an AGN, whereas narrow lines of ionized iron or a relatively weak X-ray emission are possible in both scenarios.
In this paper we study the sample of all the luminous infrared galaxies observed so far in hard X rays (2-10 keV). We combine the X-ray information with the IRAS photometry, and find interesting correlations between X-ray properties and IR colours. We propose a simple model that matches the observed correlations and is compatible with the available spectroscopic and spectropolarimetric data at near-IR and optical wavelengths.
In Sect. 2 we describe in detail our sample, in Sect. 3 we analyze the X-ray properties of the sources and the correlation between the X and IR emission. Finally, in Sect. 4 we discuss our results in the framework of a geometrical two-parameter model. Conclusions and future work are summarized in Sect. 5. In the Appendix we briefly report the results of our own spectral analysis of those sources which have not been published elsewhere. Throughout this paper we use the cosmological parameters H km s-1 Mpc-1 and q.
2 The sample
The selection of our sample is primarily based on the existence of data in the 2-10 keV energy range. We collected all the galaxies with published 2-10 keV data, and those with unpublished observations in the ASCA and BeppoSAX archives. Within the X-ray sample we selected all the sources detected in at least three IRAS bands with L L⊙. The final sample consists of 78 objects. The X-ray data were obtained from the literature for 63 sources, from the ASCA Public Archive for 10, and from BeppoSAX observations for the remaining 5. The IR data were obtained from the NASA Extragalactic Database.
We briefly discuss the 15 unpublished sources in the Appendix.
Table 1 gives all the relevant information about the sample. The infrared (8-1000 m) luminosity has been obtained from the IRAS fluxes with the following prescription (see, for instance, Sanders & Mirabel 1996):
| (1) |
were are the flux densities in the four IRAS filters expressed in Jansky and is expressed in units of erg cm-2 s-1. When we have only an upper limit for one of the four IRAS points we use one half of the measured upper limit.
name z C F Opt.(d) X(e) name z C F Opt.(d) X(e) III Zw 2 0.0893 1.5 1.52 340(19) 1 Y MKN 273 0.0378 12.6 0.21 3.3(1) 2 N I Zw 1 0.0609 7.5 1.08 35(18) 1 Y Tol 1351-375 0.052 1.2 1.42 38(1) 2∗ Y I 00198-7926 0.0728 10.3 0.74 2+ N MKN 463 0.0497 5.2 1.45 9(3) 2∗ Y PHL 0909 0.171 8.6 0.62 69(20) 1 Y PG 1411+442 0.089 2.2 2.00 7.6(25) 1 Y TON S180 0.0620 1.3 1.86 45(5) 1 Y MKN 1383 0.0865 2.7 1.75 40(11) 1 Y MKN 1048 0.0431 1.9 0.75 9958(1) 1 Y MKN 477 0.0378 1.5 0.80 12(3) 2∗ Y NGC 1068 0.0030 1.4 0.94 35(3) 2+ Y MKN 478 0.079 2.9 0.66 25(5) 1 Y NGC 1275 0.0175 1.7 1.05 1140(3) 2∗ Y PG 1444+407 0.267 7.2 1.83 5.5(25) 1 Y MKN 1073 0.0230 2.3 0.35 1(1) 2+ N I 14454-4343 0.0386 4.4 0.72 2.2(2) 2+ N NGC 1365 0.0059 1.6 0.31 68(9) 2∗ Y MKN 841 0.0363 1.2 1.76 100(12) 1 Y I 03158+4227 0.1344 31.6 0.21 2 N I 15091-2107 0.0446 2.1 0.67 260(14) 1 Y 3C 120 0.0330 1.5 1.09 455(12) 1 Y I 15307+3252 0.9257 182 0.60 2 N I 04154+1755 0.056 4.3 0.37 2 N ARP 220 0.0181 13.0 0.15 8.7(7) 3 N NGC 1614 0.0159 6.1 0.44 5.6(1) 2+ Y PG 1543+489 0.4 36.8 0.76 4(5) 1 Y I 05189-2524 0.0426 12.9 0.50 61(1) 2∗ Y PG 1634+706 1.334 591 0.97 7.1(15) 1 Y MCG+08-11-11 0.0205 1.2 1.30 520(11) 1 Y NGC 6240 0.0245 6.2 0.15 19(3) 2+ Y H 0557-385 0.0344 1.6 4.05 140(19) 1 Y PG 1700+518 0.292 23.4 0.92 1 Y I 07598+6508 0.1488 26.7 0.63 2+ N I 17020+4544 0.0604 2.9 0.75 80(5) 2∗ Y PG 0804+761 0.10 3.5 2.8 88(25) 1 Y I 17208-0014 0.0428 21.6 0.11 3(1) 3 N NGC 2623 0.0185 3.1 0.16 2 N MKN 507 0.0559 1.0 0.37 5(3) 2∗ Y PG 0844+349 0.064 1.2 2.50 23.6(25) 1 Y NGC 6552 0.0262 1.2 0.83 8(3) 2+ Y I 08572+3915 0.0582 12.4 0.48 2+ N I 18325-5926 0.0202 1.0 0.87 84(3) 2∗ Y I 09104+4109 0.4420 107 1.26 5(4) 2+ Y I 18293-3413 0.0182 5.3 0.22 0.9(1) 3 N NGC 3256 0.0091 3.6 0.36 7(8) 3 N 3C 390 0.057 2.1 1.45 170(12) 1 Y MCG+12-10-067 0.0328 1.0 0.5 30(3) 2∗ Y H 1846-786 0.0743 1.9 0.97 170(19) 1 Y I 11058-1131 0.0548 1.8 0.83 3.9(2) 2+ Y I 19254-7245 0.0617 10.5 0.44 1.9(24) 2+ Y PG 1114+445 0.144 4.5 1.58 21(25) 1 Y I 20210+1121 0.0564 6.7 0.83 2.9(2) 2+ Y NGC 3690 0.0104 6.1 0.20 15(17) 3 N MKN 509 0.0353 1.6 1.07 440(12) 1 Y PG 1148+549 0.9690 63.1 1.20 27(25) 1 Y I 20460+1925 0.1810 28.6 1.20 15(3) 2∗ Y WAS 49b 0.0637 1.3 1.59 12(1) 2∗ Y I 20551-4250 0.0428 9.7 0.30 3.5(6) 3 N PG 1211+143 0.0809 3.5 2.32 27.8(25) 1 Y II Zw 136 0.0617 1.8 1.73 53(11) 1 Y 3C 273 0.1583 49.9 0.87 1500(21) 1 Y IC 5135 0.0160 2.1 0.26 5(23) 2+ Y MKN 231 0.0422 32.4 0.50 6(7) 1 Y I 22017+0319 0.0611 4.1 1.24 36(3) 2∗ Y MCG-03-34-064 0.0165 1.3 0.97 47(22) 1 Y NGC 7212 0.0266 1.2 0.53 9.8(1) 2∗ Y I 13224-3809 0.0667 3.4 0.33 5.2(5) 1 Y 3C 445 0.0562 1.8 1.68 77(13) 1 Y NGC 5135 0.0130 1.5 0.31 2(3) 2+ Y NGC 7469 0.0170 4.0 0.41 290(12) 1 Y I 13349+2438 0.1076 16.6 2.75 57(16) 1 Y I 23060+0505 0.173 25.7 0.75 15(3) 2∗ Y I 13451+1232 0.1210 5.1 0.70 10(24) 2∗ Y I 23128-5919 0.0446 9.4 0.30 3.5(6) 2+ N MKN 266 0.0279 2.8 0.31 5.3(1) 2+ Y NGC 7674 0.029 3.2 0.70 5(3) 2+ Y
The sample is very heterogeneous, and to assess the validity of any conclusion one must consider the selection criteria of the many subsamples which were merged.
We note from Table 1 that most objects are optically classified as AGNs and some of them are among the best known and widely studied type 1 and type 2 AGNs. In fact, 46 objects out of 78 were selected by the original authors because of their well known AGN activity, irrespective of their IR properties. The remaining 32 were instead selected for observation because of their high IR luminosity (many of them are ULIGs, i.e. sources with L⊙, see Fig. 1). Nevertheless, also this second half is strongly biased toward AGN-dominated sources: many targets were selected because of the presence of some AGN indicator, such as broad lines in the polarized optical spectrum, or compact radio cores with high brightness temperature. A few objects had no AGN indicator of any sort, and were observed to assess the energy source in a “generic” LIG; they were chosen among bright IR sources without previous hard X-ray data, so they are underluminous in X rays with respect to the average LIG, and in Fig. 1 they are adiacent to well known starbursts.

In Fig. 1 we show the X-ray to IR flux ratio versus the infrared luminosity. The different codes correspond to the selection criteria which were the drivers of the X-ray observation. We note that the much discussed correlation between the IR luminosity and the occurrence of AGN activity (Sanders & Mirabel 1996, Genzel et al. 1998, Lutz et al. 1998) does not appear in Fig. 1, just because of the strong bias in favor of AGN-dominated sources discussed above. Well known AGNs and well known starbursts111 The classification of ARP 220 is ambiguous (see Smith et al. 1998, Genzel et al. 1998, Kim, Veilleux & Sanders 1998); here we have adopted the starburst classification, but moving the source to the Seyfert 2 class would not change any of our conclusions. cluster very clearly in the upper and lower half of the diagram, respectively, confirming the diagnostic value of the X-ray to IR luminosity ratio. We further note that all flavours of sources are represented in the sample, although their relative numbers are altered with respect to a proper, unbiased sample, and they are spread over a large region of the parameter space: thus the true distributions of the various observables among LIGs cannot be derived from our data set, but any correlation among these observables is likely to be real, as discussed in the following.
Finally, we note that some of the AGNs in the sample are radio loud. However, with the exception of a blazar (3C273), their radio “loudness” does not appear to introduce any anomalous behaviour, in terms of their X-ray or IR properties, with respect to the radio quiet sources (which are the great majority); this will be discussed in Sect. 3.2.
3 X and IR properties of the sample
3.1 X rays
1) X-ray absorption in AGNs The X-ray properties of our sample are extremely varied. Most of the objects optically classified as type 1 Seyferts of QSOs are bright X-ray emitters (relative to their IR luminosity), and have no signs of large absorption in their spectra (with the exception of the three Broad Absorption Line QSOs, which will be discussed later). A significant fraction of the narrow line AGNs are also relatively bright in the X rays and have spectra characterized by Compton thin absorbtion (). In other narrow line AGNs the 2–10 keV spectrum is very flat and/or the Fe line at 6.4 keV has a large equivalent width ( 1 keV); as discussed in the Introduction both these features identify reflection dominated AGNs whose direct X-ray radiation is obscured along our line of sight by Compton thick gas (). For 11 narrow line AGNs, most of which are new sources whose analysis is presented in the Appendix, there is no spectral information in the hard X-rays, and only a weak X-ray detection or an upper limit are available. In these cases either the AGN is heavily obscured (Compton thick), or it is intrinsically weak (and the IR luminosity dominated by the starburst), or a combination of the two. If the flux of the (reddening corrected) [OIII]5007 narrow line is assumed to be a fair, isotropic indicator of the intrinsic luminosity, then the ratio between the flux of this line and the observed X-ray flux provides information about the absorption affecting the nuclear X-ray source. In particular, as discussed in Bassani et al. (1999) and Maiolino et al. (1998), a flux ratio X/[OIII] lower than unity is typical of Compton thick sources. Of the 11 X-ray faint AGNs, 7 have measured [OIII] and Balmer decrement; their X/[OIII] ratio is always , and indicates that these must be Compton thick, reflection dominated sources. For the remaining 4 AGNs, no conclusion can be drawn on the X-ray absorption and luminosity.
2) X-ray spectral indices: We have studied the (instrinsic) X-ray spectral indices of a sub-sample of objects with an X/IR flux ratio higher than 10-2. As discussed in the following, this condition selects mostly broad line AGNs with no X-ray absorption or narrow line AGNs with mild X-ray absorption, so that the intrinsic spectral index can be reliably derived by correcting for the observed photoelectric cutoff. Also, we only considered sources with X-ray observations down to 0.5 keV, in order to detect possible soft thermal components, and dropped all the Narrow Line Seyfert 1s, which are known to have an intrinsic spectrum different (steeper) from “normal” Seyferts. This sub-sample was divided in two groups according to the IR colour222In this work we use an infrared colour defined as the ratio between the fluxes in the IRAS 25 m and 60m bands, that, according to Eq. 1, is given by C., C, being larger or smaller than 1.1. As shown in Fig. 2, objects with cold IR colour have an X-ray spectrum softer than usually measured in Seyfert 1s and quasars: the photon index of 6 sources out of 8 is . As for the group with warm IR colour, only 2 sources out of 14 have a photon index , while the remaining 12 have (Fig. 2).

We must caution that the data are not homogeneous: for many objects we have the result of the spectral fitting with a single powerlaw, while for others the fit includes a separate thermal component to account for the soft excess. In the latter cases we re-fitted the composite model spectra with a single powerlaw, to make the results comparable with each other. Of course our simple procedure is far from precise, and a more detailed analysis would require a new fit to the original data.
This finding on the spectral indices is relevant to the explanation we propose for the correlations of Fig. 3, and will be discussed in the next Section.
3) The BeppoSAX subsample: In the Appendix we report the analysis of 5 BeppoSAX observations of LIGs. Three of them are ULIGs with compact radio emission and brightness temperature T K, one (NGC 1073) is a Seyfert 2 with a strong [O III] emission; the last one (IRAS 00198-7926) is a Seyfert 2 with warm IR colour. In addition to these, our sample contains 8 more type 2 sources observed with BeppoSAX: IRAS 11058-1131, IRAS 22017+0319, IRAS 20210+1121, IRAS 14454-4343, studied by Ueno et al. (2000); NGC 1365 (Risaliti et al. 2000), IRAS 09104+4109 (Franceschini et al. 2000), NGC 1068 (Matt et al. 1997) and NGC 6240 (Vignati et al. 1999). The 13 sources listed above constitute a first small sample observed up to 200 keV by means of the PDS instrument. Among these sources only three, IRAS 22017+0319, NGC 1365 and NGC 6240, clearly show a direct emission, with a typical Seyfert 2 spectrum that extends from 1 to 200 keV and an absorbing column density of 4 cm-2, 4 cm-2 and 2 cm-2, respectively. The remaining 10 sources are very weak in X rays (with the exception of NGC 1068, that has a good signal-to-noise spectrum, even if it is completely Compton-thick up to 200 keV, Matt et al. 1997), and have a flat 2-10 keV spectral index (when at all constrained), all hints of heavy obscuration. For 6 out of these 10 sources we have a detection in the PDS (marginal in all objects but NGC 1068) that is consistent with the extrapolation towards higher energies of the 2-10 keV best fit. The most straightforward interpretation of these objects is that they are Compton thick and reflection–dominated even in the 10–200 keV band, which implies a column density cm-2. Alternatively, some of these AGNs might be fading and their cold reflection dominated spectrum could be the echo of their past activity, as observed in NGC 2992 (Weaver et al. 1996, Gilli et al. 2000), Mkn 3 (Iwasawa et al. 1994) and NGC 4051 (Guainazzi et al. 1998). In particular, the latter might be the case for Mkn 273. For one object, IRAS 09104+4109, a marginal detection of an excess was obtained, implying cm-2. For the remaining three sources we can only put a lower limit to of cm-2, either because the PDS upper limit is inconclusive, or because there is a confusing source in the PDS field of view.
We will discuss in Sect. 4.1 the implication of such a large number of reflection dominated sources.
3.2 X-IR colour-magnitude diagram
An infrared indicator of the presence of an AGN is the ratio between the fluxes at 25 and 60 m (see Note 1 for its definition). The 60 m emission is mainly due to reprocessing of the UV-optical radiation by dust heated at intermediate temperatures (50K), that is present both in starbursts and in the circumnuclear torus of AGNs. The 25 m emission is due to warmer dust (T 100 K) that is more abundant in the central regions of AGNs. We note that this simple scheme is altered by the obscuration thought to be present in type 2 AGNs, since the 25 m emission can be absorbed as well (assuming a Galactic dust to gas ratio, the optical depth at 25 m is for cm-2, Draine 1989). This effect will be analyzed in detail in the following Section.
In Fig. 3 we plot the X/IR flux ratio versus the 25-60 m colour333We excluded from the plot in Fig. 3 four of the objects listed in Table 1: 3C 273, whose infrared emission is known to be dominated by a blazar component, at least in outburst; and IRAS 15307+3252, PG 1148+549 and PG 1634+706, that are the only three objects with redshift as high as 1, where the K-correction could be important.. The different symbols are related to the optical classification (Seyfert 1/QSO, Seyfert 2, starburst) and to the Compton thin / Compton thick classification derived from the X-ray analysis discussed in Sect. 3.1.
A clear correlation is apparent in Fig. 3: type 1 AGNs have preferentially high X/IR ratios and warm infrared colours. Moving towards lower 25/60m ratios we find lower X/IR ratios and an increasing fraction of obscured AGNs at first, and of starbursts afterwards. Together with the correlation we note also a large scatter, which will be discussed in detail in the next Section.

The result presented in Fig. 3 is in qualitative agreement with general expectations. In addition, it poses interesting quantitative constraints on the physics of LIGs. Since the boundaries depicted in Fig. 3 are crucial for our subsequent analysis, we must: (1) check if the lack of objects with low X-ray flux and warm IR colour and/or with high X-ray flux and cold IR colour can be ascribed to the selection biases illustrated in the previous Section; (2) compare the LIGs with non-LIG sources, in order to see if the correlation of Fig. 3 is a characteristic of the former or is present in the generic hard X-ray extragalactic population.
(1) The shortage of objects in the top-left region of Fig. 3 is very likely real, since X–ray loud objects should have been detected easily. For instance, the same region is populated in Fig. 4. Concerning the lack of sources in the bottom-right part of the Figure, we have studied a sample of IR-warm LIGs not observed in X rays: from the IR colour and the IR flux we have estimated the minimum X-ray flux that a source should have in order to follow the correlation of Fig. 3. If the minimum flux were higher than -say- erg cm-2 s-1 for a significant number of sources, then we should conclude that probably these objects do not match the correlation, because it would be very improbable that such X-ray loud sources escaped detection in all previous X-ray surveys. We used to this purpose the catalog of de Grijp (1985), which is a selection of the IR-warmest sources in the IRAS Point Source Catalog. We found that for all the LIGs of this catalog not included in our sample the minimum required X-ray flux is lower than about 10-12 erg cm-2 s-1. Summarizing, there are no obvious bias effects which could ascribe the observed correlation to selection problems.
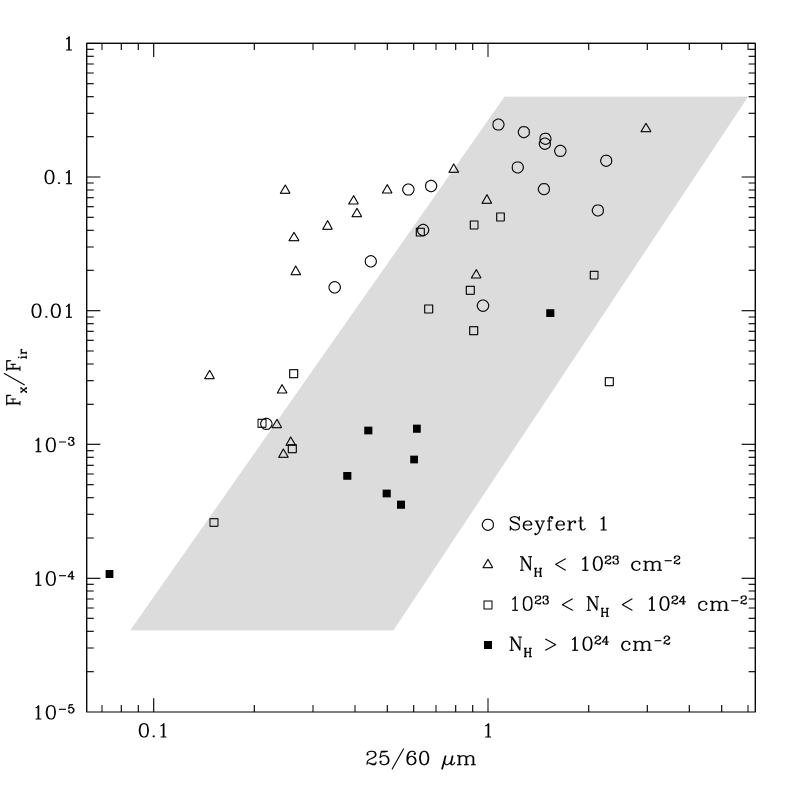
(2) The second point has been investigated by checking if a similar correlation exists also for sources with L L⊙. Our control sample of non-LIGs is composed of AGNs with hard X-ray data available in the literature. The sample is not complete neither representative of a particular class of sources, but it shows nonetheless (see Fig. 4) that the absence of strong X-ray emitters with cold IR colours is a feature typical of the LIGs. On the contrary, the lack of IR warm and X-ray weak objects could be a general property of hard X-ray sources.
Finally, we note that the radio loud (broad line) AGNs, marked with a horizontal segment in Fig. 3, do not have an anomalous behaviour with respect to type 1 radio quiet objects. Instead, the three broad absorption line (BAL) QSOs (identified with a filled circle in Fig. 3) are characterized by a low X-ray luminosity compared to the other broad line AGNs. This is a well known property of BAL QSOs and it is ascribed to absorption associated to the outflowing medium responsible for the BALs (Brandt et al. 1999, Crenshaw et al. 1999).
4 Discussion, and a basic scenario
Our approach is to compare the observed distribution of Fig. 3 with various combinations of starburst and AGN spectra, the latter absorbed according to different prescriptions.
The horizontal line in the upper part of Fig. 5 represents a model with only the AGN component: the rightmost point, at coordinates 2.1 (colour) and 0.1 (flux ratio), is a typical location for bright Seyfert 1s. This “starting point” cannot be the average of the Seyfert 1s in our sample, because some of them are contaminated by starburst activity. On the other hand, mean values of lower luminosity objects could contain a contribution from the host. We then adopted as a template the bright Seyfert 1 IC4329A, that is not a LIG, but has an infrared luminosity ( 1010L⊙) significantly higher than normal galactic values, no indication of starburst activity and a well studied, warm IR spectrum. The X-ray source is modelled as a powerlaw with photon index , and the absorbing material –covering the X-ray source in the same way as the infrared source– is assumed to have a Galactic dust–to–gas ratio and extinction curve. In the infrared, only the 25m flux is affected by the absorption, while the 60m flux and the bolometric flux remain constant.
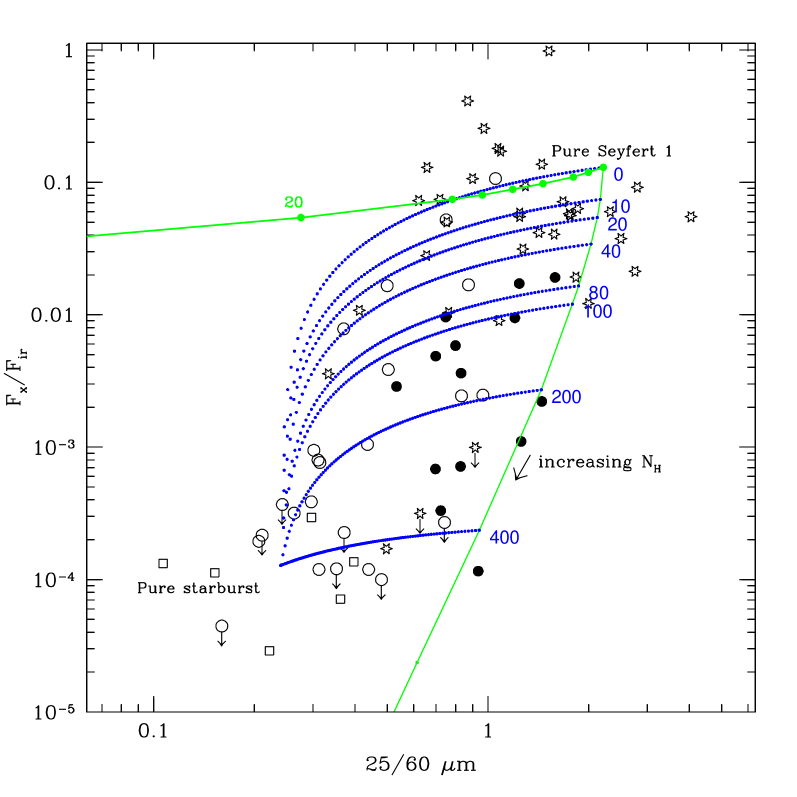
The model is obviously incorrect, and does not fit the observed trend even for those many objects that are known to be dominated by the AGN component. The prediction is a fast decrease of the colour parameter at an almost constant X/IR flux ratio, whereas the data show that the two quantities decline together. To decrease the X-ray flux by an amount comparable to the 25m flux, the absorbing material must have properties different from the Galactic gas, or it must be distributed differently against the X-ray and the IR sources.
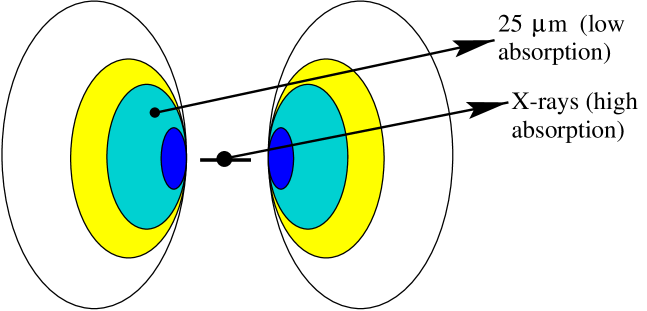
The warm dust emitting the bulk of the 25 m emission is located at several pc from the nuclear source and therefore suffers a much lower absorption than the nuclear X-ray source. This might explain the discrepancy between model and data. In a scenario like that of Fig. 6, if the medium-IR source is at a fixed height above the plane, one could crudely assume that it sees a fixed small fraction of the absorption seen by the X-ray source, for a substantial range of inclination angles.
| (2) |
where k is a constant. We have adopted a Galactic gas–to–dust ratio and changed the IR absorption with respect to the X-ray one, but we could have taken an identical toward both sources and a lower . Then the constant k in the equation above, which in our model is a geometrical factor, would represent the correction to the dust–to–gas ratio.
The oblique rightmost line in Fig. 5 represents the double absorber, AGN dominated model described in Fig. 6. The NH values indicated by the labels refer to the X-ray absorption, while the parameter k was adjusted (k ) to fit the boundary of the populated region. In order to add a starburst component, we took the average colour and X/IR flux ratio of the six starburst-dominated sources in our sample, since in these cases the possible contamination from additional components (such as a very obscured AGN) should be negligible. The dotted curves give different degrees of mixing, starting from the right with objects 100% dominated by a more or less absorbed AGN.
In summary, the position of an object along the main extension ( vertical) of the plot is a measure of the amount of absorption incurred by the AGN component, while the position across the plot, along the horizontal direction, is a measure of the amount of mixing with a starburst component.
This interpretation is supported by the optical identifications. However, there are some further points which support the proposed picture: 1) According to our scheme, the type 2 sources having the warmest IR colour allowed by their X/IR flux ratio are dominated by the AGN component, with low absorption on large scales. Therefore we expect to find broad polarized or near-IR broad lines more often in these objects than in colder ones (see also Heisler, Lumsden & Bailey 1997). In objects with colder IR colors the starburst is more and more important, and the AGN lines could be diluted by the radiation contributed by the starburst, or suppressed by the large scale absorption associated with it. There are only a few type 2 sources with the required data (spectropolarimetry and/or near-IR spectra), but those with broad polarized or near-IR broad lines all lie along the AGN locus in Fig. 5, as expected.
2) The X-ray signature of the starburst contribution is a thermal component with typical kT values of 0.1-3 keV. Therefore, in this case, the overall X-ray spectrum should be steeper, and the fit with a single powerlaw should give a photon index larger than in typical AGNs, say . The evidence presented in Fig. 2 goes exactly in this direction: the large majority of the IR-cold sources have steep (starburst-like) X-ray indices while IR-warm sources have flatter (AGN-like) indices.
Our model seems to provide a qualitative explanation for several observed trends. However, the Sy1s located above and to the right of the “starting point” of Fig. 5 give an idea of the intrinsic spread of these two quantities; the spread is comparable to the horizontal width of the plot, and indicates that care must be exercised in drawing strong conclusions from the IR colour.
4.1 Non-detections at E 20 keV
In Sect. 3.1 we briefly presented a subsample of 13 LIGs with observations up to 200 keV, provided by the PDS onboard BeppoSAX. Observations at several tens of keV allow the exploration of the range 1024 cm cm-2, since these column densities suppress completely the direct radiation up to about 10 keV, but become translucent at higher energies. Well known examples are NGC 4945 (Done et al. 1996) and the Circinus galaxy (Matt et al. 1999). A significant lack of objects with 1024 cm cm-2 was already pointed out in a sample of optically selected Seyfert 2s (Risaliti et al. 1999). Here we seem to find the same result for the LIGs: among all sources obscured between 2 and 10 keV, and having PDS observations, 6 are reflection dominated up to 100 keV, implying an cm-2 (or, alternatively, a fading nucleus); only one has 1024 cm cm-2, while for the others no firm conclusion can be drawn.
This finding, if confirmed for a larger and well selected sample, would have important consequences in the synthesis models of the X-ray background. If a large fraction of sources are reflection dominated up to 100 keV, the integrated flux of the absorbed AGNs is dimmed and they are on average less detectable at a given flux. Therefore, the ratio between absorbed and unabsorbed AGNs should be increased with respect to the local value to account for the hard XRB intensity and hard X-ray source counts (Gilli et al. 1999).
4.2 An unbiased sample of LIGs
As we already discussed in Sect. 2, the sample studied in this paper is heterogeneous and incomplete. However, since it contains all the X-ray data currently available, we can extract from it the least biased subsample that it is possible to assemble at present. To do this, we ordered the LIGs of the Bright Galaxy Sample (BGS, Soifer et al. 1987, Sanders et al. 1995) according to their total infrared flux, and selected the first of them so as to maximize the fraction of objects with hard X-ray data. It is worth noting that by selecting in total IR flux we remove a bias that affects the BGS catalogue (and any randomly selected subsample). In fact the BGS is flux-limited at 60m and therefore the effective cut in terms of total IR flux is higher for the AGNs (which on average have a lower fraction of the IR luminosity emitted at 60m) than for the starbursts (which have the peak of their emission at 60 m). The magnitude of the effect can be estimated by using the sources listed in Table 1 and the equation quoted in Sect. 2: we find that the fraction of the IR flux emitted at 60m is 50-55% for the starbursts and 15-20% for the IR-warmest AGNs. So, in order to eliminate the bias, one has to remain a factor of at least above the limit of the parent catalog.
The number of objects included in the subsample is 23, which corresponds to a limiting total IR flux of 1.6 10-9 erg cm-2 s-1. In this way the fraction of X-ray observed sources is highest (15 out of 23, i.e. 65%) and the lowest value of the 60m flux density is 15.5 Jy, indeed a factor higher than the limiting flux of the BGS (5.24 Jy). The sources are listed in Table 2.
NAME F X-ray2 Class.3 NGC 1068 29 Y AGN NGC 3690 11 Y ST. NGC 1365 9.9 Y AGN NGC 3256 9.1 Y ST. ARP 220 7.7 Y ST. NGC 1614 3.3 Y AGN IRAS 18293-3413 3.2 Y AGN NGC 7469 2.7 Y AGN ESO 320-G030 2.7 N AGN MKN 231 3.1 Y AGN IRAS 17208-0014 2.5 Y ST. IC 1623 2.1 N ST. MCG+12-02-001 2.1 N ST. IC 5179 2.1 N ST. IC 4687 2.1 N ST. NGC 2369 2.1 N ST. NGC 6240 2.0 Y AGN NGC 7771 2.0 N ST. NGC 2623 1.8 Y AGN NGC 5135 1.7 Y AGN MKN 273 1.7 Y AGN ZW 049.057 1.6 N AGN NGC 7130 1.6 Y AGN
Although a complete statistical study of their properties is at present impossible because of the lack of X-ray data for 8 sources, we can nonetheless draw some preliminary conclusions. According to the optical classification, 5 of the 15 X-ray observed sources are starbursts, while the remaining 10 are AGNs. Among the latter, 6 are Compton–thick and only one (NGC 1365) is Compton–thin with a column density cm-2. In three sources, the AGN seen in the optical is completely invisible in the X rays. Finally, the 25/60 m flux ratio is generally low, and indicates that the emission of the warm dust associated with the AGN is either low compared with the starburst 60m emission, or absorbed.
The statement we can make is that the AGNs are rather common among the luminous infrared galaxies (13 out of 23 in the whole sample), but their contribution to the bolometric luminosity is not easy to assess. The AGN could provide the higher fraction of the energy only if its direct emission were entirely reprocessed; alternatively, the contribution of the starburst could be important or even dominant.
5 Conclusions
This paper deals with the sample of luminous infrared galaxies (LIGs) observed to date in hard X rays (2-10 keV). The sample is affected by a selection bias in favor of AGN-dominated sources, nevertheless it covers a region of the parameter space large enough to allow some general conclusions. For a significant fraction of the sample (15/78) hard X-ray data are analyzed and published for the first time.
The main results of our work can be summarized as follows:
1) The X-ray properties of the LIGs are very different from source to source: the X-ray brightest objects are Seyfert 1 and low–absorption Seyfert 2 galaxies, with a X/IR flux ratio as high as 0.1-0.2. At the opposite extreme are the starburst dominated objects, for which the X/IR flux ratio is or lower. Interestingly, we note that a significant fraction of the sources optically classified as AGNs do not show any indication of nuclear activity in X rays. Thus, either the AGN contribution is negligible, or the direct emission must be absorbed by a column density cm-2.
2) A subsample of 13 LIGs was observed up to 200 keV. Six out of 11 sources that are Compton–thick in the 2-10 keV range are reflection dominated also from 10 to 200 keV, thus implying a column density cm-2 (or, alternatively, a fading nucleus). Only two have an excess in the 15-100 keV range, while for the last three the hard 15-100 keV X-ray emission remains unconstrained. This result is somewhat puzzling, for the 10 cm-2 interval of column density appears to be underpopulated both for the LIGs and the non-LIG local Seyfert 2 galaxies.
3) The shape of the correlation between the X/IR flux ratio and the 25/60 m IR colour suggests that the 25m emission is absorbed by a lower column density than the X-ray emission or, alternatively, that the absorbing material has a dust–to–gas ratio lower than Galactic.
The X-IR correlation is well reproduced by a model in which both AGNs and starbursts contribute to the total emission. The differences in the IR colours are mainly due to the different contribution of the starburst component, while the X/IR flux ratio is mainly determined by the amount of absorption affecting the AGN.
Additional evidence in support of the model is the detection of broad optical polarized or infrared lines only in the IR-warmest sources (where we see directly the inner region of the torus), and the steepness of the X-ray spectra of the IR-colder objects (where the starburst contributes strongly).
4) Finally, we assembled an unbiased sample of LIGs from the BGS catalog, in a way which maximizes the fraction of sources with hard X-ray data available (15 out of 23, i.e. 65%). The sample is limited in total IRAS flux (i.e. from 12m to 100m). This selection criterion removes a bias against AGNs present in most other LIG samples that, instead, are limited in the 60m flux. From the optical classification and from the IR and X-ray data we find that AGNs are common among the LIGs (13 out of 23 host an active nucleus) but they are either weak or heavily obscured.
Acknowledgements.
Three of us (RG, RM and MS) were supported in part by the Italian Ministry for University and Research (MURST) through grant Cofin 98-02-32. The detailed comments of the referee, K. Iwasawa, have greatly improved the presentation.Appendix A Unpublished sources
We present here a brief discussion of the X-ray data of 15 sources of our sample for which no information is available in the literature. Among the 10 sources observed by ASCA, only 3 (TOL 1351-375, IRAS 05189-2524 and MKN 1048) have a good signal-to-noise. For them a detailed study is possible, and the main spectral parameters can be determined. The remaining 7 sources (3 classified as starbursts and 4 as AGNs) have detections at a few sigmas and therefore we can only estimate a flux and sometimes a photon index. The 5 sources observed by BeppoSAX are all very faint in the X-rays, and for 4 of them the X-ray observation does not provide any firm indication of the presence of an AGN. For the fifth object, MKN 266, the detection of a cold iron line and the flatness of the spectrum suggest the presence of a heavily obscured AGN. All the errors quoted are at the 90% level of confidence.
a) Sources from the ASCA public archive: We have reduced and analyzed the ASCA GIS observations of 11 sources. All the data have been retrieved from the ASCA public archive. IRAS 03158+4227: The GIS data of IRAS 03158+4227 give a detection at a low signal–to–noise level (). The spectrum is well fitted by a powerlaw with . The 2-10 keV flux is F=5.4 erg cm-2 s-1. There is no evidence of the iron line, and the steepness of the spectrum suggests a thermal origin of the observed emission. IRAS 03158+4227 is classified optically as Seyfert 2, therefore it should host an AGN. From the low X-ray luminosity, relative to the infrared emission, and from the absence of AGN indicators in the X rays we deduce that the AGN is obscured by a column density cm-2. IRAS 07598+6508: The source IRAS 07598+6508 has not been detected in the GIS observation with an exposure time of 83500 sec. We can only derive an upper limit to the 2-10 keV flux, FMAX=8 10-14 erg cm-2 s-1 (at a 90% confidence level). IRAS 17208-0014: The source IRAS 17208-0014 is marginally detected in the GIS. The flux we derive is F=3 erg cm-2 s-1. TOL 1351-375: TOL 1351-375 is a Seyfert 1.9 galaxy observed by ASCA in 1997. The spectrum obtained after the standard data reduction has a good signal-to-noise and has been fitted with a multi-component model consisting of an absorbed powerlaw, an iron Kα line and a thermal component with kT1.2 keV. The best fit gives the following values: photon index ; absorbing column density cm-2; rest frame line energy E=6.38 keV; line equivalent width EW=175120 eV. The measured 2-10 keV flux is 3.8 erg cm-2 s-1. IRAS 18293-3413: This source has been detected at a 5 level. There is no evidence of an AGN contribution. Fitting the data with a blackbody we obtain kT=0.85 keV. The 2-10 keV flux is 9 erg cm-2 s-1. NGC 1614: The spectrum of NGC 1614 is well fitted by a powerlaw with , while a termal component is rejected. There is no evidence of an iron line. The measured 2-10 keV flux is 5.6 erg cm-2 s-1. IRAS 05189-2524: This source was observed by ASCA for 40000 seconds. The spectrum is well fitted by a two-component model, consisting of a powerlaw with photon index absorbed by a column density of cm-2, and a thermal component with kT=0.88. The iron line is not detected. From the non-detection we estimate an upper limit to the equivalent width of 235 eV. The measured 2-10 keV flux is 5.3 erg cm-2 s-1. In summary, the E keV spectrum is typical of a Compton–thin type 2 AGN, while at lower energies an extra thermal component is present, that can be either associated to the AGN itself or due to starburst activity. NGC 7212: The Seyfert 2 galaxy NGC 7212 has a flat 0.5-10 keV spectrum, well fitted by a powerlaw with photon index . An emission line with peak energy E=6.06 (compatible with a Kα iron line at a confidence level of 90%) is detected at a 2 level, with a best fit equivalent width EW=1.0 keV. From these spectral features we deduce that the source is Compton-thick. The measured 2-10 keV flux is F=9.8 erg cm-2 s-1. MKN 1048: The GIS spectrum of MKN 1048 is well fitted by a simple powerlaw with photon index , a value significantly lower than the average photon index found in the X-ray spectra of quasars. The Kα iron line is marginally detected, at a 2 level (best fit equivalent width EW=96 eV. The measured 2-10 keV flux is F=9.9 erg cm-2 s-1. WAS 49b The Seyfert 2 galaxy WAS 49b presents a very unusual X-ray spectrum. A good analytical fit is provided by a single powerlaw with photon index , a very low value typical of reflection-dominated spectra. In contrast with this interpretation, the iron line is only marginally detected with an equivalent width EW eV and the 2-10 keV flux is relatively high with respect to the infrared emission (F erg cm-2 s-1), thus indicating that the source is Compton - thin. A similar good fit is obtained by a model composed by a powerlaw with absorbed by a column density cm-2 and a flat () powerlaw with a 1 keV normalization equal to 1/6 that of the first component. Since WAS 49b is part of a triple sistem, we suggest that this flat contribution is due to the diffuse emission of the hot intra-cluster gas.
b) Sources observed with BeppoSAX: MKN 273: MKN 273 was observed with BeppoSAX in 1998 and was detected by the MECS (1.65-10 keV) at a 2-10 keV flux of 3.5 erg cm-2 s-1, significantly lower than the flux measured by ASCA 2 years before (F erg cm-2 s-1, Iwasawa 1998). Fitting the data with a powerlaw and an iron line we obtain a spectral index (, poorly constrained due to the weakness of the continuum, and a marginal detection of the iron line, at a 3 level (best fit equivalent width EW=1.2 keV). The detection in the PDS is also weak. We conclude that either the AGN at the centre of this source is absorbed by a column density cm-2 or, alternatively, that the central source has faded and only the reflected component is now visible (this would also explain the flux decrease between the ASCA and SAX observations). MKN 266: MKN 266 was detected by the MECS and marginally (at a 2 level) by the PDS. The 2-10 keV spectrum is remarkably flat (photon index ) suggesting the presence of a heavily obscured AGN. The iron line is detected at a 90% confidence level, with a best fit equivalent width of 575 eV. The absence of any excess in the PDS is an indication of a column density higher than 1025 cm-2. The measured 2-10 keV flux is 5.6 erg cm-2 s-1. NGC 2623: NGC 2623 was detected by the MECS at 3.5, thus we can only estimate the 2-10 keV flux, F erg cm-2 s-1. The detection in the PDS is weak and cannot be associated with certainty to NGC 2623, because of the presence in the PDS field () of another source that could emit in the hard X rays. MKN 1073: MKN 1073 was not detected by the MECS and therefore we can only estimate an upper limit to the 2-10 keV flux, F erg cm-2 s-1. The signal in the PDS is very high, with an exceptionally steep spectrum (), but it is probably emitted by an unidentified source in a nearby cluster, that has a strong emission in the 2-10 keV band as well. IRAS 00198-7926 The source IRAS 00198-7926 was observed by the BeppoSAX instruments for 20000 seconds and was not detected. From this non-detection we estimate an upper limit to the 2-10 keV flux, F erg cm-2 s-1.
References
- (1) Awaki H., Koyama K., Inoue H., Halpern J.P., 1991, PASJ 43, 195
- (2) Bassani L., Dadina M., Maiolino R. et al., 1999, ApJ 121, 473
- (3) Brandt W. N., Fabian A. C., Takahashi K. et al., 1997, MNRAS 290, 617
- (4) Brandt W. N., Laor A., Wills B. J., 2000, ApJ 528,637
- (5) Cappi M., Matsuoka M., Otani C., Leighly K. M., 1998, PASJ 50, 213
- (6) Cappi M., Persic M., Bassani L. et al., 1999, A&A 350, 777
- (7) Crenshaw D., Kraemer S. B., Boggess A. et al. 1999, ApJ 516, 750
- (8) Done C., Madejski G. M., Smith, D. A., 1996, ApJ 463, L63
- (9) Draine B.T., 1989, Proc. 22nd ESLAB Symp. on IR Spectroscopy in Astronomy, B.H. Kaldeich ed., ESA SP-290, 93
- (10) Franceschini A., Bassani L., Cappi M. et al., 2000, A&A in press (astro-ph 9912127)
- (11) Genzel R., Lutz D., Sturm E. et al., 1998, ApJ 498, 579
- (12) George I. M., Turner T. J., Yaqoob T. et al., 2000, ApJ, in press (astro-ph 9910218)
- (13) Ghosh K. K., Soundararajaperumal S., 1992, PASP 104, 258
- (14) Gilli R., Maiolino R., Marconi A. et al. 2000, A&A, accepted, (astro-ph 0001107)
- (15) Gilli R., Risaliti G., Salvati M., 1999, A&A, 347, 424
- (16) Guainazzi M., Nicastro F., Fiore F. et al. 1998, MNRAS 301, L1
- (17) Heisler C. A., Lumsden S. L., Bailey J. A., 1997, Nat 385, 700.
- (18) Imanishi M., Ueno S., 1999, ApJ 527, 709
- (19) Iwasawa K., Yaqoob T., Awaki H., Ogasaka Y., 1994, PASJ 46, L167
- (20) Iwasawa K., 1999, MNRAS 302, 96
- (21) Kim D. C., Veilleux S., Sanders D. B., 1998, ApJ 508, 627
- (22) Lawson A. J., Turner M. L., 1997, MNRAS 288, 920
- (23) Leighly K. M., 2000, ApJS, in press, (astro-ph 9907295)
- (24) Lutz D., Spoon H. W. W., Rigopoulou D., Moorwood A. F. M., Genzel R., 1998, ApJ 505, L103
- (25) Maiolino R., Salvati M., Bassani L. et al., 1998, A&A 338, 781
- (26) Matt G., Guainazzi M., Frontera F. et al., 1997, A&A 325, L13.
- (27) Misaki K., Iwasawa K., Taniguchi Y. et al., 1999, Adv. Space Res., 23, 1051
- (28) Moran E. C., Lehnert M. D., Helfand D. J., 1999, ApJ 526, 649
- (29) Nandra K., Fabian A. C., Brandt W. N. et al., 1995, MNRAS 276, 1
- (30) Ogasaka Y., Inoue H., Brandt W. N. et al., 1997, PASJ 49, 179
- (31) Persic M., Mariani S., Cappi M. et al., 1998, A&A 339, L33
- (32) Reynolds C. S., 1997, MNRAS 286,513
- (33) Risaliti G., Maiolino R., Bassani L., 2000, A&A, accepted (astro-ph 0002169)
- (34) Risaliti G., Maiolino R., Salvati M., 1999, ApJ 522, 157
- (35) Sambruna R., George I. M., Mushotsky R. F., Turner T. J., 1998, ApJ 495, 749
- (36) Sanders D. B., Egami E., Lipari S., Mirabel I. F., Soifer B. T., 1995, AJ 110, 1993
- (37) Sanders D. B., Mirabel I. F., 1996, ARA$A 34, 749
- (38) Smith H. E., Lonsdale C. J., Lonsdale C. J., Diamond P. J., 1998, ApJ 493, 17
- (39) Soifer B. T., Sanders D. B., Madore B. F. et al., 1987, ApJ 320, 238
- (40) Turner T. J., Pounds K. A., 1989, MNRAS 240, 833
- (41) Ueno S., 1997, PhD thesis, University of Kyoto
- (42) Ueno S., Ward M. J., O’Brien P. T., Stirpe G. M., Matt G., 2000, Adv. Sp. Res., in press
- (43) Vaughan S., Reeves J., Warwick R., Edelson R., 1999, MNRAS, 309, 113
- (44) Vignati P., Molendi S., Matt G. et al., 1999, A&A 349, L57
- (45) Weaver K. A., Nousek J., Yaqoob T. et al., 1996, ApJ 458, 160
- (46) Zezas A., Alonso-Herrero A., Ward M. J., 2000, Ap& SS, in press (astro-ph 9907147)