VLBI differential astrometry at 43 GHz
Abstract
From 43 GHz VLBA observations of the pair of radio sources QSO 1928+738 and BL 2007+777 we have demonstrated the feasibility of precision phase-delay differential astrometric techniques at millimeter wavelengths. For a pair of sources with 5° separation and high antenna elevations, we have shown that present astrometric models and millimeter arrays are advanced enough to model the differential phase-delay to within 2 picoseconds, less than one tenth of a phase-cycle at 43 GHz. The root-mean-square of the differential phase-delay residuals is dominated by the fluctuations of the atmospheric water vapor. We have determined the relative position of the observed sources with a precision twofold better than previous determinations at lower frequencies and, more importantly, largely free from ambiguous definitions of the reference point on the structure of the radio sources. Our result makes 43 GHz VLBI phase-delay differential astrometry an ideal tool to study the absolute kinematics of the highly variable structures of regions near the core of extragalactic radio sources.
Key Words.:
astrometry – techniques: interferometric – quasars: individual: QSO 1928+738 – BL Lacertae object: individual: BL 2007+7771 Introduction
One of the trends in Very-Long-Baseline Interferometry (VLBI) is to augment the angular
resolution of the observations in search for a more detailed
view of the inner structure of extragalactic radio sources.
This is effectively carried out by either observing at millimeter wavelengths
(mm-VLBI) or, at cm-wavelengths, by combining ground telescopes with antennas
in space. The correct interpretation of these high-resolution observations is
of much relevance
since they map the morphology of highly variable regions close to the
central engine of AGNs. However, multi-epoch analyses directed
to understand the dynamical behavior of these inner
regions critically depend on the alignment of the images: no solid
conclusions can be extracted without an accurate source component (i.e. core)
identification. In particular, VLBI reveals that cm-wavelength components
break up in complex structures with multiple features at mm-wavelengths.
These compact mm-features
show a strong variability, which may be the result of phenomena only seen so far in
numerical simulations (Gómez et al. 1995).
For a meaningful physical understanding of those compact features, a detailed
knowledge of the (absolute) kinematics
of the region is crucial. It is therefore highly desirable to extend
precision differential phase-delay
astrometry to mm-wavelengths.
In this Letter we demonstrate the feasibility of using phase-delay differential
astrometry at 43 GHz. We have selected the pair of sources QSO 1928+738 and
BL 2007+777, 5° apart, with flat spectra, high flux densities, and
rich structures at 43 GHz. The astrometry analysis of these data show
the advantages and possibilities of mm-wavelength differential astrometry.
2 Observations and Maps
We observed the radio sources QSO 1928+738 and BL 2007+777 at 43 GHz on 1999
January 3 from 15:00 to 23:30 UT. We used the complete Very Long Baseline
Array (VLBA) recording in mode 256-8-2 in left circular polarization to
achieve a recording bandwidth of 64 MHz.
We interleaved
observations of QSO 1928+738 and BL 2007+777 using integration times between
40 and 130 seconds on each source to make total cycle time durations
between 110 and 300 seconds (antenna slew time was 15 seconds).
The data were correlated at the National Radio Astronomy Observatory
(NRAO, Socorro, NM, USA). Detections were found on both sources to all
stations but Hancock, presumably due to severe weather conditions at this site.
We made manual phase calibration, visibility amplitude
calibration (using system temperatures and gain curves from each antenna),
and fringe fitting at
the correlation position with the NRAO Astronomical Image Processing
System (AIPS).
For astrometric purposes, we further processed the data in AIPS
(tasks mbdly and cl2hf) to obtain, for
each baseline and epoch, estimates of the group delay, phase-delay rate, and
fringe phase at a reference frequency of 43,185 MHz.
We discarded data from Saint Croix and
Pie Town stations, which showed unacceptable scatter in the observables, for the
astrometric analysis presented in Sect. 3.
For mapping purposes, we transferred the data into the Caltech imaging
program difmap (Shepherd et al. 1995). We performed several iterations of
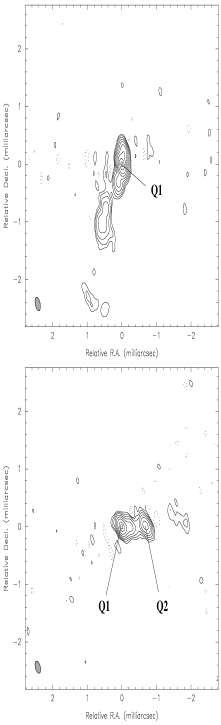
self-calibration in phase and gain. We present the resulting hybrid maps in Fig. 1.
The 43 GHz map of QSO 1928+738 displays several
jet components extending southwards. All these features appear blended together
as only one or two components in previous maps at cm-wavelengths (Guirado et al. 1995,
hereafter G95; Ros et al. 1999, hereafter R99), and those obtained with space VLBI
(Murphy et al. 1999).
The brightest knot, labeled as Q1, is probably a jet component, unless the
source is two-sided, but it is compact and well defined. Thus, it constitutes
an appropriate reference point for relative astrometry at a
single epoch. However, this component would not be a suitable reference point
for a multi-epoch comparison of the relative separation between the two
sources as it is likely to move and evolve in brightness and shape
over time.
The 43 GHz map of BL 2007+777 represents a significant improvement in the
knowledge of the inner structure
of this source (see Fig. 1). The brightest knot seen earlier at cm-wavelengths
(Guirado et al. 1998, hereafter G98; R99) breaks-up in at least three new features.
The kinematic nature of component Q2, almost
as bright as the easternmost component Q1,
is of much interest. The brightest feature of BL 2007+777 at cm-wavelengths,
a blending of all components seen within 1 mas from the origin in our 43 GHz map,
has been taken as a reference point for astrometry (G95; G98; R99); even more,
this feature has been considered stationary for
multi-epoch astrometry analyses. Accordingly, should component Q2 be a
travelling knot, the selected reference point at cm-wavelengths is likely
to be not stable over time and part of previous astrometry results must
be revised.
3 Astrometry Analysis
A goal of this research has been to calibrate the limitations of our standard astrometry procedure for 43 GHz, as well as to study the potential precision of the astrometric data at this frequency. Therefore, the data-reduction procedure for the 43 GHz observation deliberately followed the same steps as those used for the 5 GHz (G95) or 8.4 GHz observations (G98; R99). We briefly go again over each step of this analysis: For our 43 GHz data, (i) we predicted, via a precise theoretical model of the geometry of the array and the propagation medium, the number of cycles of phase between consecutive observations of the same source to permit us to “connect” the phase delay (e.g. Shapiro et al. 1979; G95; R99); (ii) we defined as reference points in the 43 GHz images of the two radio sources the maximum of the brightness distribution (components Q1 in the maps of QSO 1928+738 and BL 2007+777; see Fig. 1) and subtract the contribution of the structure of the radiosources, with respect to the reference points selected, from the phase delays; (iii) we formed the differenced phase delays by subtracting the residual (observed minus theoretical values) phase delay of BL 2007+777 from the previous observation of QSO 1928+738; and (iv) we estimated the relative position of the reference points from a weighted-least-squares analysis of the differenced residual phase delays. For this analysis we used an improved version of the program VLBI3 (Robertson 1975).
In step (i), the geometry of our theoretical model (set of antenna coordinates, Earth-orientation parameters, and source coordinates) was consistently taken from IERS (IERS 1998 Annual Report, 1999). The theoretical model also accounted for the effect of the propagation medium in the astrometric observables. We modeled the ionospheric delay by using total electron contect (TEC) data from GPS-based global ionospheric maps generated at the epoch of our observations by the Center for Orbit Determination in Europe (Schaer et al. 1998). We followed the geometric corrections described in Klobuchar (1975) and Ros et al. (2000). We modeled the tropospheric zenith delay at each station as a piecewise-linear function characterized by values specified at epochs one hour apart. We calculated a priori values at these nodes from local surface temperature, pressure, and humidity, based on the model of Saastamoinen (1973). The antenna elevations were always higher than 20° at all stations; this allowed us to use the dry and wet Chao mapping functions (Chao 1974) to determine the tropospheric delay at non-zenith elevations for each observation at each site. We estimated the tropospheric zenith delay at the nodes of each station, along with the relative position of the sources, from a weighted-least-squares analysis.
4 Results and Discussion
| Effect | Standard | |||
|---|---|---|---|---|
| Deviationa | (s) | (as) | ||
| Statistical errorsc | – | 4 | 25 | |
| Ref. point identification | – | 0.6 | 1 | |
| Station coordinates | 2 cm | 6 | 25 | |
| Coordinates | 100 s | 23 | 41 | |
| of BL 2007+777: | 300 as | 9 | 9 | |
| Earth’s pole: | 150 as | 2 | 9 | |
| 250 as | 2 | 4 | ||
| UT1-UTC | 15 s | 3 | 5 | |
| Earth’s nutation: | 170 as | 0.3 | 1 | |
| 80 as | 1 | 2 | ||
| Ionosphered | 1 TECU | 1 | 2 | |
| rsse | 26 | 56 |
a The standard deviation of the fixed geometrical parameters of our astrometric model
(all entries but ionosphere)
were taken from IERS Annual Report 1998 (1999). The 2 cm standard deviation of the site coordinates
corresponds to each of the three coordinates for each antenna site.
b Notice that the values of are in s. To convert s to as, the factor
15 (4.2 ) must be used.
c The statistical errors include the uncertainties of the tropospheric zenith delays at the nodes of
the piecewise linear function used in the troposphere model (see Sect. 2).
d Standard deviation provided by the global ionospheric maps at each site. 1 TECU = 11016 el m-2.
e Root-sum-square of the tabulated values.
From the astrometric analysis described in Sect. 3, we obtain the following
J2000.0 coordinates of QSO 1928+738 minus those of BL 2007+777 at 43 GHz:
where the quoted uncertainties are overall standard errors (see Table 1), nearly twofold smaller than the standard errors corresponding to previous determinations at 5 and 8.4 GHz. From the comparison of the results of the sensitivity analysis displayed in Table 1 with similar sensitivity analyses at lower frequencies (G95; R99), we see that the improvement in precision comes from (i) the small contribution to the standard errors of the reference point identification in the map (dominated by image noise), as a consequence of the improvement of resolution of the maps and of the lack of ambiguity in selecting the components acting as reference, and (ii) the negligible contribution of the ionosphere, that scales down by a factor of 25 with respect to its contribution at 8.4 GHz. As occurs at cm-wavelengths, the quoted standard errors of the relative position are dominated by the uncertainties of the fixed parameters of the astrometric model (entries 3 to 10 of Table 1), and, in particular, by the uncertainties of the coordinates of the reference source, as expected for objects with a large angular separation (notice that this error is not frequency dependent). The comparison and interpretation of the relative position estimate at 43 GHz with previously reported estimates at lower frequencies will be postponed to a later publication where the comparison will be made in great detail.
The postfit residuals of the differenced phase delays corresponding
to all baselines included in our analysis are shown in Fig. 2. Note the scale
of the plots, 23 ps, corresponding to 1 phase cycle. The average
root-mean-square (rms) of the postfit residuals is 2 ps, less than one tenth of
the phase cycle at 43 GHz. At this level of
precision, the absence of systematic effects validates both the
astrometric model, based on IERS
standards, and the propagation medium procedures for mm-wavelength VLBI astrometry
(at least for cycle times, source
separations, weather conditions, and antenna elevations similar to those presented
in this paper). To calibrate
the quality of our procedure, we compared the residual
of the differenced phase delay with similar
residuals corresponding to observations at 8.4 GHz and 5 GHz
made in the past (G95, G98). The rms of
the residuals are about 15, 9, and 2 ps for the data sets at 5, 8.4, and 43 GHz,
respectively, which expressed in equivalent-phase yield
postfit residuals of roughly 30 degrees at each of the three frequencies.
This similarity of the rms expressed in phase at all the observed frequencies
demonstrates not only that the phase connection process is feasible at 43 GHz,
but which is also of no less quality than at lower frequencies.
Likely, the most important contributors to the scatter of the phases at 43 GHz
are the unmodeled variations of the refractivity of the neutral atmosphere.
From the average rms of 2 ps of the phase residuals of Fig. 2, and assuming
uncorrelated contributions from the antennas forming each interferometric
pair, the average uncertainty for the single-site phase delay
is ps. This uncertainty is in good agreement with
the predictions of water vapor fluctuations on time scales of
100 seconds (2 ps) based on refractivity patterns
described by Kolmogorov turbulences (Treuhaft & Lanyi 1987).
The importance of our result translates to VLBI phase-referencing mapping.
This technique (see e.g. Lestrade et al. 1990) relies completely on the behavior
of the phase of the reference source (usually a strong radio emitter) to
predict the phase of the target source (usually a weak radio emitter).
Beasley & Conway (1995) provide useful expressions for the maximum cycle time
for phase-referencing with the VLBA. Under good weather conditions, average
antenna elevation of 40°, and with the requirement that the rms phase between scans is
90°, the maximum cycle time at 43 GHz is 100s. This estimate
should be shortened if atmospheric spatial variations from different lines of
sight are considered. Actually, the facts are more favorable.
For sources separated 5° on the sky, high antenna elevations, and good
weather conditions, our results show that
(i) the rms of the phases is below 90° throughout the experiment and
does not seem to be substantially
dependent of the cycle times used during our observation (100-300s); and
(ii) the expected average uncertainty in interpolating the phases of one source to
the epoch of the other is 30° in the differenced phase. This value
is not larger than usual
phase errors in phase-reference mapping at cm-wavelengths (e.g. Lestrade et al. 1990).
Therefore, with the proper cycle times and nearby calibrator sources, diffraction
limited VLBI phase-reference images at 43 GHz should be possible.

Our observations have shown that VLBI differential astrometry at 43 GHz provides high-precision relative positions. At this frequency, the astrometric precision is nearly equivalent to the resolution of the maps, and the reference point selected in the source structure might be associated with the core. This makes 43 GHz differential astrometry an ideal technique to trace unambiguously the kinematics of the inner regions of the extragalactic radiosources.
Acknowledgements.
We thank Patrick Charlot for a constructive refereeing of the paper and Walter Alef for his valuable comments. We thank Jon Romney for his efforts during the correlation. This work has been supported by the Spanish DGICYT grant PB96-0782. The National Radio Astronomy Observatory is operated by Associated Universities Inc., under a cooperative agreement with the National Science Fundation.References
- (1) Beasley A.J., Conway J.E., 1995, In: Zensus J.A., Diamond P.J., Napier P.J. (eds.), Very Long Baseline Interferometry and the VLBA, ASP Conference Series 82, San Francisco, CA, USA, p. 327
- (2) Chao C.C., 1974, JPL/NASA Tech. Rep. No. 32-1587, 61
- (3) Gómez J.L., Martí J.M., Marscher, A.P., et al., 1995, ApJ 449, L19
- (4) Guirado J.C., Marcaide J.M., Elósegui P., et al., 1995, A&A 293, 613 [G95]
- (5) Guirado J.C., Marcaide J.M., Ros E., et al., 1998, A&A 336, 385 [G98]
- (6) International Earth Rotation Service (IERS), 1999, Annual Report for 1998, Gambis, D. (ed.), Observatoire de Paris, France
- (7) Klobuchar J.A., 1975, Air Force Cambridge Research Laboratories Report No. AFCRL-TR-75-0502 (NTIS ADA 018862)
- (8) Lestrade J.F., Rogers, A.E.E., Whitney, A.R., et al., 1990, AJ 99, 1663
- (9) Murphy, D.W., Tingay S.J., Preston R.A., et al., 1999, New Astronomy Reviews 43, 727
- (10) Robertson D.S., 1975, Ph.D. Thesis, Massachusetts Institute of Technology, Cambridge, MA, USA
- (11) Ros E., Marcaide J.M., Guirado J.C., et al., 1999, A&A 348, 381 [R99]
- (12) Ros E., Marcaide J.M., Guirado J.C., et al., 2000, A&A submitted
- (13) Saastamoinen J., 1973, Bull. Géodésique 105, 279
- (14) Schaer S., Gurtner W., Feltens J., 1998, In: Proceedings of the IGS AC Workshop, Darmstadt, Germany: http://www.cx.unibe.ch/aiub/ionosphere.html
- (15) Shapiro I.I., Wittels J.J., Counselman C.C., et al., 1979, AJ 84, 1459
- (16) Shepherd M.C., Pearson T.J., Taylor G.B., 1995, BAAS 26, 987
- (17) Treuhaft R.N., Lanyi G.E., 1987, Radio Science 22, 251