The Near-Ultraviolet Continuum of Late-Type Stars
Abstract
Analyses of the near-ultraviolet continuum of late-type stars have led to controversial results regarding the performance of state-of-the-art model atmospheres. The release of the homogeneous IUE final archive and the availability of the high-accuracy Hipparcos parallaxes provide an opportunity to revisit this issue, as accurate stellar distances make it possible to compare observed absolute fluxes with the predictions of model atmospheres.
The near-UV continuum is highly sensitive to and [Fe/H], and once the gravity is constrained from the parallax, these parameters may be derived from the analysis of low-dispersion long-wavelength (2000–3000 Å) IUE spectra for stars previously studied by Alonso et al. (1996) using the Infrared Flux Method (IRFM). A second comparison is carried out against the stars spectroscopically investigated by Gratton et al. (1996). It is shown that there is a good agreement between s obtained from the IRFM and from the near-UV continuum, and a remarkable correspondence between observed and synthetic fluxes for stars with K of any metallicity and gravity. These facts suggest that model atmospheres provide an adequate description of the near-UV continuum forming region and that the opacities involved are essentially understood. For cooler stars, the results of the IRFM are no longer reliable, as shown by Alonso et al., but the discrepancy noticed for stars hotter than 6000 K may reflect problems in the model atmospheres and/or the opacities at these higher temperatures.
1 Introduction
The old problem of the missing opacity in the UV region of the solar spectrum (Holweger 1970, Gustafsson et al. 1975) was claimed to be solved by Kurucz (1992), who included millions of atomic and molecular lines previously ignored in the computation of model atmospheres. Later, Bell, Paltoglou & Tripicco (1994) criticized that solution, and the controversy has been recently revived by Balachandran & Bell (1998) in connection with its relevance to the solar beryllium abundance. In the mean time, Malagnini et al. (1992) and Morossi et al. (1993) compared observations and Kurucz’s calculations for late-G and early-K stars, and found that theory underpredicted the near-UV fluxes. Very recently, other authors have not found such inconsistencies in the analysis of UV spectra for late-type metal-poor stars and also for O-B-A stars (Peterson 1999, Fitzpatrick & Massa 1998, 1999a, 1999b). The situation is confusing. A reappraisal deserves to be made taking advantage of recent revisions of stellar near-UV fluxes measured by the IUE satellite and the availability of Hipparcos parallaxes (ESA 1997).
The continuum observed in the spectral region between 2500 and 3000 Å is formed in the lower layers of the photosphere for late-type stars. While shorter wavelengths map higher atmospheric layers, this spectral band is particularly important as a spectroscopic tool, independent of the optical window, to analyze the stellar photosphere. UV spectra are of relevance to the determination of abundances of several astrophysically interesting elements such as boron (Duncan et al. 1998) or neutron-capture elements such as osmium, platinum, or lead (Sneden et al. 1998). In a spectral region were spectral lines are highly crowded, a demostration that observed fluxes match those predicted by the models used for the abundance analysis gives confidence in the derived abundances. In addition, it has been recognized in the literature (Lanz et al. 1999) that good understanding of the near-UV spectrum of AF stars is key for dating intermediate-age stellar populations.
Accurate measurements of stellar fluxes in the ultraviolet are in principle possible from outside Earth’s atmosphere. Absolute fluxes were first measured through the long-wavelength cameras of the IUE satellite, later the shuttle-borne WUPPE instrument, and finally through GHRS, and now its substitute STIS, onboard HST. The quality of the fluxes measured by HST is high, but spectrographs onboard have mainly been used for high dispersion and therefore span a limited spectral coverage. The long life of the IUE satellite provided an extensive dataset of low dispersion spectra, although even the recently released (NEWSIPS) version of the database has been found to include systematic effects (Massa & Fitzpatrick 1998). A newer version of the IUE Final Archive, named INES (IUE Newly Extracted Spectra) has started to run at the time of writing this paper (Rodríguez-Pascual et al. 1999).
Observations provide the flux at the Earth. Model atmospheres predict the surface flux per unit area. Observation and prediction are related by the stellar distance from Earth and the stellar radius. The absolute magnitude calculated using the apparent visual magnitude, a bolometric correction, and the Hipparcos parallax is combined with an estimate of the effective temperature and theoretical evolutionary tracks to derive the stellar radius. The radius and the Hipparcos parallax make it possible to correct the observed flux for dilution by the inverse-square law and so obtain the flux emitted from the stellar surface. Comparison with predicted fluxes is made for a range in effective temperature and metallicity with the best fit to the observed fluxes providing estimates of these two quantities. (Predicted fluxes are weakly sensitive to surface gravity.) We compare these estimates with those obtained by other techniques such as the InfraRed Flux Method, and analysis of absorption lines in optical spectra.
2 Observations
IUE observations have been entirely reprocessed in a homogeneous fashion with the set of procedures named NEWSIPS to produce the IUE Final Archive. This database, in particular the node operated at Villafranca Satellite Tracking Station near Madrid111http://iuearc.vilspa.esa.es/iuefab.html, has been the source of the spectra analyzed here. A newer version of the archive is being released through prototype servers (Rodríguez-Pascual et al. 1999).
Several improvements are present in the low-resolution NEWSIPS spectra employed here with respect to the older algorithms, such as a better weighted slit extraction method, and a correction for the sensitivity degradation of the detectors over the life of the satellite and temperature variations. An improved procedure for obtaining the absolute flux calibrations was also implemented. The reader is referred to the IUE NEWSIPS Information Manual (Garhart et al. 1997) and references therein for more detailed information.
When more than a single spectra was available for a given star, they were combined and cleaned using the IUEDAC IDL Software libraries222http://archive.stsci.edu/iue/iuedac.html to produce a single spectrum per star. The effect of interstellar reddening was considered negligible.
3 The formation of the near-UV optical continuum and its sensitivity to the basic atmospheric parameters
We specifically refer to the near-UV as the region between 2000–3000 Å. This spectral band is particularly interesting for the study of stellar atmospheres, as it maps the deeper parts of the photosphere, down below the region where the optical continuum is formed, but not as deep as the continuum observed at 1.6 m. A simple sketch of the main hydrogenic opacities from 1 to 3 m at a temperature of 5000 K and an electron pressure of 3 dyn cm2 is shown in Fig. 1. Hydrogen Rayleigh scattering, and even more importantly, but not represented in Fig. 1, photoionization of carbon, silicon, aluminum, magnesium, and iron produce a tremendous increase of the continuum opacity for wavelengths shorter than about 2500 Å (see Gray 1992 and references therein), and radiation is only able to escape from the higher atmosphere.


Between roughly 2000 and 2500 Å and for solar abundances magnesium photoionization dominates the continuum absorption , and the opacity is larger, but of the same order of magnitude (yet uncertain) as the H- in the optical and near-IR. H- bound-free opacity is the main contributor to the continuum opacity between 2500 and 3000 Å. A quantitative measure of the formation depths of the continuum at those wavelengths for a solar-like photosphere can be obtained computing the response function to temperature. Figure 2 shows the changes in the true continuum (not including line absorption) at the stellar surface resulting from an increase of 10% in temperature at different atmospheric depths. The different lines correspond to different wavelengths, and the longer the wavelength, the higher (outer) in the atmosphere the response function peaks. Therefore, between roughly 2500 and 3000 Å the continuum is formed in deeper regions than the optical continuum, while at shorter wavelengths the continuum covers higher layers. Due to the typical decrease of the flux towards shorter wavelengths in this region of the spectrum for late-type stars, and to the limited signal-to-noise ratio in the IUE spectra, it is the region between 2500 and 3000 Å from where most of the information will be retrieved.
We have made use of the flux distributions calculated by Kurucz, and available at CCP7333http://ccp7.dur.ac.uk since 1993. The grid includes models for different gravities (, effective temperatures () and metal contents ([Fe/H]), while the parameters in the mixing-length treatment of the convection are fixed, as well as it is the microturbulence (2 km s-1), and the abundance ratio between different metals (solar-like mixture). For a given set of (, , [Fe/H]), we obtain the theoretical flux from linear interpolation, and therefore using the information of the eight nearest models available in the grid.

Neutral metals are large contributors to line absorption in the near-UV. Therefore, temperature has three allied effects on the emerging flux. Firstly, hotter temperatures increase the available flux. They also reduce the importance of photodetachment absorption of H-, and so decrease the continuum absorption. Besides, the diminished abundance of neutral metals reduces the line absorption. The net effect is an important increment in the emerging flux. The solid lines in Fig. 3 show the result of a change of K in the effective temperature for a solar model atmosphere. Changes in chemical composition are important mainly for the neutral metal’s contribution to the line absorption, and this is demonstrated by the dashed lines, which correspond to modifying in dex the logarithm of the solar metal abundance. Gas pressure plays a minor role, as reflect the dotted lines in Fig. 3, which correspond to changes in gravity of a 70%. The effects of and the metal content are significant, and both leave characteristic signatures on the absolute flux resulting from the different shape of the line and continuum absorption. This will make it possible to estimate these two stellar parameters from the observed absolute fluxes. Fig. 3 shows that the changes in the slope of the observed spectrum induced by variations of or [Fe/H] are more subtle; it is much more difficult to extract the information on the atmospheric physical conditions from relative (not absolute) measurements of the spectral energy distribution in these wavelengths, as already demonstrated by Lanz et al. (1999).
4 Near-UV fluxes as a tool to derive stellar parameters
The modeling of late-type stellar spectra in the near-UV region presents all the same problems as any other spectral window. The adequacy of the assumptions involved in the construction of model atmospheres is critical. Line blanketing affects the structure of stellar photospheres (Mihalas 1978), but as an extra difficulty, in the near-UV the concentration of lines is so high as to give shape to the overall energy distribution.
Early confrontation of UV fluxes predicted by classical model atmospheres with observations (Holweger 1970, Gustafsson et al. 1975) revealed inconsistencies, the predicted fluxes exceeding observations. Later Kurucz (1992) claimed to have solved the problem by including previously missing line absorption. Bell, Paltoglou & Tripicco (1994) presented evidence that Kurucz to had included too many lines. A comparison at high dispersion in the regions 3400–3450 Å and 4600–4650 Å revealed that synthetic spectra based on Kurucz’s linelist predicted stronger-than-observed absorption features. Bell et al. (1994), and later Balachandran & Bell (1998), suggested missing contributors to the continuum absorption rather than line blanketing as a possible explanation for the problem. It is unclear whether Kurucz’s calculations experience that weakness in the spectral window we concentrate on (2000–3000 Å), but while comparison of synthetic spectra and observations of the Sun (or any other single star) will leave room for line absorption to mimic missing continuum opacity, or viceversa, simultaneous comparison with a number of stars of different temperatures, and in particular, chemical compositions, will strongly limit that possibility.

In any case, comparison with the Sun is a must. Colina, Bohlin & Castelli (1996) compiled an updated version of the available measurements of the solar flux distribution. Fig. 4 shows fairly good agreement with the theoretical predictions, in consistency with Kurucz’s claims. The fluxes are compared at the solar surface.
The stellar parameters are known for no star with such an extremely high accuracy as for the Sun. However, semi-empirical methods to derive s have been applied to solar-metallicity stars. The Infrared Flux Method (IRFM; Blackwell et al. 1991) is weakly dependent on the model atmospheres, and in particular, the line blanketing only affects the atmospheric structure, but not the calculation of the flux itself. The procedure’s reliability has been tested with temperatures obtained from measurements of angular diameters by lunar occultation.
In the following sections we compare s and [Fe/H]s for the stars with metallicities in the range [Fe/H] studied by Alonso et al. (1996) with those obtained from the comparison of predicted and observed near-UV fluxes. The IRFM has been applied by Alonso et al. to a large sample of late-type dwarfs and subgiants with either spectroscopic or photometric estimates of the metallicity, making it possible to constrain the second fundamental parameter that influences the near-UV continuum. Despite the claimed weak-dependence of the results on the choice of model atmosphere, it is interesting to mention that the models employed in this study are similar, if not identical, to those used by Kurucz to compute the predicted flux distributions employed here. Gratton et al. (1996) made use of the published results from the IRFM to construct a reference frame of stars, and used it in combination with other spectroscopic indicators, such as the iron ionization balance, to derive stellar parameters for a larger sample of stars. Again, similar or identical model atmospheres are involved.
Our analysis adopts the following scheme:
-
1.
Estimates of the stellar mass (), and bolometric correction () are obtained following the same procedure as in Allende Prieto et al. (1999). Briefly, the Hipparcos parallaxes () are used to transform visual magnitudes to absolute magnitudes. Depending on the metallicity, an isochrone from the calculations by Bergbusch & VandenBerg (1992) is then used to estimate and , interpolating in the and relationships. Here it is assumed that stars with [Fe/H] have an age of 9 years, and those with [Fe/H] are 12 years old, although this is has a negligible relevance (see Allende Prieto et al. 1999).
-
2.
Using the initial estimates for the effective temperature from a source (e.g. Alonso et al. 1996), , the gravities and radii are then obtained through the well-known expressions:
(1) (2) -
3.
The near-UV IUE spectra are compared with the synthetic spectra, after converting the flux predicted at the stellar surface to Earth using the nondimensional dilution factor , deriving the values of and [Fe/H] that minimize, in the least-square sense, their differences. This is performed using the Nelder-Mead simplex method for multidimensional minimization of a function, as implemented by Press et al. (1988), giving even weights to all wavelengths.
-
4.
The gravity is then modified to be consistent with the new :
(3) while variations in other magnitudes resulting from corrections in [Fe/H] were found to be negligible.
-
5.
Then, final values for and [Fe/H] are derived from a new comparison between synthetic and observed spectra.
The transfer of errors in gravity and distance determined from the Hipparcos parallax (see Allende Prieto et al. 1999) to errors in the derived and [Fe/H] was estimated computing upper and lower limits to the dilution factor , and repeating the minimization of the differences between observed and predicted fluxes. The gravity is decreased and the dilution factor increased by the estimated uncertainties to produce upper limits for and lower limits for [Fe/H], and the signs of the increments are reversed to obtain lower limits for and upper limits for [Fe/H]. This is generally appropriate, especially because errors in the flux dilution factors typically produce a much larger impact than those in the gravity. In a very few cases, when the internal uncertainties are particularly small, the rule of positive superindices (upper limits) and negative subindices (lower limits) in the derived s and [Fe/H]s shown in Tables 1 and 2 is broken. The use of the Nelder-Mead simplex method to find the best fit to the observed spectra is well justified, as for all extreme cases checked, a single minimum was present, and the was found to vary smoothly with and [Fe/H]. No changes were made in the original resolution of observed or calculated fluxes, as they were similar enough for our purposes.
4.1 Comparison with the s derived by Alonso et al. (1996) from the IRFM
316 low dispersion spectra of 88 of the stars observed by Hipparcos in the sample of Alonso et al. (1996) were obtained with the low-dispersion long-wavelength cameras of IUE. The reddenings listed by Alonso et al. were taken into account to derive the gravities from the Hipparcos parallaxes. Two stars (HR3427, HR8541) were discarded as they were too hot ( K) for the selected isochrones. Eleven more stars (G099-015, G119-052, G171-047, G231-019, HD140283, HR1084, HR2943, HR4030, HR4623. HR509, HR937) were dropped as either the quality of their spectrum was extremely poor and/or the procedure to fit the spectrum failed (we recall that the interstellar extinction is being neglected).
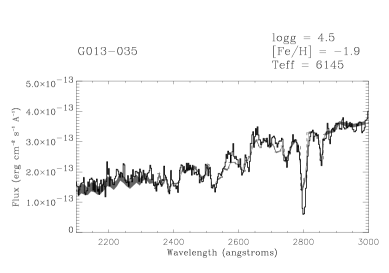
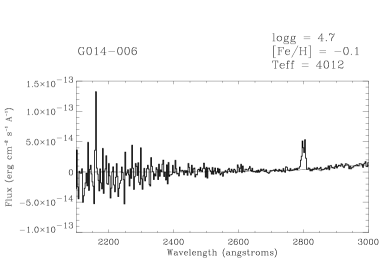
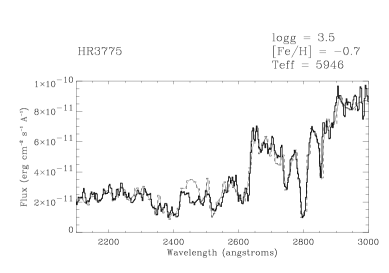
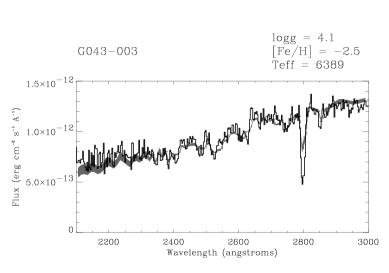
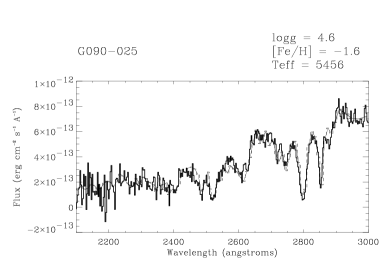

Fig. 5 displays several examples of the comparison between theoretical fluxes at Earth (shaded and broken lines) and the IUE observations (thick solid line). The thickness of the shaded lines indicates the different fits obtained when upper and lower limits of the errors in the flux dilution factor are taken into account and correspond to different values of and [Fe/H]. The finally derived stellar parameters for all the stars, and their lower and upper limits are listed in Table 1. It is possible to find a pair (, [Fe/H]) that reproduce the observed fluxes within the uncertainties; the final match of the energy distribution is excellent. A strong discrepancy is evident between predicted and observed strength of the Mg I resonance line at 2852 Å in the spectra of metal-deficient stars. Magnesium is one of the so-called -elements, whose abundance ratio to iron is known to be larger than solar in metal-poor stars, a fact not taken into account in the construction of the model atmospheres and the calculation of the synthetic spectra used here.
The comparison of the IRFM effective temperatures published by Alonso et al. (1996) as the averaged values from the application of the method in the J, H, and K broad bands with the values obtained from the fit to the near-UV flux is shown in Fig. 6 (upper panel). The mean difference is only %, and the standard deviation is 3%. However, the level of agreement is not evenly distributed along the temperature range. The standard deviation reduces to 2% for the stars with K.
For stars cooler than 4000 K, molecular absorption plays a major role, and it has been recognized many times that the models used here do not include this absorption adequately. Evidence for this is abundant in the literature, and to mention an example particularly relevant to this comparison, the internal consistency found by Alonso et al. (1996) among the s derived from the different bands disappears for stars cooler than 4000 K. Besides, Alonso et al. have shown that the sensitivity to errors in the input quantities of the IRFM becomes particularly enhanced for those stars. For stars hotter than about 6500 K, neutral hydrogen photoionization makes an increasingly important contribution to the continuum opacity in the optical, near IR, and near-UV. The fact that IRFM temperatures show high internal consistency for stars with K but do not agree with those derived from fitting the near-UV continuum may reveal an important inconsistency of the model atmospheres or errors in the UV opacity at those temperatures. However, it is not possible to rule out other possibilities at this stage. For example, we have not explored the influence of a change in the parameter(s) involved in the mixing-length treatment of the convection, the microturbulence, the binning of both the models and the observations, or the presence of systematic errors in the flux calibration.


Fig. 6 (middle panel) compares the metallicities listed by Alonso et al. with those derived from the fit of the near-UV. Alonso et al. got metallicity estimates from the catalogue gathered by Cayrel de Strobel et al. (1992) for part of the sample, and completed the work using photometric calibrations (Carney 1979, Schuster & Nissen 1989). The near-UV metallicities are on the same scale, as indicated by the mere dex mean difference, and the standard deviation is 0.4 dex, which might well be entirely accounted for by the highly inhomogeneous origin of the Alonso et al’s metallicities, i.e. our test may not reveal the true accuracy of the [Fe/H] estimates from the near-UV fluxes.
4.2 Comparison with the stars analyzed by Gratton et al. (1996)
Starting from color- calibrations based on published IRFM s for solar-metallicity stars, Gratton et al. (1996) derived consistent stellar parameters by requiring Kurucz’s model atmospheres to reproduce the iron ionization equilibrium. They noticed that it was not possible to completely zero the trends of the iron abundance derived from lines with different excitation potentials, and keep the s consistent with the IRFM photometric calibrations. Comparison of their ionization-equilibrium gravities with those estimated by Allende Prieto et al. (1999) based on Hipparcos parallaxes has shown a significant trend of the difference with metallicity. However, such a trend is difficult to interpret, as many external elements, such as different scales, are at play (see Allende Prieto et al.).
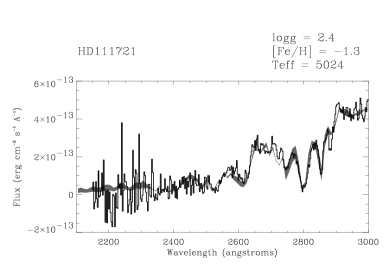
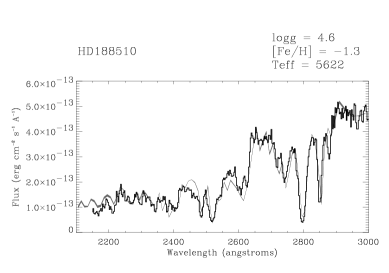
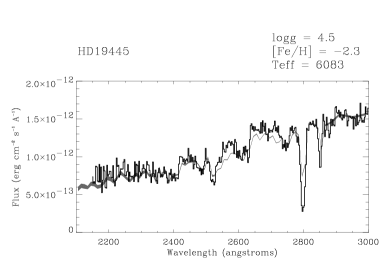
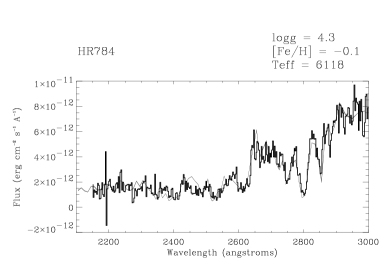
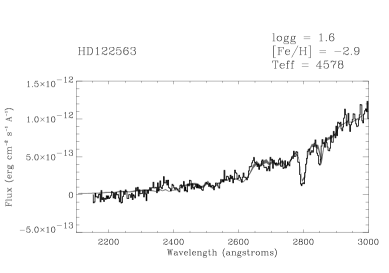
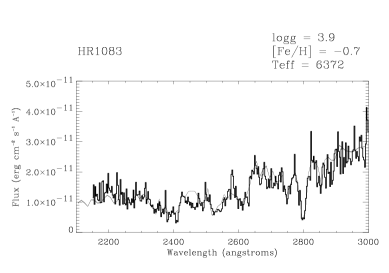
Among several comparisons performed by Gratton et al. to check their adopted photometric calibrations, they show the existence of a large discrepancy between their s and those derived by Edvardsson et al. (1993) and Nissen et al. (1994), which strongly correlates with the stellar metallicity. They find that differences between the atmospheric structures employed are the reason for the discrepancy. We are then interested in seeing whether Kurucz models, and in particular, the calibrations based on IR fluxes of Kurucz models obtained by Gratton et al. are consistent with temperatures derived from the near-UV fluxes. We found that 57 stars studied by Gratton et al. had been observed by Hipparcos and the long-wavelength cameras of the IUE at low dispersion. The spectra of four of the stars (HD108177, HD165195, HD187111, HD221170) could not be fitted by our procedure. Fig. 7 shows some comparisons between observed (thick solid lines) and synthetic spectra (shaded and broken lines). The thickness of the shaded lines is used again to indicate the result of using upper and lower limits of the flux dilution factor in the fit.


Fig. 8 (upper panel) shows the comparison between the retrieved s and those published by Gratton et al. (1996). The standard deviation of the two scales is a mere 2%, although it is apparent, as was found for the comparison with Alonso et al., that the s from the near-UV fluxes for stars hotter than K are systematically smaller. Restricting the comparison to stars cooler than 6200 K the standard deviation is reduced to 1.6%. Large uncertainties affect the translation between fluxes at the stellar surface and at Earth for the cooler stars, as indicated by the large error bars. Figure 8 (lower panel) shows agreement for the metallicity scales. Excluding a particularly deviant case, HD184711, the mean difference is and the standard deviation is 0.3 dex. No correlation is apparent between the discrepancies in and metallicity.
5 Summary and conclusions
The parallaxes measured by the Hipparcos mission provide a way to translate the spectral energy distributions observed at Earth to absolute fluxes escaping from the stellar surface. Opacities and models employed to compute the predicted flux can therefore be checked using not only the shape of the continuum, but also its absolute value.
Effective temperatures derived by Alonso et al. (1996) using the Infrared Flux Method (Blackwell et al. 1991) are compared with those derived here from absolute near-UV fluxes observed by the IUE satellite. The study shows that for stars with in the range K, the two methods provide concordant results. For stars cooler than 4000 K, Alonso et al. have shown that the Infrared Flux Method is especially sensitive to errors in the observed quantities, and that might be the reason for the discrepancy with the near-UV s. The systematic differences found for stars hotter than 6000 K may reflect problems in the model atmospheres and/or the opacities for those temperatures, although other effects can not be ruled out at this stage. The metallicities compiled by Alonso et al. from the Cayrel et al. (1992) catalogue and photometric calibrations are in agreement with those retrieved from the analysis of near-UV spectra, at least within their expected uncertainties. A similar comparison is performed with the multi-criteria atmospheric parameters derived by Gratton et al. (1996), strengthening the results just described.
Previous comparisons between synthetic and observed near-UV spectra for late-G and early-K stars were performed by Morossi et al. (1993; see also Malagnini et al. 1992). They used older IUE data but the same (or very similar) Kurucz models. Their approach was different, in the sense they used atmospheric parameters predetermined from the literature (spectroscopic analysis) and empirical photometric calibrations to select a model and then compare it with the observations. In contrast to our conclusions, they found strong discrepancies between observed and predicted near-UV fluxes for several stars: predicted fluxes were smaller than observations. Whether systematic errors in the stellar parameters or deficiencies in the older IUE fluxes were responsible for the failure is unclear.
We conclude that Kurucz flux-constant model atmospheres are able to reproduce the near-UV absolute continuum for stars with K. This holds for any metallicity and gravity, although it is clearly worthwhile to concentrate future efforts on the detailed study of obvious small discrepancies for particular cases and particular wavelengths, as they should shed light on important issues, such as chemical abundances of several elements which produce features in the considered spectral range (e.g. boron; Cunha & Smith 1999). The retrieved s and [Fe/H]s are in excellent agreement with other reliable spectroscopic and photometric indicators, which we interpret as an important success of the models indicating that: i) the average temperature stratification in the layers is appropriate, ii) the fundamental hypotheses employed to construct the models are adequate to interpret the near-UV continuum, and iii) the line and continuum opacities in the UV are essentially understood. The newer version of the IUE final archive (INES) and the application of recently-suggested procedures (Massa & Fitzpatrick 1998) in order to improve the quality of IUE fluxes will provide an excellent opportunity to check and extend the analyses presented here, as well as to exploit the wealth of information coded in the near-UV continuum.
References
- (1) Allende Prieto, C., García López, R. J., Lambert, D. L., & Gustafsson, B. 1999, ApJ, in press
- (2) Alonso, A., Arribas, S., & Martínez Roger, C. 1996, A&AS, 117, 227
- (3) Balachandran, S. C., & Bell, R. A. 1998, Nature, 392, 791
- (4) Bell, R. A., Paltoglou, G., & Tripicco, M. J. 1994, MNRAS, 268, 771
- (5) Bergbusch, P. A., & VandenBerg, D. A. 1992, ApJS, 81, 163
- (6) Blackwell, D. E., Lynas-Gray, A. E., & Petford, A. D. 1991, A&A, 245, 567
- (7) Carney, B. W., 1979, ApJ, 233, 211
- (8) Cayrel de Strobel, G., Hauck, B., Francois, P., Thevènin, F., Friel, E., Mermilliod, M., Borde, S. 1992, A&AS, 95, 273
- (9) Colina, L., Bohlin, R. C., & Castelli, F. 1996, AJ, 112, 307
- (10) Cunha, K., & Smith, V. V. 1999, ApJ, 512, 1006
- (11) Duncan, D. K., Rebull, L. M., Primas, F., Boesgaard, A. M., Deliyannis, C. P., Hobbs, L. M., King, J. R., & Ryan, S. G. 1998, A&A, 332, 1017
- (12) Edvardsson, B., Andersen, J., Gustafsson, B., Lambert, D. L., Nissen, P. E., & Tomkin, J. 1993, A&A, 275, 101
- (13) ESA 1997, The Hipparcos Catalogue, ESA SP-1200
- Fitzpatrick & Massa (1998) Fitzpatrick, E. L. & Massa, D. 1998, BAAS, 193, 4403
- (15) Fitzpatrick, E. L. & Massa, D. 1999a, BAAS, 194, 110503
- (16) Fitzpatrick, E. L. & Massa, D. 1999b, ApJ, in press
- (17) Garhart, M. P., Smith, M. A., Levay, K. L., & Thompson, R. W. 1997, IUE NEWSIPS Information Manual, v2.0, IUE Nasa Newsletter, No. 57
- (18) Gratton, R. G., Carretta, E., & Castelli, F. 1996, A&A, 314, 191
- (19) Gray, D. F. 1992, The observation and analysis of stellar photospheres, second edition (Cambridge: Cambridge University Press)
- (20) Gustafsson, B. Bell, R. A., Eriksson, K., & Nordlund, Å. 1975, A&A, 42, 407
- (21) Holweger, H. 1970, A&A, 4, 11
- (22) Kurucz, R. L. 1991, private communication
- (23) Kurucz, R. L. 1992, Rev. Mex. de Astronomía y Astrofísica, 23, 181
- (24) Lanz, T., Heap, S., Brown, T. M., Hubeny, I., & Yi, S. 1999, in Spectrophotometric Dating of Stars and Galaxies, I. Hubeny, S. R. Heap, and R. H. Cornett, eds., ASP Conf. Ser. Vol. 192, 106
- (25) Malagnini, M. L., Morossi, C., Buser, R., & Parthasarathy, M. 1992, A&A, 261, 558
- Massa & Fitzpatrick (1998) Massa, D. & Fitzpatrick, E. L. 1998, BAAS, 193, 1122
- (27) Mihalas, D. 1978, Stellar Atmospheres, second edition (San Francisco: W. H. Freeman and Co.)
- (28) Morossi, C., Franchini, M., Malagnini, M. L., Kurucz, R. L., & Buser, R. 1993, A&A, 277, 173
- (29) Nissen, P. E., Gustafsson, B., Edvardsson, B., Gilmore, G. 1994, A&A, 285, 440
- Peterson (1999) Peterson, R. C. 1999, American Astronomical Society Meeting, 194, 1102
- (31) Press, W.H., Flannery, B.P., Teukolsky, S.A., & Vetterling, W.T. 1988, Numerical Recipes (Cambridge: CambridgeUniv. Press)
- (32) Rodríguez-Pascual, P. M., González-Riestra, R., Schartel, N., & Wamsteker, W. 1999, A&A, in press
- (33) Schuster, W. J., & Nissen, P. E. 1989, A&A, 221, 65
- (34) Sneden, C., Cowan, J. J., Burris, D. L., & Truran, J. W. 1998, ApJ, 496, 235
| Star | [Fe/H]UV | [Fe/H]Lit | ||||
|---|---|---|---|---|---|---|
| K | K | dex | dex | mas | dex | |
| G013-035 | 6146 | 6097 | 10.95 | 4.45 | ||
| G014-006 | 4012 | 3748 | 92.75 | 4.70 | ||
| G019-013 | 4325 | 4314 | 92.98 | 4.66 | ||
| G019-024 | 4368 | 4065 | 129.54 | 4.80 | ||
| G025-015 | 5650 | 5747 | 17.83 | 3.81 | ||
| G043-003 | 6389 | 6330 | 12.44 | 4.14 | ||
| G058-025 | 6028 | 6001 | 19.23 | 4.35 | ||
| G063-009 | 5886 | 5884 | 24.65 | 4.19 | ||
| G080-015 | 5810 | 5798 | 41.07 | 4.35 | ||
| G090-025 | 5456 | 5441 | 35.29 | 4.63 | ||
| G112-054 | 5282 | 5134 | 52.01 | 4.60 | ||
| G182-007 | 5303 | 5175 | 19.78 | 4.16 | ||
| G182-019 | 5810 | 5771 | 18.32 | 4.33 | ||
| G184-029 | 3935 | 3760 | 58.60 | 4.58 | ||
| G191-051 | 4023 | 3832 | 80.13 | 4.88 | ||
| G196-009 | 3860 | 3764 | 205.22 | 4.61 | ||
| G200-062 | 5150 | 5098 | 41.83 | 4.52 | ||
| G237-062 | 5265 | 5323 | 23.16 | 4.23 | ||
| G244-059 | 5523 | 5501 | 25.82 | 4.48 | ||
| GJ782 | 3966 | 3900 | 63.82 | 4.61 | ||
| GJ820B | 3845 | 3786 | 285.42 | 4.65 | ||
| GJ884 | 3834 | 3746 | 122.80 | 4.64 | ||
| HD103095 | 5069 | 5029 | 109.21 | 4.68 | ||
| HD111980 | 5697 | 5624 | 12.48 | 3.97 | ||
| HD118100 | 4127 | 4179 | 50.54 | 4.62 | ||
| HD134439 | 5110 | 4974 | 34.14 | 4.74 | ||
| HD157089 | 5532 | 5662 | 25.88 | 4.01 | ||
| HD188510 | 5597 | 5564 | 25.32 | 4.63 | ||
| HD193901 | 5777 | 5750 | 22.88 | 4.57 | ||
| HD19445 | 6065 | 6050 | 25.85 | 4.51 | ||
| HD201891 | 5929 | 5909 | 28.26 | 4.33 | ||
| HD25329 | 4870 | 4842 | 54.14 | 4.78 | ||
| HD4307 | 5726 | 5753 | 31.39 | 3.97 | ||
| HR0660 | 5611 | 5591 | 92.20 | 4.30 | ||
| HR1325 | 5080 | 5040 | 198.24 | 4.51 | ||
| HR1543 | 6331 | 6482 | 124.60 | 4.16 | ||
| HR1729 | 5826 | 5847 | 79.08 | 4.19 | ||
| HR1925 | 5179 | 5185 | 81.69 | 4.51 | ||
| HR2085 | 6524 | 7013 | 66.47 | 3.79 | ||
| HR219 | 5809 | 5817 | 167.99 | 4.33 | ||
| HR2852 | 6470 | 7020 | 54.06 | 3.78 | ||
| HR321 | 5386 | 5315 | 132.40 | 4.56 | ||
| HR3262 | 6115 | 6242 | 55.17 | 4.11 | ||
| HR3775 | 5946 | 6338 | 74.15 | 3.51 | ||
| HR4421 | 6356 | 6634 | 30.40 | 3.87 | ||
| HR4496 | 5371 | 5342 | 104.81 | 4.46 | ||
| HR4540 | 5955 | 6095 | 91.74 | 3.95 | ||
| HR4657 | 6136 | 6208 | 44.34 | 4.30 | ||
| HR4785 | 5784 | 5867 | 119.46 | 4.34 | ||
| HR483 | 5755 | 5874 | 79.09 | 4.26 | ||
| HR493 | 5072 | 5172 | 133.91 | 4.51 | ||
| HR4983 | 5857 | 5964 | 109.23 | 4.29 | ||
| HR5447 | 6405 | 6707 | 64.66 | 4.01 | ||
| HR5534 | 5946 | 6019 | 55.73 | 4.37 | ||
| HR5568 | 4632 | 4605 | 169.32 | 4.61 | ||
| HR5634 | 6406 | 6571 | 50.70 | 4.09 | ||
| HR5758 | 6434 | 6831 | 19.73 | 3.86 | ||
| HR5868 | 5861 | 5897 | 85.08 | 4.17 | ||
| HR5901 | 4798 | 4811 | 32.13 | 3.06 | ||
| HR5914 | 5763 | 5774 | 63.08 | 3.97 | ||
| HR5933 | 6154 | 6233 | 89.92 | 4.09 | ||
| HR5968 | 5770 | 5777 | 57.38 | 4.18 | ||
| HR6556 | 7325 | 7923 | 69.84 | 3.35 | ||
| HR6752 | 5023 | 4978 | 196.62 | 4.37 | ||
| HR6806 | 5034 | 4947 | 90.11 | 4.57 | ||
| HR72 | 5628 | 5683 | 42.67 | 4.28 | ||
| HR7373 | 5436 | 5518 | 66.01 | 4.10 | ||
| HR7462 | 5143 | 5227 | 173.41 | 4.52 | ||
| HR7503 | 5605 | 5763 | 46.25 | 4.17 | ||
| HR7504 | 5676 | 5767 | 46.70 | 4.29 | ||
| HR7914 | 5795 | 5761 | 47.65 | 4.41 | ||
| HR8085 | 4402 | 4323 | 287.13 | 4.67 | ||
| HR8086 | 4092 | 3865 | 285.42 | 4.73 | ||
| HR8832 | 4809 | 4785 | 153.24 | 4.58 | ||
| HR8905 | 5441 | 5954 | 18.83 | 2.61 |
| Star | [Fe/H]UV | [Fe/H]Spec | ||||
|---|---|---|---|---|---|---|
| K | K | dex | dex | mas | dex | |
| HD111721 | 5024 | 5164 | 3.29 | 2.35 | ||
| HD114762 | 5916 | 5941 | 24.65 | 4.21 | ||
| HD114946 | 5086 | 5198 | 25.89 | 3.18 | ||
| HD122563 | 4578 | 4583 | 3.76 | 1.58 | ||
| HD160617 | 6089 | 6042 | 8.66 | 3.90 | ||
| HD166161 | 4862 | 5186 | 3.25 | 2.35 | ||
| HD184711 | 4064 | 4157 | 3.15 | 1.97 | ||
| HD188510 | 5622 | 5628 | 25.32 | 4.64 | ||
| HD193901 | 5797 | 5796 | 22.88 | 4.58 | ||
| HD19445 | 6083 | 6080 | 25.85 | 4.52 | ||
| HD201891 | 5968 | 5974 | 28.26 | 4.35 | ||
| HD208906 | 6018 | 6072 | 34.12 | 4.36 | ||
| HD22879 | 5879 | 5926 | 41.07 | 4.37 | ||
| HD25329 | 4875 | 4849 | 54.14 | 4.78 | ||
| HD44007 | 4912 | 5051 | 5.17 | 2.77 | ||
| HD64606 | 5318 | 5206 | 52.01 | 4.61 | ||
| HD84937 | 6406 | 6357 | 12.44 | 4.14 | ||
| HD94028 | 6059 | 6060 | 19.23 | 4.36 | ||
| HR1083 | 6372 | 6695 | 46.65 | 3.85 | ||
| HR1729 | 5817 | 5824 | 79.08 | 4.20 | ||
| HR203 | 5751 | 5793 | 31.39 | 3.98 | ||
| HR2721 | 5855 | 5913 | 59.31 | 4.28 | ||
| HR3262 | 6159 | 6301 | 55.17 | 4.17 | ||
| HR3538 | 5615 | 5687 | 58.50 | 4.36 | ||
| HR3648 | 5876 | 5830 | 51.12 | 4.04 | ||
| HR3775 | 5922 | 6296 | 74.15 | 3.50 | ||
| HR4277 | 5763 | 5811 | 71.04 | 4.22 | ||
| HR4421 | 6329 | 6623 | 30.40 | 3.87 | ||
| HR4540 | 5942 | 6065 | 91.74 | 3.94 | ||
| HR4657 | 6174 | 6267 | 44.34 | 4.31 | ||
| HR4785 | 5758 | 5814 | 119.46 | 4.33 | ||
| HR483 | 5775 | 5825 | 79.09 | 4.28 | ||
| HR4845 | 5858 | 5868 | 57.57 | 4.38 | ||
| HR5011 | 5804 | 5920 | 55.71 | 4.10 | ||
| HR5235 | 5637 | 5943 | 88.17 | 3.38 | ||
| HR5447 | 6622 | 6734 | 64.66 | 4.18 | ||
| HR5868 | 5835 | 5847 | 85.08 | 4.16 | ||
| HR5914 | 5815 | 5831 | 63.08 | 3.99 | ||
| HR5933 | 6175 | 6268 | 89.92 | 4.09 | ||
| HR5968 | 5755 | 5745 | 57.38 | 4.17 | ||
| HR6243 | 6061 | 6361 | 27.04 | 3.24 | ||
| HR6315 | 6157 | 6215 | 66.28 | 4.22 | ||
| HR6458 | 5657 | 5633 | 69.48 | 4.29 | ||
| HR6775 | 5941 | 6001 | 63.88 | 4.15 | ||
| HR7061 | 5927 | 6301 | 52.37 | 3.61 | ||
| HR7560 | 5920 | 6047 | 51.57 | 4.04 | ||
| HR784 | 6118 | 6209 | 46.42 | 4.26 | ||
| HR8181 | 5958 | 6244 | 108.50 | 4.27 | ||
| HR8354 | 6119 | 6378 | 36.15 | 3.84 | ||
| HR8665 | 5894 | 6184 | 61.54 | 3.76 | ||
| HR8697 | 5956 | 6250 | 37.25 | 3.72 | ||
| HR8729 | 5652 | 5669 | 65.10 | 4.27 | ||
| HR8969 | 6078 | 6198 | 72.51 | 4.00 |