Modeling Galaxy Lenses
Abstract
In order to use a gravitational lens to measure the Hubble constant accurately, it is necessary to derive a reliable model of the lens surface potential. If the analysis is restricted to the locations and magnifications of point images, the derived Hubble constant depends upon the class of mass models used to fit the data. However, when there is extended emission from an Einstein ring, it may be possible to derive a potential from the observed surface brightness in a model-independent manner. This procedure is illustrated with reference to B1608+656. The multi-band images are de-reddened, de-convolved and de-contaminated so that the luminous matter and the surface brightness contours in the Einstein ring are both faithfully mapped. This intensity distribution can then be used to reconstruct the potential. Progress in implementing this program is reported.
The observed incidence of multiple-imaged galaxies on the Hubble Deep Fields is an order of magnitude smaller than naively predicted on the basis of radio lens surveys, like CLASS, but consistent with the rate computed using surface photometry of candidate lens galaxies assuming standard mass to light ratios. In order to resolve this paradox, it is suggested that most galaxy lenses are located in compact groups.
keywords:
cosmology: dark matter—cosmology: distance scale—cosmology: gravitational lensing1 Introduction
For a long while, (eg Refsdal 1964), gravitational lenses have promised unique and compelling cosmographical measurements. Despite considerable observational progress and a developing theoretical sophistication, the lens community has not yet delivered on this promise. The largest obstacle to further progress is the modeling of the lenses. Two novel approaches to improving our understanding of lens models are now described.
2 B1608+656
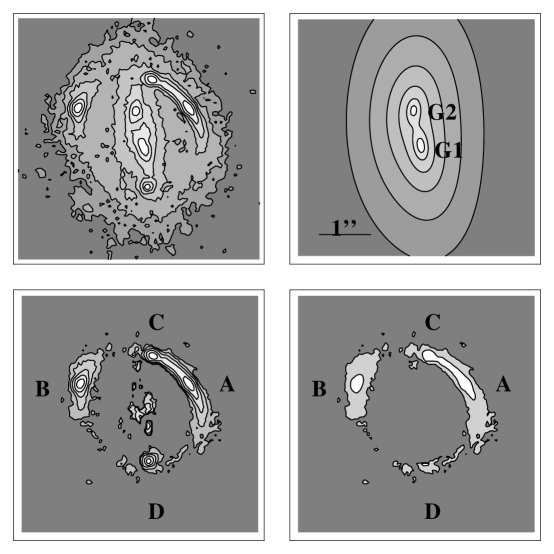
The well-studied quad, B1608+656 has four variable radio components arranged around an Einstein ring and labeled A, B, C, D (Fig. 1a). The scalar magnifications relative to B of A, C, D, at the same emission time, are 2, 1, 0.35 and the associated delays are 26, 33, 73 d respectively. The source and lens redshifts are known to be 0.63, 1.394 (Fassnacht, these proceedings and references therein). The lens comprises two interacting galaxies G1, G2. Models have been presented in Myers et al (1995), Blandford & Kundić (1997), Koopmans & Fassnacht (1999) and Fassnacht, (these proceedings).
The conventional approach to modeling galaxy lenses is to adopt a small library of potentials or mass distributions and adopt parameters that provide the best fit to the observed image properties by minimizing a suitably defined . As more data has been acquired, more parameters have become necessary and the accuracy of the derived value of the Hubble constant has deteriorated (eg Barkana et al 1999). The fundamental problem is that when the image data is limited to a few isolated points there is no unique interpolation between them. This can be demonstrated for B1608+656 by exhibiting two different mass models that fit the four radio image positions and magnifications with reasonable accuracy as well as the ratios of the reported time delays and yet which yield Hubble constants of km s-1 Mpc-1, respectively, (Surpi & Blandford, these proceedings)
This degeneracy may be broken when there is extended emission from an Einstein ring as it is then possible to match points with similar surface brightness. This approach has already been attempted at radio wavelengths, where it is convenient to work in Fourier space (eg Wallington, Kochanek & Narayan 1996 and references therein). However, the method has been limited to fitting simple and arbitrary models of the mass distribution. We now discuss a somewhat different approach in which an attempt is made to solve directly for the surface potential from the brightness distribution and which is specialized to address the peculiar difficulties posed by optical data. A quite different method with a similar goal has been presented here by Sahu (and references therein).
2.1 Intensity Reconstruction
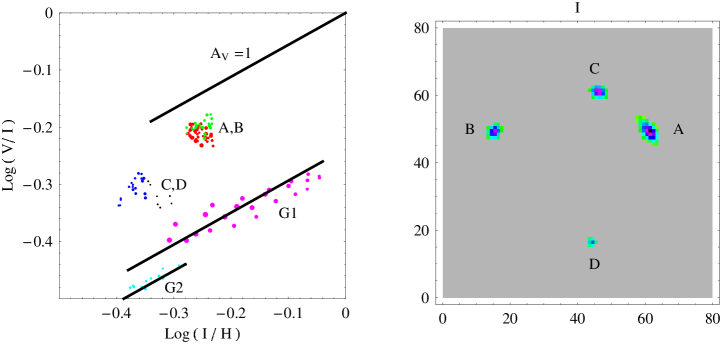
We use the and band images from Schechter et al (in preparation) and the band image from Fassnacht et al (in preparation). These have effective wavelengths of 372, 499, 982 nm in the lens frame, respectively. In order to form a faithful image of the multiply-imaged source, we must deconvolve, de-contaminate and de-redden the observed image. We do this by convolving the image with the PSF and vice versa. We then use these images to derive color maps of and . Next we use the observed radio magnifications and take the brightest , (with ) pixels from images respectively and plot them on a two color diagram (Fig. 2a). (The pixel numbers are in proportion to the radio magnifications, which we suppose to be unaffected by “milli-lensing” (eg Koopmans, these proceedings.)
We observe that the pixels around , have similar colors and are presumably subject to little reddening, whereas those from , have different colors that are displaced by a vector similar to that associated with Galactic dust (after correcting for the lens redshift) with respectively. (Note that we do not assume that the Galactic reddening law operates but can draw this conclusion from the data.) The presence of a constant reddening applied to the whole image will not affect our lens model; it will affect the photometric properties of the source and lens galaxies.

Next we take the brightest points around the two lens galaxy nuclei, , and and plot these on a two color diagram, we find that they lie along two lines also parallel to the Galactic reddening line, suggesting strongly that there are extinction gradients across the two lens galaxy nuclei. By inspection, we deduce that most of the reddening is due to , which appears to lie in front of . If we assume that {A, B, C, D}, G1 and G2 have three separate but uniform intrinsic colors, then it is possible to solve for the reddening over most of the image. The result of de-reddening the images A, B, C, D is shown in Fig 2b. Note that their surface brightnesses are now all similar, within the errors as required.
After we de-redden the lens galaxies, we observe that the surface brightness of G1, measured at points that are well-removed from G2 and the Einstein ring, has a distribution with radius that matches the de Vaucouleurs profile commonly used to describe elliptical galaxies, (cf Kochanek, these proceedings) (Fig. 3). We assume this profile for the light and iteratively remove G1 to leave G2, which is too distorted for a simple profile to be appropriate. In this way we can separate the light of both galaxies from that of the Einstein ring and, by adopting mass to light ratios that are matched to the observed size of the Einstein ring, we can model the luminous mass associated with the two lens galaxies.
The final step is to return to the original V, I images and de-convolve the Einstein ring using the measured PSFs. We then subtract off the reddened galaxy light and deredden the remaining ring image according to the extinction map deduced above. After iterating and some further refinements, we end up with a ring image like that shown in Fig. 1c.
2.2 Potential reconstruction
Before we show how to use this image to solve for the surface potential we note some general features of quad images arranged around an Einstein ring. We assume that the source intensity map contains a single maximum with nested, concave isophotes. This seems to be true for B1608+656. The challenge is to find a lens model that gives a four-to-one mapping of isophotes in the Einstein ring onto isophotes of similar intensity in the source plane. (We ignore the fifth image near the nucleus of G1.) Now mapping curves onto curves is not a unique operation. (It could be made into one, if we possessed two sets of distinct isophotes, but we don’t.) Nevertheless, there are strong constraints. Firstly, observe that the “crossing isophotes” (Fig. 1c) take the form of three, nested “lemniscates” inside a “limaçon”. The critical curve of the lens potential reconstruction must pass through all four saddles in the intensity, with each crossing isophote corresponding to a simple nested isophote in the source plane that is tangent to the caustic. Furthermore, if we construct the “outer limit” and the “inner limit” curves - the loci of the two isolated image points associated with pairs of images merging on the critical curve - then these must be tangent to the crossing isophotes, as shown. These constraints point to deficiencies in existing models.
In order to construct a surface potential, we start with a simple lens model that distributes mass density in proportion to the derived surface brightness in the two lensing galaxies, using a separate mass to light ratio for each of them and extrapolating using a de Vaucouleurs law to large radius. It is then adjusted to locate the four images A, B, C, D accurately.
This model does not yet map isophotes onto isophotes and we must correct it. This we do by constructing a trial source from the average on the source plane of the image intensities. We then map this trial source back onto the image plane and compare the resulting isophotes with the observed isophotes . We use the linearized equation,
| (1) |
to lowest order, where is the correction to the normalized surface potential and is the magnification tensor of the original model. We can solve for the correction to the potential by integrating down a sequence of curves of steepest descent in the source plane for each of four image zones around A, B, C, D. The potential and its gradient must match on the critical curve. This matching can be accomplished, iteratively, by adjusting the intensity distribution in the source plane. A few iterations ought to suffice to render the model consistent with the observed brightness within the errors associated with the intensity reconstruction. In principle, we can connect A, B, C, D without making any assumptions about the distribution of dark matter.

The practical application and uniqueness of this approach is currently under study. If it is successful, we can take the Laplacian of the derived potential to give the corrected mass distribution and subtract off the potential associated with this mass to leave the potential associated with matter not covered by the Einstein ring. Of course, this procedure conveys no information, apart from boundary condition at the inner and outer curves, concerning the potential outside the Einstein ring and where the image intensity map is unreliable.
2.3 Hubble constant
The procedure that we have outlined can provide just the potential information that we need to convert the measured arrival times to a value of the Hubble constant, subject to the usual concerns associated with the influence of intervening mass distribution and the overall world model. The results can only be as good as the image intensity model and the corrections made to it. It does, however, include one more internal consistency check. The three ratios of the arrival times are determined independently by the potential model and can be compared with the observed values. More generally, this potential reconstruction technique may be applicable to other extended gravitational lenses, like those associated with rich clusters.
3 Strong Lensing on the HDF(N)
3.1 The lens deficit
Over 15,000 radio sources have been scrutinized in the JVAS/CLASS radio surveys (Browne, these proceedings) and they include roughly 25 confirmed gravitational lenses. Allowing for incompleteness etc, it appears that the probability of a distant radio source being multiply imaged by an intervening gravitational lens is roughly 0.003. (The probability for bright quasars is somewhat larger due to magnification bias which is less important for radio sources and faint galaxies.) Now turn to the HDF(N). There are roughly 3000 discernible galaxy images on the roughly 5 sq. arcmin of sky covered by the WFPC2, (giving over the sky) and an expectation of detectable cases of multiple imaging (Hogg et al 1996). There have been quite a few follow up observations, but there are still no convincing examples of multiple imaging (Zepf, Moustakis & Davis 1997, Blandford 1998). (One compelling case has, however, been reported on the HDF(S), cf Barkana, Blandford & Hogg 1999.)
There are two immediate rationalizations of this large difference between the radio and optical lensing rates. The first is that the faint optical galaxies are all at very low redshift and therefore not likely to be multiply-imaged. The second is that the HDF(N) is too small to comprise a fair sample of the lensing sky. In order to explore this matter further, we have carried out a more detailed analysis of the probability of strong lensing rate (cf Blandford, 1999).
3.2 Cross sections and multi-image probability
Images of all of the (roughly 150) galaxies on the HDF(N) with spectroscopic redshifts were prepared and their rest B surface brightness converted into surface density using mass-to-light ratios for disk and elliptical galaxies respectively, together with a simple prescription for passive evolution (eg Vogt 1996). The galaxies were assumed to be isolated with dark matter in their individual halos whose density declines with radius faster than . This ensures that the surface density, which fixes the size of the Einstein ring, is determined by the central, luminous mass. The lack of strong color gradients in the galaxies of most interest suggests that reddening is not a concern.
Given these assumptions, it is possible to compute lensing cross sections for each of these putative lens galaxies assuming that the background sources are all at redshift . The surface potentials were computed from the surface densities using a Fourier method and then the total angular cross section for multiple imaging of a point source was computed and back-projected onto the source plane. The cross sections were all combined and the aggregate for the three WFPC2 chips was sq. arcsec. It was dominated by four elliptical galaxies. None of the spirals contributed significantly to the cross section (cf Kochanek these proceedings). If the HDF(N) is typical, then the multiple imaging probability per bright, distant source should be at most , over an order of magnitude smaller than suggested by the radio surveys.
One worry about this result is that the multiple images might actually be hidden in the cores of the lensing galaxies and have not been recognized as such. This was checked observationally by imaging actual faint galaxies taken from the HDF(N) through the principal lens galaxies. It turned out that the magnified source population was generally recognizable. (It is much easier to see a multiply imaged faint galaxy through an elliptical lens than through a spiral.) Actually as a result of this investigation, it was found that one of the elliptical galaxies contributing significantly to the total cross section did contain a faint, arc-like feature in its nucleus, possibly a merger, but conceivably a lens. Either way it does not change the conclusion that the total cross section for strong lensing over the area of sky covered by the HDF(N) is ten times smaller than average.
3.3 Lensing by Groups
When bona fide radio lenses are examined in detail, it is found that several of them have companion galaxies that are almost certainly contributing to the imaging. Furthermore, upon spectroscopic examination, several of these companion galaxies have similar redshifts to the nominal lens galaxy (eg Kundić et al 1997ab, Lubin et al 2000 in press). This suggests that a good fraction of the radio lens galaxies are ellipticals belonging to compact groups. This inference is consistent with the conclusion of a pencil beam redshift survey of field galaxies which shows that most of the “absorption” line galaxies are in compact redshift groupings Cohen et al (1999).
Groups probably form within substantial dark matter perturbations. Although the surface density of the dark matter alone may not exceed the critical value, it may well be sufficient to enhance the cross section and the size of the Einstein ring in those elliptical galaxies that are located near the centers of the richest and most compact groups, (eg Zabludoff & Mulchaey 1998, Mulchaey & Zabludoff 1998).
Let us make a simple model of a giant elliptical galaxy located at the center of a compact group. We suppose that the dark matter in the group is centered on the galaxy and has a profile, . The galaxy is taken to have a density profile , that is to say it is isothermal in its outer parts which extend to a tidal radius where its density matches that of the group. (We assume that the group velocity dispersion is larger than that in the outer parts of the galaxy .)
The cross section to multiple imaging can be approximated by the solid angle subtended by the Einstein and a straightforward calculation furnishes the estimate
| (2) |
where
| (3) |
(with ), is a measure of the lensing strength of the galaxy and
| (4) |
measures the extra magnification associated with the dark matter in the group. Numerically, and very roughly, for , km s-1, kpc, say, then the cross section for an isolated elliptical galaxy like one of those observed on the HDF(N) is sq arcsec and . Now, if 500km s-1 and kpc, then , doubles and the cross section increase by a factor 24 to sq arc sec, comparable with that observed in group lenses. Although this example is very simple-minded, it does illustrate a general point, namely that the cross section of an elliptical galaxy can be very sensitive to the presence of dark matter in a surrounding group.
Returning to the HDF(N), it appears that it contains (perhaps through selection) no massive elliptical - group combinations with the most propitious redshifts for lensing, . The probability that a particular elliptical - group be aligned with a suitable source and produce a prominent optical ring is, in any case, typically less than , even at intermediate redshift. It is therefore not unreasonable that no lenses have been seen. A larger area of the sky must be imaged to the depth of the HDF(N) to have a fair sample. We do not yet know the redshift distribution of the faint source galaxy population (though this can be ascertained by weak galaxy-galaxy lensing and strong cluster lensing) but it is not required that most faint galaxies are local.
There are three consequences of this interpretation. Firstly, as already reported by Keeton, Kochanek & Falco (1997), lens galaxies should exhibit larger than average mass-to-light ratios. Secondly, the dark matter groups that we postulate to enhance the cross section should be detectable locally as X-ray sources. The matter density in this form has a cosmological density which we estimate to be , roughly ten percent of the total. Thirdly, accurate modeling of the lenses, as we have attempted for B1608+656, should actually require the addition of asymmetric dark matter and this may account for the unusually high proportion of quads. Of course not all galaxy lenses are located in groups or are associated with elliptical galaxies, but it is our contention that a significant fraction will turn out to be so.
A fuller treatment of these ideas will be presented elsewhere.
Acknowledgements.
This research owes much to the careful radio, infrared and optical observations of B1608+656 led by Chris Fassnacht, Tony Readhead and Paul Schechter, respectively. Tereasa Brainerd, Judith Cohen, David Hogg and Lori Lubin are thanked for collaboration on parts of the HDF analysis. Support under NSF grant AST is gratefully acknowledged. RB thanks the Institutes for Advanced Study, of Astronomy and of Theoretical Physics for hospitality and NSF (through grant AST99-00866) for support, respectively.References
- [1] arkana, R. et al 1999 ApJ 520 479
- [2] arkana, R., Blandford, R. D. & Hogg, D. W. 1999 ApJ 513 L91
- [3] landford, R. D. 1999 Proc IAU Symposium 186: Galaxy Interactions at Low and High Redshift ed. J.Barnes & D. Sanders (Dordrecht: Kluwer) 439-446
- [4] landford, R. D. 1998 The Hubble Deep Field ed. M. Livio, S. M. Fall & P. Madau p 245
- [5] landford, R. D. & Kundić 1997 The Extragalactic Distance Scale ed. M. Livio, M. Donahue & N. Panagia Cambridge: Cambridge University Press p 60
- [6] ohen, J. G. et al 1999 ApJ 512 30
- [7] ogg, D. W. 1996 ApJ 467 L73
- [8] eeton, C. R., Kochanek, C. S. & Falco, E. E. 1998 ApJ 509 561
- [9] oopmans, L. & Fassnacht, C. 1999 ApJ 527 513
- [10] undić, T. 1997a AJ 114 507
- [11] undić, T. 1997b AJ 114 2276
- [12] ubin, L. M., Fassnacht, C. D., Readhead, A. C. S., Blandford, R. D. & Kundić 1999 AJ submitted
- [13] ulchaey, J. S. & Zabludoff, A. 1998 ApJ 496 73
- [14] yers, S. al 1995 ApJ 447 L5
- [15] efsdal, S. 1964 MNRAS 128 307
- [16] chechter, P. L. et al 1997 ApJ 491 L7
- [17] ogt, N. 1996 ApJ 465 L15
- [18] allington, S. et al 1996 ApJ 465 64
- [19] abludoff, A. & Mulchaey, J. S. 1998 ApJ 496 39
- [20] epf, S. E., Moustakis, L. A. & Davis, M. 1997 ApJ 474 L1