THE PROPERTIES OF POOR GROUPS OF GALAXIES: III. THE GALAXY LUMINOSITY FUNCTION
Abstract
The form of the galaxy luminosity function (GLF) in poor groups — regions of intermediate galaxy density that are common environments for galaxies — is not well understood. Multi-object spectroscopy and wide-field CCD imaging now allow us to measure the GLF of bound group members directly (i.e., without statistical background subtraction) and to compare the group GLF with the GLF’s of the field and of rich clusters. We use R-band images in degree2 mosaics to obtain photometry for galaxies in the fields of six nearby ( km s-1) poor groups for which we have extensive spectroscopic data (Zabludoff & Mulchaey 1998), including 328 new galaxy velocities (this paper). For the five groups with luminous X-ray halos, the composite group GLF for group members with log log and within projected radii of -1 Mpc from the group center is fit adequately by a Schechter function with log and .
We also find that (1) the ratio of dwarfs (log log ) to giants (log ) is significantly larger for the five groups with luminous X-ray halos than for the one marginally X-ray detected group, (2) the composite GLF for the luminous X-ray groups is consistent in shape with two measures of the composite R-band GLF for rich clusters (Trentham; Driver et al. ) and flatter at the faint end than another (, Smith et al. ), (3) the composite group GLF rises more steeply at the faint end than the R-band GLF of the Las Campanas Redshift Survey (LCRS; from Lin et al. ), a large volume survey dominated by galaxies in environments more rarefied than luminous X-ray groups, (4) the shape difference between the LCRS field and composite group GLF’s results mostly from the population of non-emission line galaxies (EW [OII] Å), whose dwarf-to-giant ratio is larger in the denser group environment than in the field (cf. Ferguson & Sandage, Bromley et al. ), and (5) the non-emission line dwarfs are more concentrated about the group center than the non-emission line giants, except for the central, brightest () group elliptical (BGG). This last result indicates that the dwarfs, giants, and BGG occupy different orbits (i.e., have not mixed completely) and suggests that some of the populations formed at a different times.
Our results show that the shape of the GLF varies with environment and that this variation is due primarily to an increase in the dwarf-to-giant ratio of quiescent galaxies in higher density regions, at least up to the densities characteristic of X-ray luminous poor groups. This behavior suggests that, in some environments, dwarfs are more biased than giants with respect to dark matter. This trend conflicts with the prediction of standard biased galaxy formation models.
Subject headings: galaxies: luminosity function — galaxies: evolution — galaxies: clusters: general — cosmology: large-scale structure of Universe
University of California at Santa Cruz, Santa Cruz, CA 95064
aiz@ucolick.org
and
813 Santa Barbara St., Pasadena, CA 91101
mulchaey@pegasus.ociw.edu
Accepted for publication in The Astrophysical Journal
1 Introduction
The shape of the galaxy luminosity function (GLF) in a given environment is determined by the initial distribution of galaxy luminosities and by the subsequent galaxy luminosity and number density evolution. Both the initial luminosity and the luminosity/density evolution may depend on environment, causing a variation in dwarf-to-giant ratio () with environment. For example, the standard model of biased galaxy formation predicts that giant galaxies are more likely than dwarfs to form in regions of high mass density (cf. White et al. 1987). After galaxy formation, may be altered by mechanisms whose efficiency is strongly environment-dependent, e.g., galaxy-galaxy mergers are probably more frequent and global tidal fields weaker in poor groups than in rich clusters of galaxies (cf. Zabludoff & Mulchaey 1998, hereafter ZM98). A new class of cosmological models involving “locally biased” galaxy formation (cf. Kauffmann et al. 1997; Narayanan et al. 1998; Kravtsov & Klypin 1999) has been introduced to modify standard biased galaxy formation and to account for more complex environmental effects on galaxy evolution. Despite some recent progress, observational uncertainties have prevented the behavior of the GLF with environment from becoming a useful constraint.
Most observational determinations of the GLF to date have focused on the field and rich clusters. The GLF is even more uncertain in regions of intermediate galaxy density, like poor groups, that are common galaxy environments. To better constrain the models, and thus the relative effects of environment-dependent galaxy formation and environment-driven galaxy evolution, we must ascertain (1) whether the GLF of poor groups is universal, (2) whether the group GLF differs from the GLF’s of rich clusters and the field, (3) what galaxy populations are most responsible for any environmental differences (e.g., star forming or quiescent galaxies), and (4) whether the GLF varies with local environment within a group itself.
Past determinations of the shape of the poor group GLF differ widely. Some composite group GLF’s are consistent with the field GLF (Muriel et al. 1998; Zepf et al. 1997), and others suggest a relative depletion of faint galaxies (as reviewed by Hickson 1997) or a dip in galaxy counts at log (Hunsberger et al. 1998). Some of the uncertainty arises because the number of known members per group is often small: bound groups cannot be distinguished from chance superpositions of galaxies along the line-of-sight, and the GLF cannot be calculated without statistical background subtraction, a procedure sensitive to inhomogeneities in the large-scale structure (especially for low surface density contrast groups). Furthermore, it is difficult to compare existing group GLF’s with those of the field and rich clusters, because previous studies focus almost exclusively on Hickson Compact Groups (HCG’s; Hickson 1982), which are defined by their unusually concentrated bright galaxy population and thus represent only one subset of groups in general.
The first step in addressing these problems is to identify a sample of poor groups with (1) the properties of bound systems, i.e., where there is evidence that members lie in a common potential well, (2) a large number of spectroscopically-confirmed members in each system, and (3) galaxy environments different than those explored in past work. In ZM98a and MZ98, we found that poor groups with luminous, extended X-ray halos also have significant dwarf populations and that global X-ray properties such as luminosity and temperature are well-correlated with global optical properties like galaxy velocity dispersion. These results argue that the members of an X-ray luminous group are bound.
The large number of known members (-60) in each X-ray group not only renders background subtraction unnecessary, but also makes statistically significant comparisons possible. In particular, we can learn whether this class of bound groups has a common GLF, and, if not, what galaxy populations are responsible for the differences. Furthermore, we can test whether the spatial distributions of distinct galaxy populations within groups are consistent with any global, density-dependent trends observed when comparing GLF’s of the field, poor groups, and rich clusters.
The shape of the GLF for members of poor, X-ray luminous groups also provides insight into galaxy evolution in an environment that has not been isolated previously. Field studies such as the Las Campanas Redshift Survey (LCRS; Lin et al. 1996) are dominated by galaxies in even more rarefied environments than X-ray luminous groups (i.e., by members of poorer groups and by galaxies outside of associations). Many HCG’s and other optically-selected poor group candidates do not have a hot, extended intragroup medium. In contrast, some properties of X-ray luminous groups are consistent with an extrapolation of rich cluster properties to lower masses (MZ98; ZM98b). A direct comparison of the GLF’s for these groups, rich clusters, and the field has yet to be made.
In this paper, we combine multi-object spectroscopy and wide-field CCD imaging of a sample of five nearby, X-ray luminous poor groups, including three non-HCG’s, to determine the form of the group GLF. For comparison, we also discuss the properties of a sixth group, NGC 3557, that is marginally X-ray-detected. We describe the group sample, the photometry, and the spectroscopy in Section 2. Section 3 contains the GLF determinations for individual groups, a comparison of the composite GLF for the five X-ray luminous groups with the GLF’s for rich clusters and the field, an analysis of the relative contributions of star forming and quiescent galaxies to the differences between the group and field GLF’s, and a comparison of the spatial distributions of dwarf and giant group members. Section 4 reviews some of the implications of our results for models of galaxy formation and evolution. Our conclusions are summarized in Section 5.
2 The Observations
2.1 The Group Sample
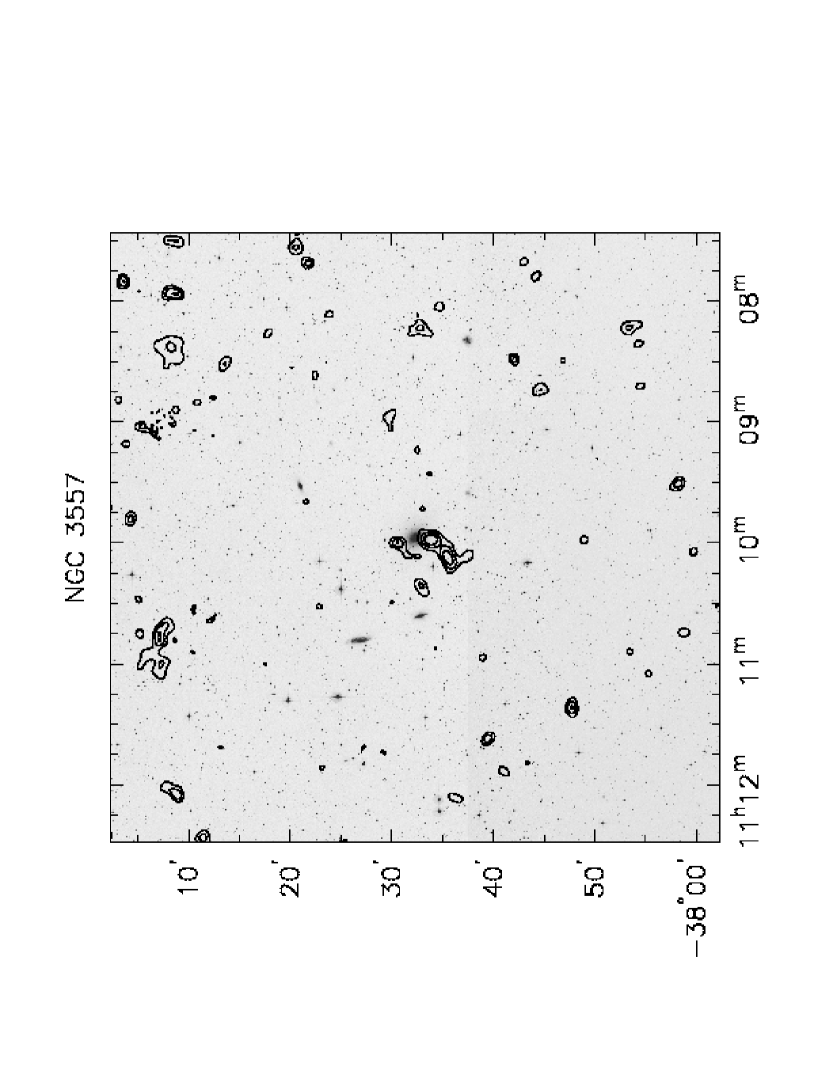
A poor group is defined optically as an apparent system of fewer than five bright () galaxies. To isolate the form of the GLF in poor groups with luminous X-ray halos, we examine five X-ray-detected poor groups originally discussed in ZM98. All five groups have extended ( 100 h-1 kpc), luminous ( 1042 h-2 erg s-1) X-ray emission imaged by the ROSAT Position Sensitive Proportional Counter (PSPC) (Mulchaey & Zabludoff 1998; hereafter MZ98). For comparison, we obtain galaxy spectroscopy and photometry for a sixth group, NGC 3557, that is marginally-detected by ROSAT ( 1040 h-2 erg s-1) and that has an asymmetric, unrelaxed X-ray morphology (Figure 1). The X-ray temperature of NGC 3557 is also significantly lower ( 0.5 keV), than is typical for the X-ray luminous groups ( 1 keV), although NGC 3557’s temperature is poorly constrained due to the group’s relatively low X-ray luminosity. Because NGC 3557 extends over an optical radius comparable to that of the other groups, its lower temperature implies a lower mass density. This argument is supported by NGC 3557’s relatively low galaxy number density and velocity dispersion (cf. Table 2). The six groups have mean velocities of km s-1, virial masses of , and a brightest group galaxy (BGG) that is a giant elliptical located in the group center (cf. ZM98a).
2.2 Spectroscopic Data
We obtained spectra for 742 galaxies in the six sample groups with the multi-fiber spectrograph (Shectman et al. 1992) and 2D-Frutti detector mounted on the du Pont 2.5m telescope at the Las Campanas Observatory. Of these spectra, 328 are new observations, and the remainder are from ZM98. To define galaxy targets in each group field over the degree2 field of the fiber spectrograph, we used coordinates, star/galaxy classifications, and relative magnitudes from FOCAS (Jarvis & Tyson 1981) and the STScI Digitized Sky Survey. The uncalibrated, relative magnitudes drawn from the plate scans were sufficient to identify the brightest galaxies in each field. For each group, we observed 1-3 fiber fields, starting with the brightest galaxies. The completeness of the spectroscopic sampling of each group field as a function of galaxy magnitude is discussed in the next section and in .
We determine radial velocities from the spectra using the cross-correlation routine XCSAO and the emission line finding routine EMSAO in the RVSAO package in IRAF (Mink & Wyatt 1995). The velocities in Table 1 are either emission line velocities, absorption line velocities, or a weighted average of the two (see Shectman et al. 1997 (their ) or Lin 1995 for a discussion of the cross-correlation templates and the spectral lines typically observed). We compute velocity corrections to the heliocentric reference frame with the IRAF/HELIO program. See ZM98 for a dicussion of the velocity zero-point correction and external velocity error determinations.
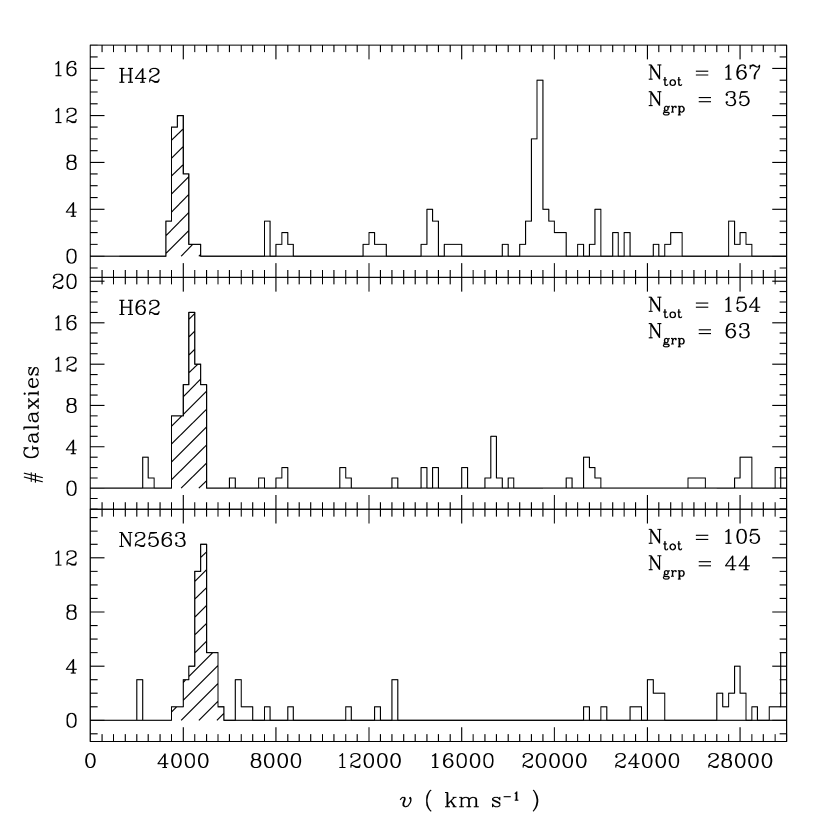
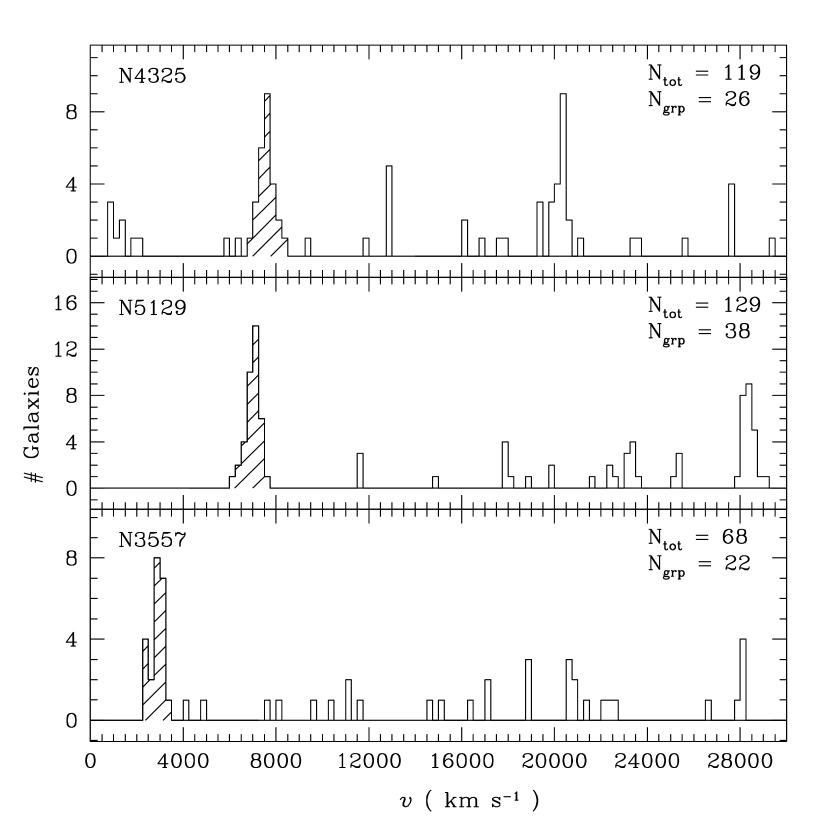
The distribution of galaxy velocites, the total number of galaxies with velocities (), and the number of group members () in each of the six fields are shown in Figure 2.
2.3 Photometric Data
We acquired images for the six groups under photometric conditions using the 40-inch telescope at Las Campanas Observatory during October 1996 and February 1997. The detector was a Tektronics 20482 CCD with a field of view of 23.8′ on a side. To cover the entire degree2 area of our fiber spectroscopy field, we obtained a mosaic in all cases except for the more distant NGC 4325 group, for which a mosaic was sufficient to image nearly all of the spectroscopically-confirmed group members. Each tile of the mosaic has a overlap with an adjacent tile.
The total exposure time for each tile is 5 minutes with a Kron-Cousins R filter from the Harris set. The typical seeing was 1.5′′. We reduce the images using standard techniques in IRAF. The bias level is determined from the overscan region of the CCD and subtracted from the images. Flat-fielding is accomplished using dome flats. The images are flux-calibrated using standard star fields in Graham (1982).
Once the images are calibrated, we use the program SExtractor (Bertin & Arnouts 1996) to classify objects as stars or galaxies and to measure total magnitudes. For the purposes of this study, we consider all objects with a “stellarity-index” of less than 0.5 as galaxies. To verify that this classification is valid, we examine plots of isophotal surface area versus magnitude for each field. These plots indicate that the star/galaxy separation is typically valid down to . However, a small fraction of the images (less than 10%) were taken under poor seeing conditions ( 2.5′′). In these cases, the star/galaxy separation is less robust. To quantify the success of the SExtractor classification for these fields, we visually classify the objects in one group, HCG 62. We find that the SExtractor classification is consistent with our visual classification for all objects brighter than . In the range , the two methods yield consistent results 85% of the time.
In most cases, total magnitudes are measured using a method similar to that proposed by Kron (1980). However, the Kron method relies on aperture magnitudes, which are sensitive to crowding in the field. Thus, if a galaxy has nearby neighbors, the Kron magnitude may be inaccurate. A better estimate of the true magnitude in these cases is a corrected isophotal magnitude (see discussion in the SExtractor manual). Therefore, we adopt the ‘MAG_BEST’ option in SExtractor, which computes a corrected isophotal magnitude when crowding is a problem and a Kron magnitude otherwise. For the six group fields, the Kron method is used to calculate the total magnitude in more than 80% of the galaxies.
We estimate the errors in the ‘MAG_BEST’ R magnitudes obtained from SExtractor in several ways. Because the CCD mosaic tiles overlap, about 30% of the galaxies are imaged more than once. From these multiple measurements, we estimate that the typical internal magnitude errors are about 0.05 mag. These errors are consistent with the median of those output by SExtractor for galaxies brighter than about . A few of the galaxies have previously measured total magnitudes in the R band listed in the NED database. A comparison of these magnitudes with our data yields a median external error estimate of about 0.15 mag. While total R magnitudes only exist for a handful of our targets, many others have R-band aperature measurements in the literature. A comparison of our photometry with that in the literature in the same size aperture is consistent with our external error estimate derived from the comparison of total magnitudes.
The completeness of the spectroscopic survey of each group field is shown in Figure 3. For each bin, we indicate the fractional completeness of the spectroscopic data relative to the photometric catalog of SExtractor-identified galaxies. In the case of NGC 4325 and of NGC 5129, there are two distributions of — one for the entire spectroscopic/photometric catalog and the other sampled within a smaller radius of 0.6-1 to make it consistent with the sampling radii (-1 Mpc) for the other groups. Note that we use the smaller radius sample for all subsequent analyses involving NGC 4325 and NGC 5129.
As a complement to this paper, we have submitted a table of the galaxies in each group field with measured velocities to the NASA/IPAC Extra-galactic Database ((NED), Helou et al. 1991). This table contains the galaxy name, J2000 coordinates, heliocentric velocity and error, type of velocity measurement (i.e., from absorption lines “0”, emission lines “1”, or a combination of both “2”), and R-band total magnitude for the 742 galaxies with measured velocities. Table 1 shows an example of the format. The full table is also available in electronic form from the authors on request.
Table 2 summarizes the properties of the six sample groups, listing the group name, projected centroid calculated from the coordinates of the group members in J2000 (unweighted by galaxy luminosity), number of members (), mean heliocentric velocity (), line-of-sight velocity dispersion (), total X-ray luminosity (), sampling radius for the photometry (; same as in Figure 4), number of members within (), corrected number density of galaxies with log , within 0.4-1 Mpc of the group center, and assuming spherical symmetry (), and dwarf-to-giant ratio for galaxies with log and within 0.4-1 Mpc (; defined as in ).
3 Results
3.1 Individual Group GLF’s
Is the GLF universal among poor groups of galaxies? For a sample consisting of five groups and the Virgo and Fornax clusters, Ferguson and Sandage (1991) argue that the early type dwarf-to-giant ratio increases with the richness of the system. However, as discussed by those authors, the interpretation of their results is complicated by the lack of spectroscopic data and inhomogeneities in the radial sampling of the group and cluster images. With spectroscopic surveys of galaxies in the fields of poor groups (ZM98a; MZ98; this paper), we can ascertain more directly which groups are likely to be bound systems instead of chance superpositions and which galaxies are group members instead of interlopers.
Our earlier work suggests significant differences in as a function of local mass density — although the number of giant group members is comparable, groups that are X-ray detected have higher velocity dispersions (200-450 km s-1 vs. km s-1) and larger memberships (20-50 galaxies vs. galaxies) than non-X-ray-detected groups (also see Hunsberger et al. 1998). Unfortunately, the small number of members in the non-X-ray groups prevents us from determining if they are bound. Therefore, to test whether does vary with mass density, we compare the individual group GLF’s for a sample of six X-ray-detected groups, including N3557, a marginal detection and lower mass density environment.
The distribution of galaxy luminosities for each group is shown in Figure 4. The absolute magnitudes are calculated for a km s-1 Mpc-1, cosmology. For each group, we apply a global extinction correction of , where is the extinction in the B-band at the group’s center (NED) and the conversion factor is estimated from the extinction curve of Schild (1977). The GLF’s are also corrected for incompleteness (see Figure 3) by assuming that, within each magnitude bin, the fraction of galaxies without velocities that are group members is the same as the fraction of measured galaxies that are members. Down to log , the faint limit of our subsequent analyses, the completeness corrections are small for each group (i.e., the corrected and uncorrected counts are consistent within the counting errors). Note also that for these completeness corrections, HCG 42, HCG 62, and NGC 3557 are complete within the log bin.
To test whether the distributions of galaxy luminosities differ among the groups, we calculate a dwarf-to-giant ratio, . We define giants as galaxies with log (corresponding to ) and dwarfs by the range log log (corresponding roughly to to , our faint end completeness limit; ) 111Note that unlike Ferguson & Sandage (1991), who used galaxy surface brightness to both assign group membership and to separate early type dwarfs from giants, we separate the dwarf and giants samples by galaxy luminosity. Another difference is that the faint end limits of our survey are typically magnitudes brighter.. To ensure that is calculated uniformly for all the groups, we consider only members within 0.4-1 Mpc of each projected group center and completeness-correct the counts (; see Table 2).
We calculate the errors in by assuming Gaussian counting statistics (which are indistinguishable from the true Poisson errors for all but the brightest bins in Figure 4). The errors for the completeness-corrected counts are determined with standard error propagation. The assumption of counting errors does not reflect an intrinsic uncertainty in the number of galaxies in any magnitude bin (for log , the bins are complete or nearly so and the only source of error is magnitude uncertainties). Instead, the errors provide estimates of how well the individual group GLF determines the universal GLF (if it exists). Because these errors assume that all groups are drawn from the same parent GLF, they are useful in testing whether the group ’s are statistically different from one another.
The values for the five groups with X-ray luminous halos are not statistically different. However, the relative dearth of log log galaxies in the galaxy luminosity distribution of NGC 3557 compared with the X-ray luminous groups produces a lower . The composite of the five X-ray luminous groups (computed by normalizing each group’s GLF to that of HCG 42 and averaging; see ) is , which differs at the level from NCG 3557’s value of . For comparison, the Local Group’s is roughly in this magnitude range (Grebel 1999).
Although is lower in the NGC 3557 group than in the other groups down to our completeness limit of log , NGC 3557’s galaxy luminosity distribution rises at fainter magnitudes (even the uncorrected, lower-limit counts rise). Deeper spectroscopic surveys of the other, more distant groups will determine whether the behavior of their extreme faint end GLF’s is similar to that of NGC 3557. The “dip” in NGC 3557’s GLF is roughly consistent in shape with the composite GLF for mostly non-X-ray luminous Hickson Compact Groups observed by Hunsberger et al. 1998, who suggest that dynamical friction and galaxy mergers cause intermediate luminosity galaxies to acquire mass and to move to the bright end of the GLF in some poor groups. The low specific globular cluster frequency and high rotational velocity of NGC 3557 itself are consistent with a merger product (van den Bergh 1986). Additional explanations for differences among the GLF’s of groups are discussed in .
The results of this section suggest that the GLF is not universal among poor groups and that may increase with the mass density of the group environment. In the next section, we examine whether this trend in continues from the field to poor groups to rich clusters.
3.2 Composite Group GLF
Because luminous, extended X-ray emission suggests a common potential well and is roughly correlated with the number density of group galaxies, the fraction of early type members, and the group velocity dispersion (ZM98; MZ98), a sample of X-ray luminous groups is likely to contain a higher fraction of bound systems than a sample of group candidates identified only as galaxy concentrations in velocity space and on the sky. As a result, determining the GLF for X-ray luminous groups is an important first step in isolating the effects of group environment on the evolution of galaxies. With our sample, it is now possible to compare the shape of the GLF in three distinct environments: the Las Campanas Redshift Survey of the field, X-ray luminous groups, and rich clusters of galaxies.
We construct a composite GLF from the five groups with luminous X-ray halos by arbitrarily normalizing each to have the same number of completeness-corrected galaxy counts brighter than log as HCG 42. We then average the five individual, completeness-corrected group GLF’s. This procedure ensures that the shape of the composite GLF is not weighted more by groups like HCG 62 and NGC 2563, which have relatively high galaxy densities. Because HCG 42 and HCG 62 are complete to within a factor of two for galaxies with log log , we average the corrected galaxy counts for these two groups only to obtain the composite point for that bin. However, only the five bins brighter than log are used in subsequent determinations of .
The composite GLF for group members with log log and within projected radii of -1 Mpc from the group center is consistent with a Schechter function of form log and (Figure 5). Figure 5 also shows two composite GLF’s for rich clusters (Trentham 1997 (includes Coma), Driver et al. 1998) and the GLF for the Las Campanas Redshift Survey (hereafter LCRS) of the field (Lin et al. 1996). The field and cluster GLF’s are normalized so that the number of galaxies brighter than log , roughly the completeness limit for the group and LCRS samples, is the same as for the group composite. The completeness of the cluster samples, as derived from background-subtracted, not spectroscopic, counts, is estimated to be one or two magnitudes fainter. The two cluster GLF’s, which are calculated from different cluster samples, are consistent with one another within the errors except in the log bin. The cluster galaxies in this bin contribute little ( for Trentham, for Driver et al. ) to the total number of giants with log , and thus the D/G’s of the two cluster samples are similar.
Although we have measured most or all of the group members brighter than log in each group, the statistics of the group sample are not adequate to distinguish among different functional forms for the composite GLF (e.g., between the single Schechter function and a two-component fit (cf. Hunsberger et al. 1998). Over this magnitude range, the cluster and LCRS GLF’s are also well fit by single Schechter functions, and the composite group data, not the fit, are compared to these GLF’s in the next two sections. Even the addition of NGC 3557, whose GLF suggests a non-Schechter functional form (cf. Figure 4), does not significantly alter the composite (i.e., the Schechter function is not excluded by a fit, and and are within the original errors).
We stress that the field, group, and cluster GLF’s in Figure 5 do not represent the absolute contribution of each environment to a unified GLF, as the normalizations are arbitrary. Instead, the shape of each GLF suggests the typical luminosity distribution of member galaxies in that environment. To properly normalize the composite group GLF for bound groups over the mass range of our sample (-), we would need to know what fraction of groups cataloged from optical redshift surveys are bound and what fraction of bound groups have luminous X-ray halos, marginal X-ray detections, or non-X-ray-detections.
3.2.1 Comparison with Rich Clusters
How do the GLF’s for poor groups compare with those for rich clusters of galaxies? Determinations of individual cluster GLF’s vary in part due to differences in observed waveband (cf. Wilson et al. 1997) and in mean sample redshift, factors that are sensitive to morphology and/or star formation history. However, as in the case of poor groups, there is evidence for intrinsic variations among the GLF’s of rich clusters (cf. López-Cruz et al. 1997; Driver et al. 1998). To investigate whether there are global trends in the shape of the GLF from poor groups to rich clusters, we compare our R-band composite GLF for X-ray luminous groups with three composites of nearby () clusters in the R-band (Trentham 1997, Smith et al. 1997, and Driver et al. 1998).
Figure 5a shows that our composite GLF and those derived from four rich clusters (Trentham 1997) and from seven other rich clusters (Driver et al. 1998) are consistent down to log and also over the extrapolation of the group GLF one magnitude fainter (a test is unable to distinguish at the confidence level among the three GLF’s over these magnitude ranges). Smith et al. derive a somewhat steeper faint end slope from a composite of three rich clusters ( vs. ). The Trentham and Driver et al. GLF’s are constructed from Kron total magnitudes (Smith et al. use isophotal magnitudes), which are typically equivalent to the SExtractor ‘MAG_BEST’ magnitudes () in our group GLF. All three cluster GLF’s are determined using statistical background subtraction.
In fitting their cluster composite, Smith et al. obtain a slightly better fit using two Schechter functions instead of one (both the one- and two-Schechter fits have steeper faint end slopes than Trentham and Driver et al. over the magnitude range of our data). Smith et al. include the Coma cluster, which has either a sharp rise that exceeds a single Schechter function at faint magnitudes or an actual dip due to a relative deficit of dwarf galaxies with log (Secker & Harris 1996). The Coma cluster is highly complex, with several recently accreted groups. If some of these infalling groups have GLF’s that are better fit by two components (cf. Hunsberger et al. 1998; Koranyi et al. 1998), the overall shape of the Coma GLF may be determined in large part by the contributions of those subclusters (cf. Secker & Harris 1996). This suggestion is supported by the consistent dwarf-to-giant ratios of Coma and of the similarly complex, but poorer, Virgo cluster (Thompson & Gregory 1993).
Differences among the GLF’s of individual groups and rich clusters might result from an environment-dependent combination of type specific GLF’s (Binggeli, Sandage, & Tammann 1988; Jerjen & Tammann 1997). It is also possible that two galaxies of the same initial morphology might experience different density and/or luminosity evolution depending on their environment, leading to evolution in the type-specific GLF’s. For example, López-Cruz et al. (1997) and Driver et al. (1998) find a different trend among clusters than we do among groups and than Thompson & Gregory (1993) and Valotto et al. (1997) find among other clusters — namely, that dwarf-to-giant ratio decreases with increasing global projected galaxy density. Driver et al. observe the effect only outside the core, a region more sensitive to background subtraction and cluster substructure. However, their result suggests that the trends in among poor groups and from the field to poor groups may be reversed in some rich clusters by a different galaxy evolution history.
While the details of the inter-dependence of galaxy type, luminosity, and environment await future surveys, we conclude here that the typical of rich clusters is either consistent with (cf. Trentham 1997, Driver et al. 1998) or larger than (cf. Smith et al. 1997) that of X-ray luminous poor groups.
3.2.2 Comparison with LCRS Field
Estimates of the luminosity function of galaxies in the nearby () field vary as much as the observed GLF’s for rich cluster members. As in the case of the cluster GLF, the uncertainty in the field GLF arises in part from the difficulty in translating the different photometric filters employed by redshift surveys into the same band. Such translations may ignore potentially important effects, including the initial selection of galaxies from different bands, variations in galaxy color with absolute magnitude (e.g., the “mass-metallicity relation”), and intrinsic differences between the dwarf-to-giant ratios of blue and red galaxies (witness the differences between the emission and non-emission line GLF’s discussed in ). It is therefore essential to compare our R-band composite group GLF with a R-band GLF of the field.
Another issue is how fairly a given survey samples the nearby universe. For example, it is possible that high density environments are overrepresented in the R-band CfA Century survey (Geller et al. 1997), which contains portions of the Corona Borealis supercluster and of seven Abell clusters (including Coma). In contrast, the larger, R-band Las Campanas Redshift Survey (LCRS; Shectman et al. 1996) is known to be dominated by galaxies in environments more rarefied than X-ray luminous groups. Fully (18590 out of 21343; cf. Tucker et al. 1998) of LCRS galaxies lie outside of poor groups or in groups that have lower velocity dispersions ( km s-1), and presumably lower mass densities, than groups in our X-ray sample. Although this fraction may be overestimated relative to the “true” field due to that fiber survey’s tendency to undersample overdense regions, the LCRS is an appropriate choice for comparing our GLF for X-ray luminous, poor group members with that for galaxies in typically less dense environments.
Figure 5b shows the GLF of the composite of the X-ray luminous groups and the best Schechter fit to the LCRS field survey GLF (Lin et al. 1996). If the arbitrary LCRS normalization is adjusted to minimize with respect to the group GLF for galaxies brighter than the estimated LCRS completeness limit of log (Lin et al. 1996), the LCRS field GLF is excluded at the level. (The best normalization is in fact lower than that shown). Relative to the field, poor groups with luminous X-ray halos have either a deficit of giants, an excess of dwarfs, or a combination of both effects.
The difference between the LCRS field and the poor group composite is not due to the difference between the isophotal magnitudes used in the LCRS GLF and SExtractor ‘MAG_BEST’ magnitudes calculated for the group members. From the galaxies in our sample with (the magnitude range used to calculate the group GLF), we estimate that the isophotal to ‘MAG_BEST’ magnitude correction to the LCRS GLF is typically . This value is consistent with that estimated by Lin et al. (; 1996). Applying this correction, which increases slightly towards fainter magnitudes, only furthers the disagreement between the LCRS field and the composite group GLF’s in Figure 5b.
Incompleteness in the LCRS is unlikely to be the source of the trend towards higher in the denser, group environment. First, we compare the group and LCRS samples only down to the estimated limit above which the LCRS is completeness-corrected (Lin et al. 1996)222We address the possibility of type-dependent incompleteness in .. Second, the observed increase in with density is consistent with the results of an analysis of the LCRS itself (Bromley et al. 1998), where any faint incompleteness in the galaxies would be either uniform across the sample or greater in higher density regions. Third, it is suggestive that the only other large R-band survey of the nearby field (the CfA Century survey, Geller et al. 1997) has both a higher average galaxy density and a larger dwarf-to-giant ratio than the LCRS ( vs. , respectively).
In summary, increases from the LCRS field, which is dominated by galaxies in poorer groups and outside of groups, to groups with X-ray luminous halos.
3.3 Star Forming vs. Quiescent GLF’s
Is it possible to isolate the galaxy population most responsible for the increase in the between the field and X-ray luminous groups? Ferguson & Sandage (1991) suggest that the differences between the dwarf-to-giant ratios of groups and clusters are due mostly to an increase in the early-type dwarf-to-giant ratio with richness. A recent analysis of the LCRS (Bromley et al. 1998) using spectroscopically-defined galaxy morphologies also finds that the early type dwarf-to-giant ratio increases with local density. By analyzing the emission line characteristics of the group and LCRS galaxies, we can divide the data into star forming and non-star forming (quiescent) galaxies. As in Lin et al. 1996, we define star forming group members as those with [OII] EW Å (approximately the Galactic value). Galaxies with a weaker or non-detectable [OII] line are classified as quiescent.
The GLF’s for the divided samples are shown in Figure 6. For both the LCRS and the group samples, the GLF for star forming galaxies rises more steeply than that for quiescent galaxies. The two GLF’s for the LCRS sample are each normalized to have the same number of galaxies brighter than log as the corresponding composite group GLF’s.
For the five brightest bins (corresponding roughly to the LCRS completeness limit), the quiescent galaxies in the LCRS field and in the X-ray luminous groups have different GLF’s, i.e., adjusting the relative normalizations to minimize excludes the field sample at % confidence. The minimization also forces the normalization lower than plotted, increasing the differences between the field and the groups at the faint end. In contrast, the star forming galaxies have roughly consistent GLF’s down to the log bin (the minimization test does not distinguish between the two star forming GLF’s).
One potential problem in interpreting these results is that noise in a spectrum can be mistaken for an [OII] emission line. Therefore, in the case of low signal-to-noise spectra (i.e., dwarfs), it is possible to overestimate the number of star forming galaxies. We test the magnitude of this effect by applying an [OII] flux cut of to the star forming sample. Although the number of group members classified as star forming is reduced from 48 to 26, and the number of quiescent galaxies is correspondingly increased, the resulting GLF’s are consistent with those in Figure 6.
Another consideration is that the mean redshift of the LCRS galaxies is higher than for the group sample ( vs. 0.017, respectively). As a result, the fixed size of the spectroscopic fiber subtends, on average, different physical radii for the LCRS and group samples. Because of this aperture bias, light is sampled within the inner -1 kpc of a group galaxy at the average survey depth, in contrast to the -1 kpc sampling typical of LCRS galaxies. However, aperture bias is unlikely to significantly affect the star forming/quiescent galaxy classifications and the disagreement between the group and field GLF’s for the following reasons. The dominant effect of aperture bias would be to prevent the detection of HII regions in the disks of group members, causing some star forming galaxies to be misclassified as quiescent. This problem is rare because the effect is only significant for face-on galaxies (inclined disks tend to have HII regions along the line-of-sight). For example, few emission line spirals are classified as non-emission line galaxies (about 1 of 12 within 15000 km s-1; Zaritsky, Zabludoff, and Willick 1995). Not only are the effects of aperture bias on the GLF’s (arbitrary) normalization small, but they are unlikely to alter the GLF’s shape, the basis of our comparison of the group and field populations.
One way to artificially reproduce the trends in Figure 6 is to stipulate that many faint emission line dwarfs are missing from the LCRS and that environmental conditions in groups convert them to non-emission line dwarfs. However, this model is problematic. First, such a transformation between star forming and quiescent dwarfs is unlikely. Although mechanisms like tidal stripping or “galaxy harassment” (Moore et al. 1996; Moore et al. 1998) have been proposed for transforming star forming irregulars or Sd’s into quiescent spheroidals, studies of dIrr’s and dE’s in Virgo show that the structures defined by the old stellar populations differ significantly between the two types of dwarfs. For example, the dIrr’s have more flattened and asymmetric stellar light distributions, and no dIrr’s have H-band luminosities or surface brightnesses as high as those of the brightest dE’s (James 1991).
Second, incompleteness in the LCRS does not affect our results significantly. Huchra (1999) argues from the B-band CfA2 redshift survey that the LCRS selection criteria exclude more faint, low surface brightness galaxies than are corrected for by Lin et al. (1996) and that these galaxies have mostly emission line spectra. Even if it were simple to compare B-band data directly with the R-band LCRS (and, for the reasons cited earlier, it is not), the following argument suggests that the effects of any missing galaxies are small by showing that the combination of incompleteness and of dwarf transformation leads to consequences that we do not observe.
Is it possible to transform the field GLF into the group GLF by changing field emission line dwarfs into group non-emission line dwarfs? We define the total number of field galaxies at log that will become group galaxies as , where and are the number of star forming and quiescent dwarfs, respectively, in the field. The final number of group galaxies in the log bin is then , where and are the star forming and quiescent group dwarfs, respectively. First, we correct for the “missing” field dwarfs. The difference between the CfA2 and LCRS emission line galaxy counts at log is a factor of (Huchra 1999). The difference between the LCRS emission line and non-emission line counts in this bin is a factor of (Lin et al. 1996, as opposed to the arbitrary relative normalization shown in Figure 6). If we “correct” the LCRS emission line counts by the CfA2 value, the ratio of emission to non-emission line counts in the field is at log , i.e., . Second, we measure the ratio of group emission to non-emission line dwarfs. Figure 6 shows that . Therefore, , and this model predicts that the final ratio of quiescent dwarfs in groups to those in the field would be at log , while the ratio for giants does not change. This result is at odds with Figure 6, in which only a boost of at most in the number of quiescent field dwarfs relative to giants is required to match the observed group population. The model, in which many faint emission line dwarfs are missing from the LCRS and are converted by group environment into non-emission line dwarfs, over-predicts the ratio of quiescent group dwarfs to quiescent group giants. Because the model is wrong, the effects of LCRS incompleteness on our results are likely to be small.
In summary, we find in this section that the quiescent in groups is significantly larger than that of the field. This result indicates that quiescent dwarfs are more clustered than quiescent giants, although it is not clear whether an excess of dwarfs, a deficit of giants, or some combination of both effects, is responsible.
3.4 Spatial Distribution of Dwarfs vs. Giants
In previous sections, we find that increases with mass density among groups, that increases from the field to groups (and may continue to increase from groups to clusters), and that a change in the of non-star forming galaxies is the cause of the increase from the field to groups. Therefore, if this trend is real, we might expect to increase within groups from the outskirts to the denser core. Such behavior would be opposite to the effect of mass segregation and to the prediction of standard biased galaxy formation. Ferguson & Sandage (1991) identify no radial gradients in the surface brightness-defined dwarf-to-giant ratio in their study of the Virgo, Fornax, and Antlia systems. The luminosity-defined dwarf-to-giant ratio of rich clusters in the Driver et al. (1998) sample rises from the inner (-1 Mpc) to outer (-1 Mpc) annulus for some systems and falls for others. Here we test for such gradients in our luminosity-defined .
First we compare the kinematic and spatial distributions of the BGGs, dwarfs, and giants for all six groups (Figure 7ab). Figure 7a is the composite phase space diagram for the 123 quiescent galaxies. The y-axis shows the velocity offset of the galaxy from the mean velocity of the group, the x-axis shows the projected radial offset from the projected group centroid normalized by the group velocity dispersion. The six sample galaxies with . are marked by asterisks and include four BGG’s333The BGG of NGC 4325 is star forming, and the BGG of HCG 62 is fainter than ., which are consistent with the kinematic and spatial center of their groups (ZM98a). There is also an apparent concentration of dwarfs (small filled circles) toward the group center relative to giants (large open circles).
To compare the distributions of the samples on the sky and in velocity space simultaneously and quantitatively, we define the statistic , where and are the deviations in and for the entire sample (cf. ZM98). Thus, a galaxy that has a large peculiar motion and/or that lies outside the projected group core will have a larger value than a galaxy at rest in the center of the group potential. The distributions of for the four BGGs and two other galaxies (heavily shaded), 56 giants (shaded), and 61 dwarfs (unshaded) are in the right-hand panel. A Kolmogorov-Smirnov test indicates that the dwarf and giant (and the and giant) samples differ from one another at the confidence level. No one group is responsible for this difference (e.g., removing NGC 3557, the marginally X-ray-detected group, does not affect the outcome). This result suggests that the BGG, dwarf, and giant populations occupy different orbits (i.e., have not mixed completely).
Figure 7b suggests that the 49 galaxies with significant [OII] emission tend to lie outside the group core and to have larger peculiar velocities than the quiescent galaxies. In fact, the overall distribution in Figure 7b differs from that in Figure 7a at the % level. As in the case of the quiescent galaxies, the distributions for the 36 emission line dwarfs and 12 emission line giants are significantly different (at the level). The values for the dwarfs are typically smaller (also as in Figure 7a), implying that the star forming dwarfs are more concentrated radially and/or in velocity space than the star forming giants.
To examine how varies with radius, and thus with mass density, we focus on the larger sample of quiescent galaxies. Figure 8 shows in three radial bins for the quiescent galaxies of each group in Figure 7a. A Spearman rank-order test yields a strong correlation coefficient of , which is significant at the level. (The middle point for HCG 42 is not plotted, because the group has no giant members within this annulus. However, if we assume conservatively that the missing point has the highest rank in the sample, the Spearman coefficient is still significant at the level.) The trend is likely to be even steeper than shown in Figure 8, because the sample includes two Hickson Compact Groups, which have unusually low core values (the two lowest filled circles in the first bin) due to Hickson’s (1982) selection criteria. Removing the marginally X-ray detected group NGC 3557 (open circles), which is sampled only to 0.4-1 Mpc and has the lowest , increases the steepness of the trend and the significance of the Spearman correlation coefficient.
The results of this section show that the dwarf and giant populations are not well-mixed and that decreases with radius, and therefore increases with mass density, within the group environment. Mass segregation, in which bright galaxies are brought via dynamical friction into the group core, would produce the opposite trend. However, mass segregation might lead to mergers with the BGG that would disguise its effects. While these results do not include evidence for mass segregation, there are implications for models of standard biased galaxy formation that we discuss in the next section.
4 Discussion
Our results suggest that dwarf-to-giant ratio increases with the mass density of the environment. This trend exists among poor groups, from the field to groups and rich clusters (at least up to the densities of X-ray luminous poor groups), and within the groups themselves. How might we explain the dependence of on environment, an effect that runs counter to the prediction of standard biased galaxy formation? Empirically, we know that there is some relationship between a galaxy’s morphology and the density of its environment (Dressler 1980). It is also observed that the surface density of dwarfs projected within -1 kpc of giant ellipticals is at least that around giant spirals (Lorrimer et al. 1994). Therefore, the combination of these two effects alone would lead us to expect a boost in with environmental density.
While a morphology-density relation may be a natural consequence of standard biased galaxy formation (i.e., the most massive galaxies, giant ellipticals, form preferentially in the dense environments of clusters), the relative excess of dwarfs around giant ellipticals is not. The latter effect may instead be due to an environmental variation in the efficiency of galaxy formation or in the frequency of galaxy-galaxy mergers. To date, there are few detailed theoretical models of such environmental/morphological influences on . Scenarios that increase include: 1) giant galaxies form less efficiently in denser environments (cf. David & Blumenthal 1992), and dwarfs are the leftover material, 2) cold HI clumps (e.g., the High Velocity Clouds in the Local Group (Blitz et al. 1998)) are more likely to collide, produce stars, and evolve into dwarfs in denser regions, 3) galaxy mergers, which occur more frequently in dense systems, reduce the giant population and transfer both progenitors’ satellites to a single remnant, 4) galaxy mergers produce tidal tails in which additional dwarfs form (Barnes & Hernquist 1992; Hunsberger et al. 1996), and 5) dynamical friction in denser environments increases the merger rate of giants with the central, giant elliptical, which then acquires their satellites. Although it is not possible to distinguish among these possibilities at present, we note that the non-mixing of the BGG, dwarf, and giant populations, in addition to the clustering of dwarfs about the central BGG, suggests that at least one of these populations evolved later than the others.
There is preliminary evidence that has evolved in other nearby environments. For example, in the simple environments of isolated, giant elliptical galaxies (cf. Mulchaey & Zabludoff 1999; Colbert, Mulchaey, & Zabludoff 1999), we have found indications of mergers. The giant elliptical NGC 1132 has a poor group-like X-ray halo and dwarf population, yet there are no other giant galaxies in its field. This result is consistent with the picture that NGC 1132 is a merged group.
The consistency of the dwarf-to-giant ratio for the clusters in Trentham’s (1997) and Driver et al. ’s (1998) samples with that of the X-ray luminous groups is reminiscent of another surprise in the comparison of groups and rich clusters. Zabludoff & Mulchaey (1998) find that some X-ray groups have early type galaxy fractions similar to those of clusters, despite the lower velocity dispersions of the groups. The strong correlation between velocity dispersion and early type fraction in groups thus deviates from linearity at cluster velocity dispersions. This saturation point occurs at a velocity dispersion of 400-500 km s-1, the value that a poor group would require to enable an galaxy member to experience a merger within a Hubble time. Therefore, it is possible that mergers cause some evolution in the early type fraction of poor groups and cease to be effective in richer groups and clusters. The apparent saturation of dwarf-to-giant ratio with system density observed here may be a manifestation of the same phenomenon.
The results of this paper are inconsistent with the prediction of standard biased galaxy formation models, in which galaxy formation is modulated coherently over scales larger than the galaxy correlation length, and further motivate “local biasing” models (cf. Narayanan et al. 1998), in which the efficiency of galaxy formation is determined by the density, geometry, or velocity dispersion of the local mass distribution.
5 Conclusions
We use multi-object spectroscopy and wide-field CCD imaging to examine the shape of the galaxy luminosity function (GLF) in six poor groups of galaxies. Five of these groups have luminous X-ray halos and thus represent an environment in which the GLF has never been isolated. For these five groups, the composite group GLF for galaxies with log log and within projected radii of -1 Mpc from the group center is consistent with a Schechter function with log and .
Our other conclusions are:
1. The GLF is not universal in poor groups. The ratio of dwarfs (log log ) to giants (log ) is significantly larger for the five luminous X-ray groups than for the one marginally X-ray detected group. The difference between the X-ray properties of NGC 3557 and the X-ray luminous groups may reflect a difference in their potential well depths, as only deep wells heat gas to X-ray-detectable levels (cf. ZM98, MZ98). Because all of the groups have roughly the same physical scale, this result suggests that increases with mass density for these systems.
2. The dwarf-to-giant ratios of X-ray luminous groups are consistent with or smaller than those for rich clusters. The composite GLF for the luminous X-ray groups is consistent in shape over the full magnitude range with two measures of the composite GLF for rich clusters (Trentham 1997; Driver et al. 1998) and flatter at the faint end than another (, Smith et al. 1997). This result suggests that if there is any shape difference between the poor group and rich cluster GLF’s, it arises from a larger dwarf-to-giant ratio in the denser cluster environment.
3. Dwarf-to-giant ratios are larger in X-ray luminous groups than in regions outside of groups and in poorer groups. The shapes of our composite group GLF and the large volume, R-band, Las Campanas Redshift Survey field GLF (Lin et al. 1996) differ at the level. The shape difference is due either to an excess of dwarfs, a deficiency of giants, or a combination of both effects in poor X-ray groups. Because the LCRS is dominated by galaxies in environments more rarefied than those of these groups, this result suggests that increases with mass density from the field to X-ray luminous groups.
4. Quiescent galaxies cause most of the difference between the dwarf-to-giant ratios of X-ray luminous groups and the field. The GLF for emission line galaxies (EW [OII] Å) in the X-ray groups is indistinguishable from that of the LCRS field. On the other hand, the GLF’s for non-emission line galaxies in the groups and in the field differ at the level. Thus, the shape difference between the overall field and group GLF’s (and presumably between the field and rich cluster GLF’s) is due mostly to the population of quiescent galaxies, whose is larger in the denser group environment than in the field (cf. Ferguson & Sandage 1991, Bromley et al. 1998).
5. Quiescent dwarfs are more concentrated about the group center than quiescent giants, except for the central, brightest () elliptical. A comparison of the velocities and projected positions of the brightest group galaxies (BGG’s), giants, and dwarfs in the X-ray groups suggests that these populations occupy different orbits (i.e., have not mixed completely) and may have evolved via different mechanisms and at different times. Furthermore, the group decreases with radius and therefore increases with mass density.
Our results show that the shape of the GLF varies with environment and that this variation is due primarily to an increase in the dwarf-to-giant ratio of quiescent galaxies in higher density regions, at least up to the densities characteristic of X-ray luminous poor groups. This behavior suggests that, at least in some environments, dwarfs are more biased than giants with respect to dark matter. This trend is in conflict with the prediction of standard biased galaxy formation models. If more than standard biased formation is at work, then possible explanations include inefficient galaxy formation (e.g., giants form less efficiently in denser environments), increases in the satellite-to-primary ratio through the mergers of giant galaxies, and dwarf formation in the tidal tails of giant merger remnants (cf. Hunsberger et al. 1996).
We thank the referee, John Huchra, for his careful reading of the manuscript. We thank Dennis Zaritsky for his comments on the text and for helpful suggestions. We also thank Huan Lin and Michael Vogeley for providing software used in some of our analyses, Neil Trentham and Huan Lin for providing electronic copies of their data tables and for useful discussions, and Romeel Davé, Simon Driver, Neal Katz, Joel Primack, Ian Smail, David Spergel, and Scott Trager for important information. This paper is based on observations made at Las Campanas Observatory, Chile. AIZ acknowledges support from NSF grant AST-95-29259 and NASA grant HF-01087.01-96A. JM acknowledges support provided by NASA grant NAG 5-2831 and NAG 5-3529.
![[Uncaptioned image]](/html/astro-ph/0001495/assets/x1.png)
References
Barnes, J.E. & Hernquist, L. 1992, ARA & A, 2, 705
Bertin, E. & Arnouts, S. 1996, A & A, 117, 393
Binggeli, B., Sandage, A., & Tammann, G. 1988, ARA & A, 2, 509
Blitz, L., Spergel, D., Teuben, P., Hartmann, D., & Burton, W.B. 1998, preprint (astro-ph/9803251)
Bromley, B., Press, W., Lin, H., Kirshner, R. 1998, ApJ, 505, 25
Colbert, J., Mulchaey, J., & Zabludoff, A. 1999, in prep.
David, L. & Blumenthal, G. 1992, ApJ, 389, 510
Dressler, A. 1980, ApJ, 236, 351
Driver, S., Couch, S., & Phillipps, S. 1998, M.N.R.A.S., 287, 415
Ferguson, H. & Sandage, A. 1991, AJ, 101, 765
Geller, M., Kurtz, M., Wegner, G., Thorstensen, J., Fabricant, D., Marzke, R., Huchra, J., Schild, R., & Falco, E. 1997, AJ, 114, 2205
Graham, J. 1982, PASP, 94, 244
Grebel, E. 1999, in “The Stellar Content of the Local Group”, IAU Symp. 192, eds. P. Whitelock & R. Cannon, ASP Conf. Ser.
Helou, G., Madore, G., Schmitz, M., Bicay, M., Wu, X. & Bennett, J. 1991, in “Databases and On-Line Data in Astronomy,” ed. D. Egret & M. Albrecht (Dordrecht: Kluwer), p. 89.
Hickson, P. 1997, ARA & A, 2, 357
Hickson, P. 1982, ApJ, 255, 382
Hunsberger, S., Charlton, J., & Zaritsky, D. 1998, ApJ, 505, 536
Hunsberger, S., Charlton, J., & Zaritsky, D. 1996, ApJ, 462, 50
James, P. 1991, M.N.R.A.S., 250, 544
Jarvis, J.F. & Tyson, J.A. 1981, AJ, 86, 476
Jerjen, H. & Tammann, G. 1997, A & A, 321, 713
Kauffmann, G., Nusser, A., & Steinmetz, M. 1997, M.N.R.A.S., 286, 795
Koranyi, D., Geller, M., Mohr, J., & Wegner, G. 1998, AJ, 116, 2108
Kravtsov, A. & Klypin, A. 1999, preprint (astro-ph/9812311)
Lin, H., Kirshner, R.P., Shectman, S.A., Landy, S.D., Oemler, A., Tucker, D. L., Schechter, P. L. 1996, ApJ, 464, 60
Lin, H. 1995, Ph.D. Thesis, Harvard University
López-Cruz, O., Yee, H., Brown, J., Jones, C., & Forman, W. 1997, ApJL, 475, L97
Lorrimer, S., Frenk, C., Smith, R., White, S., & Zaritsky, D. 1994, M.N.R.A.S., 269, 696
Loveday, J., Peterson, B., Efstathiou, G., & Maddox, S.J. 1992, ApJ, 390, 338
Marzke, R., Geller, M., Huchra, J., & Corwin, H. 1994a, AJ, 108, 2
Marzke, R., Huchra, J., & Geller, M. 1994b, ApJ, 428, 43
Mink, D. J. & Wyatt, W. F. 1995, Astronomical Data Analysis Software and Systems IV, ASP Conference Series, Vol. 77, 1995, R.A. Shaw, H.E. Payne, and J.J.E. Hayes, eds., p. 496.
Moore, B., Lake, G., & Katz, N. 1998, ApJ, 495, 139
Moore, B., Katz, N., Lake, G., Dressler, A., & Oemler, A. 1996, Nature, 379, 613
Mulchaey, J. S. & Zabludoff, A.I. 1998, ApJ, 496, 73 (MZ98)
Muriel, H., Valotto, C., & Lambas, D. 1998, ApJ, 506, 540
Narayanan, V., Berlind, A., Weinberg, D. 1998, preprint (astro-ph/9812002)
Ramella, M., Geller, M.J., & Huchra, J.P. 1989, ApJ, 344, 57
Schechter, P.L. 1976, ApJ, 203, 297
Schild, R. 1977, AJ, 82, 337
Secker, J. & Harris, W. 1996, ApJ, 469, 623
Shectman, S.A., Schechter, P.L., Oemler, A.A., Tucker, D., Kirshner, R.P., & Lin, H. 1992, in Clusters and Superclusters of Galaxies (ed. Fabian, A.C.) 351-363 (Kluwer, Dordrecht)
Shectman, S.A., Landy, S.D., Oemler, A., Tucker, D.L., Lin, H., Kirshner, R.P.; Schechter, P.L. 1996, ApJ, 470, 172
Smith, R., Driver, S., & Phillipps, S. 1997, M.N.R.A.S., 287, 415
Thompson, L. & Gregory, L. 1993, AJ, 106, 2197
Trentham, N. 1997, M.N.R.A.S., 290, 334
Tucker, D., Hashimoto, Y., Kirshner, R., Landy, S., Lin, H., Oemler, A., Schechter, P., & Shectman, S. 1998, in Large Scale Structure: Tracks and Traces, proceedings of the 12th Potsdam Cosmology Workshop (ed. V. Mueller, S. Gottloeber, J.P. Muecket, J. Wambsganss) 105-106 (World Scientific)
Valotto, C. A., Nicotra, M. A., Muriel, H., & Lambas, D. G. 1997, ApJ, 479, 90
White, S., Davis, M., Efstathiou, G., & Frenk, C. 1987, Nature, 330, 451
Wilson, G., Smail, I., Ellis, R., & Couch, W. 1997, M.N.R.A.S., 284, 915
Zabludoff, A.I. & Mulchaey, J.S. 1998, ApJ, 496, 39 (ZM98)
Zaritsky, D., Zabludoff, A.I., & Willick, J. 1995, AJ, 110, 1602
Zepf, S., de Carvalho, R., & Ribeiro, A. 1997, ApJ, 488, 11
Figure Captions
Figure 1: Contour map of the diffuse X-ray emission in the NGC 3557 group of galaxies overlaid on the STScI Digital Sky Survey. The X-ray point sources have been removed following the procedure outlined in MZ98. The contours correspond to levels 3, 4, and above the background. The data have been smoothed with a Gaussian profile of width 30′′. The coordinate axes are J2000.
Figure 2: Galaxy velocity distributions out to 30000 km s-1 for the six poor groups in our sample. The shaded histograms indicate the Ngrp group members identified with the pessimistic -clipping algorithm described in ZM98. In the group HCG 42, we manually add one galaxy (H42_136; km s-1) excluded by the membership algorithm to the membership list, because this galaxy’s velocity bin is contiguous with the group’s velocity peak.
Figure 3: Distributions of apparent R magnitudes () for galaxies with measured velocities in the six poor group fields. The number above each bar indicates the percentage of the total number of galaxies in the field within that magnitude bin represented by the plotted galaxies. Differences between Ntot in Figure 2 and Nspec here are due to galaxies observed spectroscopically that lie just off the edge of the photometric field. In two groups, NGC 4325 and NGC 5129, our spectroscopy and imaging extend beyond the radius of 0.6-1 Mpc sampled in the other groups. In these two cases, we also show the distribution for the subset of galaxies within 0.6-1 Mpc that is used for all subsequent analyses in this paper (shaded).
Figure 4: Galaxy luminosity distributions for the members of each of the six groups in the sample. The first five groups, HCG 42, HCG 62, NGC 2563, NGC 4325, and NGC 5129 are X-ray luminous, whereas the last group, NGC 3557, is only marginally X-ray detected. The total number of spectroscopically-confirmed group members is . The absolute magnitudes are extinction-corrected and calculated assuming a km s-1 Mpc-1, cosmology. The shaded boxes are the observed number of group members within that magnitude bin. The solid boxes are the completeness-corrected galaxy counts (). (For HCG 62, NGC 4325, and NGC 3557, the corrected counts exceed the limit of the y-axis at the faintest magnitudes.)
Figure 5: (a) Top panel: Comparison of the galaxy luminosity function for the composite of the five X-ray luminous groups (filled triangles) and for two composites of nearby rich clusters of galaxies (short dashed line, Trentham 1997; dot-dashed line, Driver et al. 1998). To simplify the comparison of the GLF shapes, the curves in panels (a) and (b) are normalized to have the same total number of log galaxies as HCG 42. The composite group GLF is derived from averaging the completeness-corrected counts in Figure 4 after normalizing the individual group GLF’s to the same total number of log galaxies as HCG 42. The best fit to the group GLF is consistent with a Schechter function with log and (thick solid line in both panels). The three composite GLF’s are indistinguishable for the given errors. (b) Bottom panel: Comparison of the group GLF in (a) with that of the Campanas Redshift Survey (LCRS) field (long dashed line; Lin et al. 1996) to the completeness limit of the LCRS (log ). The LCRS and composite group GLF’s differ at the confidence level for any choice of relative normalization. A flat faint end slope of is also plotted for comparison.
Figure 6: Comparison of the GLF for star forming and for quiescent galaxies in X-ray groups and in the LCRS field. The composite group GLF in Figure 5 is split here into (1) the GLF for galaxies whose spectra have [OII] EW Å (open triangles) and (2) the GLF for galaxies with [OII] EW Å (filled circles). The GLF for the LCRS field is split similarly into star forming (short dashed line) and quiescent (long dashed line) components. Once again each component is arbitrarily normalized to the to the same total number of log star forming or quiescent galaxies as HCG 42. The thick solid line is as in Figure 5b.
Figure 7: (a) Left panel: Velocity offset vs. projected radial offset of 123 quiescent group members from the group centroid for the six groups in the sample. The velocity offset is normalized with the group velocity dispersion (). The six asterisks are four of the brightest group galaxies (BGGs) and two other galaxies with . The open circles are the 56 giants defined by log . The filled circles are the 61 dwarfs defined by log log . (Note that the data extend to a projected radius of -1 Mpc , because the group centroid shown here and the fiber field center are not precisely coincident in some cases.) Right panel: The distribution of (), the quadrature sum of the x- and y-axis offsets of each galaxy, for the BGG (heavily shaded), giant (shaded), and dwarf populations (unshaded). The distributions suggest that the three populations occupy different orbits (i.e., have not mixed completely). (b) The same as in (a) for 49 star forming group members.
Figure 8: profile for the quiescent members of each group in Figure 7a. The significance of the correlation as determined from a Spearman rank-order test is . The trend is likely to be even steeper than shown, because the sample includes two Hickson Compact Groups, which have unusually low core values (the two lowest filled circles in the first bin) due to the Hickson Group selection criteria. Removing the marginally X-ray detected group NGC 3557 (open circles), which is sampled only to 0.4-1 Mpc and has the lowest , increases the steepness of the trend and the significance of the Spearman correlation coefficient.