The spatial and age distribution of stellar populations in DDO 190111Based on observations made with the 2.5 m Nordic Optical Telescope operated on the island of La Palma by NOT S.A. at the Spanish Observatorio del Roque de Los Muchachos of the Instituto de Astrofísica de Canarias.
Abstract
The spatial distribution of stellar populations, the star formation history, and other properties of the dIrr galaxy DDO 190 have been analyzed using color–magnitude diagrams (CMDs) of about 3900 resolved stars and the Hα fluxes of H ii regions. From the mean color index of the red giant branch, a mean metallicity [Fe/H] is obtained. The magnitude of the TRGB has been used to estimate the distance. DDO 190 is Mpc from the Milky Way, 2.1 Mpc from the M 94 group (CnV-I), 2.4 Mpc from the M 81 group and 2.9 Mpc from the barycenter of the Local Group, all indicating that it is an isolated, field galaxy.
The surface-brightness distribution of the galaxy is well fitted by ellipses of ellipticity and P.A. . The radial star density distribution follows an exponential law of scale length , corresponding to 611 pc. The Holmberg semi-major axis to is estimated to be .
Stellar populations of different ages in DDO 190 show strong spatial decoupling, the oldest population appearing much more extended than the youngest. Stars younger than 0.1 Gyr occupy only the central (0.55 kpc); stars younger than a few () Gyr extend out to (125 kpc), and for larger galactocentric distances only older stars seem to be present. This behavior is found in all the dIrr galaxies for which spatially extended studies have been performed and could be related with the kinematical history of the galaxy.
1 Introduction
Dwarf galaxies are usually divided in two main categories: dwarf irregular (dIrr) and dwarf spheroidal/dwarf elliptical (dSph/dE). The most obvious differences between them are internal and refer to the amount of gas and young stellar populations. However dSph/dE and dIrr galaxies also show a striking difference in their spatial distribution: while dSphs/dEs appear concentrated around bigger galaxies or in the high-density regions of galaxy clusters, dIrrs show a smooth distribution, with only 50 % associated with clusters (Karachentseva & Vavilova 1994). This suggests that dIrrs evolve into dSphs/dEs through gas-loss produced by external ram pressure and tidal stripping, which would be more efficient in high-density environments and the surroundings of big galaxies (Einasto et al. 1974; Lin & Faber 1983).
Although suggestive, this picture needs to be tested on the basis of wider and deeper observational information. Much work has been carried on in the last few years analyzing dwarf galaxies in the Local Group (see the review by Mateo 1998). But in order to have a complete overview, this kind of analysis is also necessary for galaxies in the outskirts of the Local Group and in the field. In this paper, the structural properties and the stellar population of one of these objects, DDO 190, are studied on the basis of , , and Hα photometry.
DDO 190 (UGC 9240; ; ) is a resolved, gas-rich dwarf galaxy first cataloged by van den Bergh (1959). It lies in a region of the sky with a reddening of almost 0 (Burstein & Heiles 1982). Its magnitude and colors have been given by de Vaucouleurs et al. (1991: , , ), by Melisse & Israel (1994: , , ) and by Prugniel & Héraudeau (1998: , , ). Fisher & Tully (1981) and Hutchmeier & Richter (1988) provide H i data for the galaxy which include integrated fluxes and velocity dispersion. They obtain heliocentric velocities of km s-1 and km s-1, respectively, and relative to the Local Group velocities of km s-1 and km s-1, respectively. Far-infrared data are given by Thuan & Sauvage (1992), by Isobe & Feigelson (1992) and by Melisse & Israel (1994). Finally, upper limits to the CO emission have been obtained by Israel, Tacconi, & Baas (1995). Its distance has been never directly estimated. Values in the range 2.8–5.6 Mpc have been frequently used, as derived from and different choices of the Hubble parameter.
The paper is organized as follows: in §2 the observations and data reduction are described. The color–magnitude diagram (CMD) of the resolved stars is presented in §3. In §4 the distance and the metallicity are derived from the magnitude of the tip of the red giant branch (TRGB) and the color of the red giant branch (RGB). The distribution of ionized H is discussed in §5. Section 6 is devoted to the study of the structure and the spatial distribution of stars. The star formation history (SFH) has been obtained using synthetic CMDs, which is presented in §7. Section 8 summarizes the global properties of DDO 190. Finally, in §9 the main conclusions of the paper are given.
2 Observations and data reduction
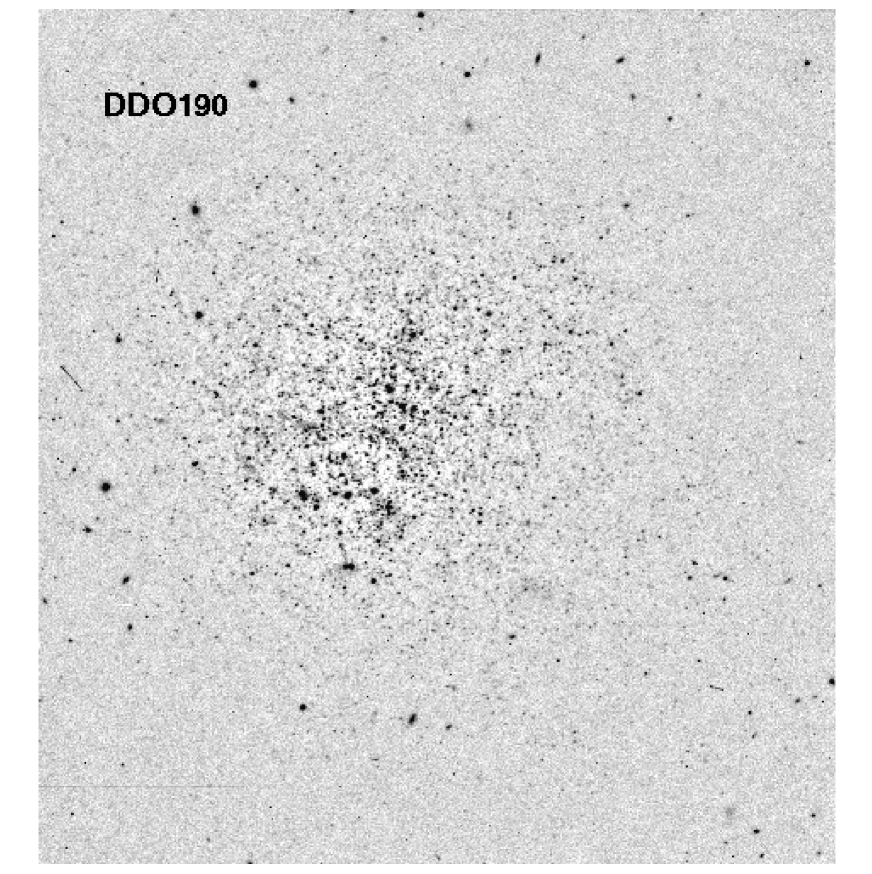
Images of DDO 190 were obtained in the and Johnson–Cousins filters and in a narrow band Hα filter with the NOT (2.5 m) at Roque de los Muchachos Observatory on La Palma (Canary Islands, Spain). The HiRAC camera was used with a Loral CCD binned to . After binning it provides a scale of 0.22 ′′/pix and a total field of . Total integration times were 2400 s in , 2000 s in , and 1800 s in Hα. A 600 s exposure was also taken with an Hα-continuum filter. Moreover, integrations of 1200 s in and 1200 s in were performed for a nearby field to correct the foreground contamination of the broad-band images. Table 1 gives the journal of observations. Figure 1 shows one of the -band images of DDO 190.
Bias and flat-field corrections were carried out with IRAF. Then, DAOPHOT and ALLSTAR (Stetson 1994) were used to obtain the instrumental photometry of the stars. Eighteen standard stars from the list of Landolt (1992) were measured during the observing run to calculate the atmospheric extinctions for each night and the equations transforming into the Johnson–Cousins standard photometric system. A total of about 180 measurements in and of these standards were used. The transformation equations are:
| (1) |
| (2) |
where capital letters stand for Johnson–Cousins magnitudes and lower-case letters refer to instrumental magnitudes corrected for atmospheric extinction. The values are the dispersions of the fits at the barycenters of the point distributions; hence they are the minimum internal zero-point errors. Dispersions of the extinction for each night varies from to and the dispersion of the aperture corrections are of the order of 0.04. Putting all these values together, the total zero-point error of our photometry can be estimated at about 0.05 for both bands.
ALLFRAME provides PSF-to-star fitting errors. These are 0.02, 0.05 and 0.2 for , 22.0 and 23.8, respectively. However, these are not the real external errors of the photometry, which are bigger and can be properly obtained only through detailed artificial star trials (Aparicio, & Gallart 1995).
One standard star from Oke (1990) was observed three times to calibrate the Hα images. The dispersion of the measures was better than 0.01 magnitudes.
3 The color–magnitude diagram
The CMD of DDO 190, shown in Figure 2, is typical of a resolved galaxy with recent star formation. It shows similar structures as that of DDO 187 (Aparicio, Tikhonov, & Karachentsev 2000), but with a less well defined appearance. A well populated structure is visible in the region , , corresponding to the red-tangle (see Aparicio & Gallart 1994; Aparicio et al. 1996). It is formed by low-mass stars in the RGB and AGB phases and it is hence the trace of an intermediate-age to old stellar population. It shows a large color dispersion. Although this may be related with a large metallicity dispersion, it is more likely due to external photometrical errors, which we have not analyzed here in detail.
The CMD shows also a number of blue stars (). Some of these may be foreground stars, but many are probably members of DDO 190, with intermediate to high masses in the main sequence (MS) and/or the core He-burning blue-loop evolutionary phases. They are the trace of a significant recent star formation, in good agreement with the presence of H ii regions in the galaxy. Finally, some of the red stars in the region , are probably intermediate-age to young AGB stars. They also form a red-tail structure of the kind discussed by Aparicio & Gallart (1994), visible at , .
Figure 3 shows the CMD of a companion field, close to DDO 190 but far enough to guarantee that it contains no stars of the galaxy. The distribution of stars in this diagram indicates that some of the red and yellow stars in the CMD of Figure 2 are foreground stars, belonging to the Milky Way, but that most of the bright blue ones are probably members of DDO 190.
In summary, the CMD of DDO 190 indicates that it has had an extended SFH, as evidenced by the presence of young blue stars and a red-tangle of intermediate-age and/or old stars. A quantitative estimate of the SFH is given in §7.
4 The distance of DDO 190
The distance to DDO 190 can be estimated using the magnitude of the TRGB and the relationships by Lee, Freedman, & Madore (1993). We have determined the magnitude of the TRGB applying a Sobel filter to the luminosity function (LF) of stars with colors in the interval . To minimize crowding and blending effects, only stars at distances greater than from the center of the galaxy have been used. The corresponding CMD is shown in Fig. 4. We have obtained . The error has been estimated from the width of the peak produced by the Sobel filter around the TRGB. Several binning sizes and initial values for the LF have been used, the former result being the average of all them. The extinction towards DDO 190 can be neglected (Burstein & Heiles 1982).
To apply the relationships of Lee et al. (1993), the metallicity of the stars and the bolometric correction (BC) at the TRGB are necessary. Both can be estimated from the color indices of RGB stars. and have been obtained as the median of the color indices of stars at distances greater than form the center of the galaxy, having colors in the interval and with magnitudes in the ranges and , respectively. Some 50 stars have been used in each case and the quoted errors have been simply obtained as for each sample. From , an average metallicity of [Fe/H] is found using the calibration by Lee et al. (1993). This Fe abundance corresponds to . It must be noted, however, that the Lee et al.’s relation applies for old stellar populations. A significant population of intermediate-age stars, as is the case for DDO 190, produces metallicities systematically lower than the real one. As a consequence, the metallicity given above must be understood as a lower limit and the quoted errors as mere estimates of the error of the mean, calculated from the internal dispersion of the used sample. In any case, the uncertainty does not significantly affect the resulting distance.
and can finally be introduced in the relationships of Lee et al. (1993) to obtain the absolute magnitude of the TRGB, , and hence a distance modulus of , which corresponds to a distance to the Milky Way of Mpc.
The distance of DDO 190 to the barycenter of the LG and to other nearby galaxy groups can be estimated. The position of the LG barycenter can be calculated neglecting the masses of all the galaxies in the LG except Andromeda and the Milky Way; assuming that the mass of the Milky Way is 0.7 times that of Andromeda (Peebles 1989) and adopting a value of 0.77 Mpc for the Milky Way–Andromeda distance (Freedman & Madore 1990). The resulting distance for DDO 190 to the barycenter of the LG is Mpc.
The distances of DDO 190 to the closest groups of galaxies are 2.4 Mpc to the M 81 group and 2.1 Mpc to the M 94 group (CnV-I). These values have been obtained assuming that distances from the Milky Way are 3.6 Mpc for M 81 (Freedman et al. 1994) and 4.7 Mpc for M94 (from the velocity of M94, kms-1, with km s-1Mpc-1). Angular distances are from DDO 190 to M 81 and from DDO 190 to M94.
The closest known object to DDO 190 seems to be DDO 187. Both galaxies are similar and are separated by some on the sky. Using the former distance for DDO 190 and 2.4 Mpc for DDO 187 (Aparicio et al. 2000), the distance from one galaxy to another is about 1.0 Mpc. Their radial velocities relative to the barycenter of the Local Group are 275 km s-1 for DDO 190 (average of the values by Fisher & Tully 1981 and Huchtmeier & Richter 1988) and 136 km s-1 for DDO 187 (Kraan-Korteweg & Tammann 1979). Hence the possibility that both galaxies could form a physical pair can be rejected.
Summarizing, DDO 190 seems to be an isolated field galaxy, at more than 2 Mpc from any galaxy group or giant galaxy and 1 Mpc from the nearest isolated dwarf galaxy.
5 Ionized gas
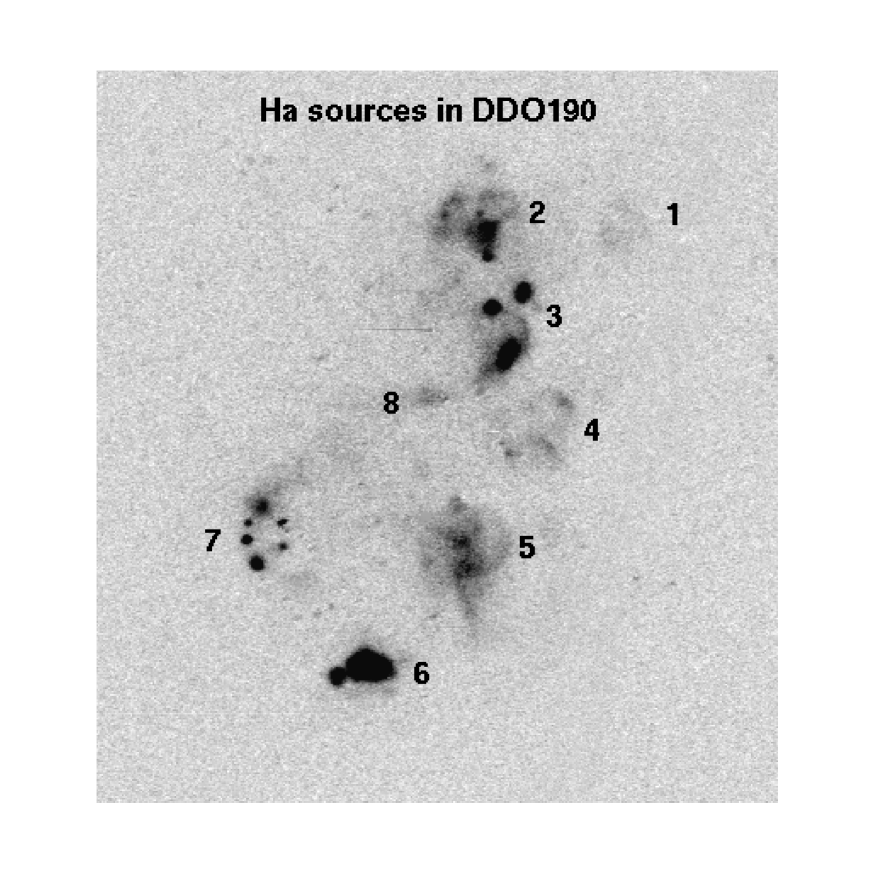
Figure 5 shows the Hα image of DDO 190, after subtraction of the continuum. We have identified eight H ii regions of different morphology and compactness. A summary of their properties is given in Table 2. Column 1 gives the identification number as in Figure 5. Column 2 gives the flux received from each region. Column 3 gives the corresponding Hα luminosities calculated for a distance of 2.9 Mpc. Column 4 lists the number of ionizing photons per second required to produce those luminosities, calculated following Kennicut (1988) and assuming no extinction, which obviously provides a lower limit to the number of emitted photons. Using also data by Kennicut (1988), the upper limit would be about twice the quoted values.
The last line in Table 2 gives quantities integrated for the whole galaxy, including also the very diffuse emission. The current SFR can be estimated from . The relations given in Aparicio et al. (2000) have been used. The reader is referred to this paper for more details. is given by
| (3) |
where time increases from the present to the past, the present time being 0 (i. e. it is the age); is the IMF; is the SFR in units of number of stars per year; is the MS lifetime of a star of mass , and is the number of Lyman photons emitted per second by an MS star of mass . While we are interested in stars more massive than some 10 M☉ (see Aparicio et al. 2000) we need to consider only the interval of time 0 to . Assuming, for simplicity, that the SFR is constant over this interval and using the relations given in Aparicio et al. (2000) with the IMF of Kroupa, Tout, & Gilmore (1993), equation (3) becomes
| (4) |
with , and for M☉, M☉ and M☉, respectively. The result is almost insensitive to the value of , which has been fixed to M☉. From this, the current SFR results yr-1 or M☉yr-1. The latter has been obtained using an average stellar mass 0.5 M☉, which results from integration of the Kroupa et al.’s IMF. The errors have been adopted to confidently account for the uncertainty introduced by the choice of the upper limit for the stellar mass, as well as the uncertainty of the internal extinction of the HII regions.
6 Morphology and radial distribution of stellar populations
Evident galactocentric gradients in the stellar populations have been recently found in dwarf galaxies (Aparicio et al. 2000; Schulte-Ladbeck et al. 1999; Martínez-Delgado, Gallart, & Aparicio 1999; Minniti, Zijlstra, & Alonso 1999; Aparicio et al. 1997b; Minniti & Zijlstra 1996). They indicate that young stars are much more concentrated than intermediate and old stars. This could be the result of the existence of old extended halos in these galaxies. As we will show later on, we have not covered a large enough field for DDO 190 to determine the total extension of the galaxy. However, the radial-density profile can still be studied and some conclusions can be traced out regarding the different extensions of the young and the intermediate-to-old stars.
We have searched the morphology of the distribution of resolved stars and fitted it with ellipses. To determine the center, position angle, and ellipticity of the isophotes IRAF was used to create an empty image to which artificial stars were added with the magnitudes and positions of the stars resolved and measured in DDO 190. This image was filtered with a pixels Gaussian and IRAF was used to fit elliptical isophotes to it. These ellipses were used afterwards to determine the stellar radial density profile, which is shown in Figure 6.
The innermost ellipses are clearly affected by incompleteness (see Sect. 7). More interestingly, the number density of stars in the outermost ellipse is . The number density of stars in the comparison field is , indicating that we are far from having reached the radius at which the galaxy completely vanishes. This fact impedes deriving the integrated magnitude of the galaxy, but the scale length can still be obtained from the stellar density profile. Using the region , it results , equivalent to 611 pc. For latter calculations and for comparison with other dIrr galaxies, it is useful to estimate the Holmberg radius . Using the former value of and from Fisher, & Tully (1981), it results .
Whether different stellar populations are distributed differently in the galaxy can be checked by studying the density profile of stars of different ages. To do so, stars of four different regions of the CMD have been selected. These boxes are shown in Figure 7. The region between boxes 3 and 4 has been excluded because it may be seriously affected by observational effects; in particular by up-ward migration of RGB stars (Aparicio, & Gallart 1995; Martínez-Delgado, & Aparicio 1997).
A synthetic CMD computed upon the Padua stellar evolutionary library (Bertelli et al. 1994), has been used to define the four regions and to check the ages sampled by each one. In particular, box 1 is populated by stars younger than 0.1 Gyr only. Box 2 contains stars younger than 1 Gyr. Box 3 samples the age interval from 1 to 4 Gyr, preferentially. Finally, box 4 is the only one containing a large amount of stars older than 4 Gyr (see §7 and Fig. 11, which illustrates this point). More details about the distribution of stars as a function of age can be seen in Aparicio (1997).
The profiles for each region are shown in Figure 8. Crowding effects in the innermost region of the galaxy produce a decrease in the stellar density in the inner regions. Apart from this, the figure shows that the youngest population completely vanishes at less than from the center, while the density of older stars (box 4) goes down slowly. The intermediate populations show an intermediate behavior, but it is interesting to note that at more than some the only surviving population is that of box 4. This can be interpreted as only stars older than 4 Gyr populating the outermost regions of the galaxy. This will be further discussed in §7, where the SFR is calculated for increasing galactocentric distances.
7 The star formation history of DDO 190
The SFH can be derived in detail for the full history of a galaxy from a deep CMD through comparison with synthetic CMDs (see Gallart et al. 1999). The CMD of DDO 190 is not deep enough for such a detailed analysis but it is still possible to sketch the SFH of the galaxy for old, intermediate and young ages and to study the spatial extension of each age interval. For this, the galaxy has been divided into four elliptical regions of increasing size. The regions are shown in Figure 9 and have been selected according to the results of the elliptical isophote analysis explained in §6. It must be noted that the small areas devoided of resolved stars in the innermost regions correspond to the most luminous HII regions discussed in §5.
The CMDs of the four elliptical regions are shown in Figure 10. In good agreement with the results obtained in §6, two main facts are apparent from these figures: first that the young, blue stars, are present only in the inner regions; and second that in the outer region, traces of the RGB are still apparent.
In the following we will quantitatively derive the stellar age distribution in each elliptical region of DDO 190. Rigorously, this represents the SFH of each region only if no migration of stars from one region to another has occurred along their lives. For simplicity, and because we are not now interested in the kinematical evolution of the galaxy, we will assume that this is the case and we will call the resulting distributions the SFH. But it must be kept in mind that what we are going to derive are current spatial and age distributions of stars.
To derive the SFH, the same procedure used by Aparicio et al. (2000) has been applied. It is a simplified version of the method proposed by Aparicio, Gallart and Bertelli (1997a). In practice, a synthetic CMD with constant SFR of value , the IMF by Kroupa et al. (1993), 25 % of binary stars with mass ratios, , uniformly distributed in the interval and a metallicity taking random values from to , independent of age have been used. The interval has been chosen considering the results found for the metallicity in §4.
The resulting synthetic CMD has then been divided into four age intervals: 0–0.1 Gyr, 0.1–1 Gyr, 1–4 Gyr, and 4–15 Gyr. Following the nomenclature introduced in Aparicio et al. (1997a), each of these synthetic diagrams will be called partial model CMD and any linear combination of them will be denoted as a global model. The four partial model CMDs are shown in Fig. 11.
For each elliptical region, stars have been counted in the four boxes shown in Figures 7 and 11. We will denote by the number of stars of the observed CMD lying in region and by the number of stars of partial model (or age interval) populating region . The number of stars populating a given region in a global model is then given by
| (5) |
and the corresponding SFR by
| (6) |
where are the linear combination coefficients, is a normalization constant, and if is inside the interval corresponding to partial model and otherwise. The having the best compatibility with the data can be obtained by a least-squares fit of to .
The quantities must be corrected of incompleteness. Completeness factors have been estimated for each elliptical region shown in Figure 9 and for the four boxes defined in the CMD. The usual artificial star experiments and DAOPHOT have been used (Stetson 1987). Two arrays of artificial stars have been builded up with stars separated 30 pixels in and coordinates from each other. In this way, it is guaranteed that no over-crowding (crowding of artificial stars between each other) is produced. Magnitudes and colors have been chosen to sample the magnitudes and colors of the boxes 1 and 2 for the first array and 3 and 4 for the second array. In practice and has been used to sample box 1; , for box 2; , for box 3, and , for box 4. Each array has been added to the and images creating two sets of images and the photometry has been recalculated for each set in the same way as for the real, original images. By this procedure, some 50 artificial stars are added in each CMD box to the smallest (the innermost) ellipse and more than 500 in each CMD box for the whole image.
The completeness factors for each box and ellipse are then calculated as the rates of the recovered to injected artificial stars. The criteria to determine when an artificial star is recovered are the same discussed in Aparicio, & Gallart (1995). Completeness factors are 1.0 for all the boxes in all the elliptical regions, except the innermost one. In this, completeness is 1.0 for box 2; 0.85 for boxes 1 and 3 and 0.25 for box 4. These values have been used to correct the star counts in the observational CMD, but the low completeness in box 4 of ellipse 1 introduces a greater uncertainty in the results for the oldest population in the innermost region of the galaxy.
The resulting for DDO 190 is shown in Figure 12. The right-hand vertical scale is normalized to the area covered by each region. Note that for region 1 the current SFR estimated from the Hα luminosity is more than twice as large as that estimated from the CMD but error bars of both marginally overlap. The former is not represented in Figure 12.
Crowding is more severe in the innermost region of the galaxy. This makes the estimate of for intermediate and old stars more uncertain. For this reason, we prefer giving an average for the 1 to 15 Gyr interval (see panel 1 of Fig. 12).
Global model CMDs corresponding to the adopted solutions for are shown in Figure 13. This figure is intended as only ilustrative. It particular, when compared with the observational CMDs shown in Figure 10 it must be kept in mind that, in Figure 13 the observational effects have not been simulated, resulting in the most crowding affected region to be overpopulated in this figure.
A summary of the SFR averaged over different intervals of time is given in Table 3. Column 1 indicates the interval of time and whether the SFR has or has not been normalized to the area. The interval of time used is given in Gyr by subscripts of the averaged SFR (e.g., stands for the SFR averaged for the 4 to 1 Gyr ago period of time). The first seven lines list values for not normalized to the area. The present-day value, derived from the Hα luminosity, is denoted by . Lines 8 to 14 give the same normalized to the area covered by each region. Columns labeled 1 to 4 give the data for the four studied regions. Last column gives extrapolated estimates for the outermost region of the galaxy, not covered by our image, down to the Holmberg radius . These values have been obtained by extrapolation of the quantities corresponding to region 4 and using an exponential function of scale length , as found above for the stellar density profile of the galaxy. It must be stressed that these values are only crude estimates.
The analysis of Figure 12 and Table 3 shows that while the older population follows a smooth decreasing density radial distribution, young stars are only present in the inner regions. In particular, a negligible number of stars younger than 4 Gyr appears in the three outermost regions, i.e., at galactocentric distances greater than or 1.10 kpc (semi-major axis) while almost all the stars younger than 0.1 Gyr are concentrated in the innermost ellipse, of or 0.55 kpc. The effect is even stronger if the SFR estimated from the Hα luminosity is considered, as it is concentrated in region 1.
With different levels of evidence, the behavior of the stellar populations of DDO 190 is being found in all the dIrr galaxies for which a spatially extended study has been performed (see the discussion in Aparicio et al. 2000). This could possibly be related to the kinematical history of the galaxy and the oldest stars could be tracing its primeval structure and the possible dark matter potential well. None of the results found till now refutes this idea. However, the final confirmation should ideally come from more observational data including, in particular, the kinematics, which is, unfortunately, still beyond the reach of currently available instruments.
8 Global properties of DDO 190
The SFR and the new estimate of the distance obtained here have been used, together with data from other authors, to calculate the integrated properties of DDO 190 listed in Table 9. The bracketed figures refer to the bibliographic sources for each datum. Nothing is indicated for quantities directly derived from other quantities listed in the table. First the coordinates, the metallicity, [Fe/H], and the distance to the Milky Way, , and to the barycenter of the Local Group, , and the semi-major axis to the Holmberg radius at are given. Integrated absolute magnitudes and luminosities referred to the Holmberg radius at follow. is the mass in stars and stellar remnants for the whole galaxy, calculated from integration of for the whole galaxy life and assuming that 0.8 of this integral remains locked in stellar objects; is obtained by multiplying the H i mass by 4/3 to take into account the mass in He; is the virial mass obtained from the velocity dispersion of the gas; is the gas fraction, relative to the total mass intervening in the chemical evolution (mainly gas and stellar objects; see Peimbert et al. 1993), and is the dark matter fraction, calculated as indicated in the table. Finally, the gas and total mass to luminosity fractions are given.
9 Conclusions
We have presented and CCD photometry of stars in the dIrr galaxy DDO 190, as well as Hα photometry of its H ii regions. The color–magnitude diagram shows a red giant branch, and a sequence of blue stars. From the mean color of the RGB, , a mean metallicity [Fe/H] is obtained. Based on the magnitude of the TRGB we have derived the distance modulus of DDO 190 to be , which corresponds to a distance from the Milky Way of Mpc. The distances of DDO 190 to the nearest galaxy groups are 2.1 Mpc to the M 94 group (CnV-I), 2.4 Mpc to the M 81 group and 2.9 Mpc to the barycenter of the LG. The nearest known galaxy to DDO 190 is DDO 187, at 1.0 Mpc, all this indicating that DDO 190 is an isolated field galaxy.
The surface-brightness distribution of the galaxy is well fitted by ellipses of ellipticity and . These parameters have been used to find the radial star density distribution, which is fitted by an exponential law of scale length , corresponding to 611 pc. The galaxy is bigger than the field covered by our images. The former value of and previously published surface photometry have been used to estimate a value for the Holmberg semi-major axis to of .
The star-formation history of DDO 190 has been estimated from the number of blue and red stars in the color–magnitude diagram, using a synthetic CMD as reference. The current SFR has also been estimated from the Hα luminosity. The star-formation rate has been evaluated for the intervals of time 0–0.1 Gyr, 0.1–1 Gyr, 1–4 Gyr, and 4–15 Gyr, for which the values summarized in Table 3 have been obtained.
Stellar populations of different ages show different spatial distributions, the oldest being much more extended than the youngest. In fact DDO 190 shows a current strong enhancement in the SFR in its central region, which is a common feature of galaxies classified as dIrr. Stars younger than 0.1 Gyr occupy only the central (0.55 kpc); stars younger than a few () Gyr extend up to (1.10 kpc), and for larger galactocentric distances only older stars seem to be present. This behavior is being found in all the dIrr galaxies for which spatially extended studies have been performed and could be related to the kinematical history of the galaxy. In particular the oldest stars could being tracing the primeval structure of the galaxy and its possible dark-matter potential well (see a thorough discussion of this in Aparicio et al. 2000 and references therein). This, however, needs stronger observational confirmation, kinematical data being meant to provide very useful information.
References
- (1)
- (2) Aparicio, A. 1997, in IAU Symp 192, The Stellar Content of Local Group Dwarf Galaxies, ed. by P. Whitelock & R. Cannon (ASP), 304
- (3) Aparicio, A., Dalcanton, J. J., Gallart, C., & Martínez-Delgado, D. 1997b, AJ, 114, 1447
- (4) Aparicio, A., & Gallart, C. 1994, in ESO Conference and Workshop Proceedings No. 51, The Local Group: Comparative and Global Properties, ed. by A. Layden, R. C. Smith, & J. Storm (Garching: ESO), 115
- (5) Aparicio, A., & Gallart, C. 1995, AJ, 110, 2105
- (6) Aparicio, A., Gallart, C., & Bertelli, G. 1997a, AJ, 114, 680
- (7) Aparicio, A., Gallart, C., Chiosi, C., & Bertelli, G. 1996, ApJ, 469, L97
- (8) Aparicio, A., Tikhonov, N., & Karachentsev, I. D. 2000, AJ, in press
- (9) Bertelli, G., Bressan, A., Chiosi, C., Fagotto, F., & Nasi, E. 1994, A&AS, 106, 275
- (10) Burstein, D., & Heiles, C. 1982, AJ, 87, 1165
- (11) de Vaucouleurs, G., de Vaucouleurs, A., Corwin, H. G., Buta, R. J., Paturel, G., & Fouqué, P. 1991, Third Reference Catalogue of Bright Galaxies
- (12) Einasto, J., Kaasik, A., Saar, E., Chernin, A. 1974, Nature, 252, 111
- (13) Fisher, J. R., & Tully, R. B. 1981, ApJS, 47, 139
- (14) Freedman, W. L., Hughes, S. M., Madore B. F., Mould, J. R., Lee, M. G., Stetson, P, Kennicutt, R. C., Turner, A., Ferrarese, L., Ford, H., Graham, J. A., Hill, R., Hoessel, J. G., Huchra, J., Illingworth, G. D. 1994, ApJ, 427, 628
- (15) Freedman, W. L., & Madore, B. F. 1990, ApJ, 365, 186
- (16) Gallart, C., Freedman, W. L., Aparicio, A., Bertelli, G., & Chiosi, C. 1999, AJ, 118, 2245
- (17) Huchtmeier, W. K., & Richter, O. G. 1988, A&A, 203, 237
- (18) Isobe, T., & Feigelson, E. D. 1992, ApJS, 79, 197
- (19) Israel, F. P., Tacconi, L. J., & Baas, F. 1995, A&AS, 295, 599
- (20) Karachentseva, V. E., & Vavilova, I. B. 1994, in Proc. ESO/OHP wrokshop 49, Dwarf Galaxies, ed. G. Meylan & P. Prugniel. (Garching: ESO), 91
- (21) Kennicut, R. C. 1988, ApJ, 334, 144
- (22) Kraan-Korteweg, R. C., & Tammann, G. A. 1979, AN, 300, 181
- (23) Kroupa, P., Tout, C. A., & Gilmore, G. 1993, MNRAS, 262, 545
- (24) Landolt, A. U. 1992, AJ, 104, 340
- (25) Lee, M. G., Freedman, W. L., & Madore, B. F. 1993, ApJ, 417, 553
- (26) Lin, D. N. C., & Faber, S. M. 1983, ApJ, 266, L21
- (27) Mateo, M. 1998, ARA&A, 36, 435
- (28) Martínez-Delgado, D., & Aparicio, A. 1999, ApJ, 480 L107
- (29) Martínez-Delgado, D., Gallart, C., & Aparicio, A. 1999, AJ, 118 862
- (30) Melisse, J. P. M., & Israel, F. P. 1994, A&AS, 103, 391
- (31) Minniti, D., Zijlstra, A. A. 1996, ApJ, 467, L13
- (32) Minniti, D., Zijlstra, A. A., & Alonso, M. V. 1999, AJ, 117, 881
- (33) Oke, J. B. 1990, AJ, 99, 1621
- (34) Peebles, P. J. E. 1989, ApJ, 344, L53
- (35) Peimbert, M., Colín, P., & Sarmiento, A. 1994, in Violent Star Formation, ed. G. Tenorio-Tagle (Cambridge University Press, Cambridge), 79
- (36) Prugniel, Ph., & Héraudeau, Ph. 1998, A&AS, 128, 299
- (37) Stetson, P. B. 1987, PASP, 99, 191
- (38) Stetson, P. B. 1994, PASP, 106, 250
- (39) Schulte-Ladbeck, R. E., Hopp, U., Crone, M. M., & Greggio, L. 1999, ApJ, 525, 709
- (40) Thuan, T. X., & Sauvage, M. 1992, A&AS, 92, 749
- (41) van den Bergh, S. 1959, Pub. David Dunlap Observatory, vol. II, n. 5
- (42)


| Date | Object | Time (UT) | Filter | Exp. time (s) | FWHM (′′) |
|---|---|---|---|---|---|
| 97.07.28 | DDO 190 | 21:03 | 1200 | 0.60 | |
| 97.07.28 | DDO 190 | 21:24 | 1200 | 0.60 | |
| 97.07.28 | DDO 190 | 21:45 | 1000 | 0.50 | |
| 97.07.28 | DDO 190 | 22:03 | 1000 | 0.55 | |
| 97.07.29 | DDO 190 | 21:35 | Hα | 900 | 0.75 |
| 97.07.29 | DDO 190 | 21:50 | Hα | 900 | 0.75 |
| 97.07.29 | DDO 190 | 22:06 | Hα-cont | 600 | 0.80 |
| 97.07.29 | Field | 23:08 | 600 | 1.05 | |
| 97.07.29 | Field | 23:18 | 600 | 0.80 | |
| 97.07.29 | Field | 23:30 | 600 | 0.80 | |
| 97.07.29 | Field | 23:40 | 600 | 0.95 |
| Id. | Flux | Luminosity | |
|---|---|---|---|
| erg s-1 cm-2 | erg s-1 | s-1 | |
| 1 | 0.12 | 0.12 | 0.88 |
| 2 | 1.04 | 1.01 | 7.38 |
| 3 | 1.29 | 1.25 | 9.12 |
| 4 | 0.41 | 0.40 | 2.92 |
| 5 | 1.21 | 1.17 | 8.54 |
| 6 | 2.72 | 2.63 | 19.20 |
| 7 | 0.90 | 0.87 | 6.35 |
| 8 | 0.15 | 0.15 | 1.10 |
| Total | 9.34 | 9.05 | 66.06 |
| Regions | |||||
|---|---|---|---|---|---|
| 1 | 2 | 3 | 4 | Outer | |
| (M☉yr-1) | 0.1: | ||||
| (M☉yr-1) | 0.1: | ||||
| (M☉yr-1) | 0.15: | ||||
| (M☉yr-1) | 0 | 0 | 0 | ||
| (M☉yr-1) | 0 | 0 | 0 | ||
| (M☉yr-1) | 0 | 0 | 0 | ||
| (M☉yr-1) | 0 | 0 | 0 | 0 | |
| (M☉yr-1pc-2) | 0.01: | ||||
| (M☉yr-1pc-2) | 0.01: | ||||
| (M☉yr-1pc-2) | 0.015: | ||||
| (M☉yr-1pc-2) | 0 | 0 | 0 | ||
| (M☉yr-1pc-2) | 0 | 0 | 0 | ||
| (M☉yr-1pc-2) | 0 | 0 | 0 | ||
| (M☉yr-1pc-2) | 0 | 0 | 0 | 0 | |
| , | , |
| –2.0 (1) | |
| (Mpc) | 2.9 (1) |
| (Mpc) | 2.9 (1) |
| –14.30 (4) | |
| –14.59 (4) | |
| 30 (1,2) | |
| (L⊙) | 8.6 |
| (L⊙) | 6.1 |
| (M☉) | 1.8 (1) |
| (M☉) | 6.6 (2,3) |
| (M☉) | 29 (2,3) |
| 0.79 | |
| 0.71 | |
| (M☉/L⊙) | 1.1 |
| (M☉/L⊙) | 4.8 |
References. — (1) This paper; (2) Fischer, & Tully (1981); (3) Hutchmeier, & Richter (1988); (4) Prugniel, & Héraudeau (1998)