A GRB Tool Shed
Abstract
We describe the design of a suite of software tools to allow users to query Gamma Ray Burst (GRB) data and perform data mining expeditions. We call this suite of tools a shed (SHell for Expeditions using Datamining). Our schedule is to have a completed prototype (funded via the NASA AISRP) by February, 2002. Meanwhile, interested users will find a partially functioning tool shed at http://grb.mankato.msus.edu.
Introduction
We are implementing a suite of software tools to aid Gamma-Ray Burst (GRB) researchers in working with the GRB data. The major features of the tool shed — a SHell for Expeditions using Datamining — are a web-based data query facility, web-based data visualization capability, and a web-based interface to data mining software tools. The tool shed maintains a database of users allowing each user to store their own work at the tool shed site. Each user’s data will not be visible to other users of the system.
Our GRB tool shed is populated with a standard set of preprocessed GRB data such as the basic table data, flux/fluence data, and duration 4BCAT . These data are stored in tabular form as rows (burst instances) and columns (attributes). Each burst has the same attributes as all other bursts, with a provision for indicating “missing” attributes. Users may augment this database by uploading their own table or performing SQL database queries for data selection and calculations.
The data mining tools can be given any of the queried data and produce either rules for classification of bursts or an identification of classes of bursts by identifying which bursts belong to which class. Note that these “identified” classes are not necessarily classes based on physical properties of bursts; they may be due to instrumental bias, or even statistical fluctuations from the small numbers of instances (c.f. HHP+99 ). This step can lead to defining new data in new tables for further exploration. An example of applying these tools is given in HHR+99 .
Data Storage
Once a registered user has logged in, the data can be manipulated in a variety of ways. The user may simply query the existing data, selecting a subset of the bursts and/or attributes for later processing. They may augment the data by uploading their own attributes for existing bursts. Or they may augment the data by uploading information for new bursts.
As an example database query, consider selecting all bursts from the 4B catalog with high relative measurement errors on the channel 1 fluence measurement. To determine what might be considered “high”, it may be necessary to see all of the bursts sorted by relative measurement error, easily done with this SQL query:
SELECT burstnum, channel1FluenceError FROM 4BFluxTable
WHERE channel1Fluence <> 0
ORDER BY (channel1FluenceError/channel1Fluence);
Now, after viewing the results of this query, one may decide that a “quality” threshold of 1.0 standard deviations would be required on the fluence data. The quality data can be extracted using this query:
SELECT burstnum, channel1Fluence, channel1FluenceError
FROM 4BFluxTable WHERE channel1Fluence <> 0
AND (channel1FluenceError/channel1Fluence) > 1.0;
For those users unfamiliar with SQL, the web application will provide point-and-click, fill-in-the-box forms for generating a database query. These web pages should provide the user with most of the features they would be interested in. There will also be a blank form for users who may wish to enter the SQL query directly. Either way, the names of the tables and attributes will be shown on the web browser so the user need not memorize them.
Data Visualization
At any time the user may decide to invoke visualization tools to help “see” the data in their scratch area or in the system tables. The web application will send these requests to ION (IDL On the Net) to produce graphical views of the data. The display of these graphs will be done on the user’s web browser window.
Data Mining Tools
Several data mining tools will be available as part of the web application. Initially, there will be the classic classification tool, C4.5 C45 , a tool developed by a member of our group, ESX RGHH99 , and at least one Neural Network package. These software packages run on the web server and the web application will guide the user, requesting information needed by the specific data mining tool being invoked.
The output from the data mining tools differ from one tool to the next. Our web application will be able to capture the output and transform it to an internal “rule” format. Once captured, the user may view the rules, or go even one step further by applying the rules to a database in their scratch area. The application of the rules to the data is a significant feedback component of the tool shed.
Online Help
There will be extensive online help to guide the user through the data mining process. The help system will be written in a hyper-linked book format complete with a table of contents, an index, and a search engine. There will also be context-sensitive help in the sense of hyper-links from web forms to relevant pages of the help system. The help system will address how to use the tool. The GRB data will be minimally documented, with pointers (hyper-links) to existing help in understanding the meaning of the data attributes.
A tutorial will be provided that brings the user through a data mining session. This tutorial will provide (scientific) rationale for selecting options along with way. Although the tool shed need will not be specific to GRB data, the tutorial will be.
GRB Tool Shed System Platform
The GRB tool shed will initially run on a pentium-class computer system running RedHat Linux. To maximize portability, the Java language will be used. Since this tool is web-based, all of the Java code will run as Java Servlets. The Apache web server will be used along with its companion Java Servlet Apache-JServ. The GRB data will be stored in a PostgreSQL database with access to the Java code provided via JDBC. All of these software packages are available on many platforms, including Unix, Windows, and Mac, and they are all freely available. The flow of information through these packages is shown in Figure 1.
This whole process is initiated by aiming a web browser at the appropriate URL (http://grb.mankato.msus.edu/) where the Apache web server is configured to start a Java Servlet via Apach JServ. The Java Servlet will then make requests to the PostgreSQL database via the JDBC package that comes with PostgreSQL. The major development effort for this application is in the creation of the Java Servlet code, which we call “the web application.”
GRB Tool Shed Data Flow
The Java Servlet application is a complex set of Java code with many data structures and interfaces. There are two major data formats that will be used: Standard User Interface Format (SUIF) and Standard Internal Classifier Format (SICF). The SUIF will be used when presenting data to the user on the client machine (web browser). And SICF will be used when presenting data to any of the supported classifiers (data mining tools). The SICF format is proposed as a tool-independent representation format for holding all information necessary to conduct a classification/data mining run.
We expect to provide a user interface on the web browser that looks very much like a spreadsheet program. This familiar view will allow the user to inspect and possibly update data easily.
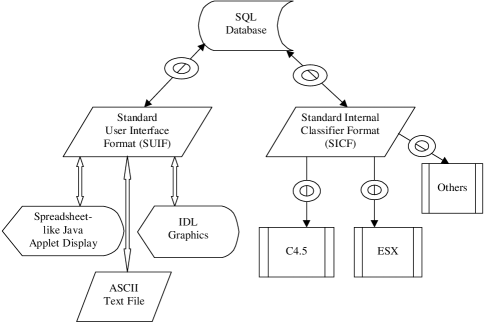
Note that a “donut” object indicates a data format conversion is needed at that point. Some of these data format conversions may require additional information, which would require the use of web pages to interact with the user. And the wide arrows indicate data flowing across the internet from server to client (browser).
The control of when and where the data flows is completely independent of this diagram. Imagine a controller sitting above this page directing the data to flow along the various paths of the diagram. This controller is a web-based menu system under the direction of the user.
Web Pages (Control Flow)
The design of this perspective of the GRB Tool Shed is least developed at this time. It is clear there needs to be a login menu screen. Once that information has been verified, the user will be placed in a main menu/dispatcher web page. This page will allow the user to click on various functions on a menu bar either along the side, the top, or the bottom. The menu selections/actions might be:
| graph/visualize data | show data in spreadsheet form |
| initiate upload/download of data | work with the data (query database) |
| initiate classification | view documentation |
Each of these items constitutes a large implementation effort. For example, the “work with the data” selection initiates a sequence of web pages/forms where the user is required to make selection criteria for the various rows and columns of the data. The “initiate classification” selection will cause the user to be prompted for which classifier tool to invoke, then guide the user through selecting parameter values that are specific to that tool.
Conclusions
With the creation of this software comes a powerful research tool capable of automating many aspects of manipulating GRB data. Our goal is to go beyond the tool creation and build up the collection of attributes about the GRBs, emerging as a significant repository of GRB information with a built-in efficient methodology.
Our implementation strategy is to incrementally develop components. That way, as the development progresses, the web application will contain some usable software and data.
References
- (1) Paciesas, W.S., et al., 1999, ApJ, 519, 206.
- (2) Hakkila, J., et al., submitted to APJ.
- (3) Hakkila, J., et al., this conference.
- (4) Quinlan, J.R., C4.5: Programs for Machine Learning, San Francisco: Morgan Kaurmann, 1993.
- (5) Roiger, R.J., et al., “ESX – A Tool for Knowledge Discovery”, in Proc. of the Federal Data Mining Symp. & Exposition ’99, edited by W.T. Price, AFCEA International, publisher, Fairfax VA., 1999, pp. 109–120.