Present-address: Max-Planck I. f. extraterrestrische Physik, Postfach 1603, D-85740 Garching, Germany 22institutetext: Osservatorio Astrofisico di Arcetri, Largo E. Fermi 5, I-50125 Firenze, Italy, e-mail: cimatti@arcetri.astro.it 33institutetext: Institut de Radioastronomie Millimétrique, 300, rue de la Piscine, St. Martin d’Hères, France e-mail: loinard@iram.fr 44institutetext: Sterrewacht Leiden, Sterrewacht, Postbus 9513, Leiden 2300 RA the Netherlands e-mail: rottgeri@strw.leidenuniv.nl
CO detection of the extremely red galaxy HR10
Abstract
CO and emission lines were detected towards the extremely red galaxy (ERG) HR10 (J164502+4626.4) at . The CO intensities imply a molecular gas mass M(H2) of h M⊙, and, combined with the intensity of the dust continuum, a gas-to-dust mass ratio around 200-400 (assuming galactic values for the conversion factors). The peak of the CO lines are at the same redshift as the [OII]3727 line, but blue-shifted by 430 km s-1 from the H line. These CO detections confirm the previous results that HR10 is a highly obscured object with a large thermal far–infrared luminosity and a high star–formation rate. The overall properties of HR10 (CO detection, LFIR to L ratio, and FIR to radio flux ratio) clearly favour the hypothesis that its extreme characteristics are related to star–formation processes rather than to a hidden AGN.
Key Words.:
ISM: molecules - Galaxies: formation - Galaxies: individual (HR10)1 Introduction
The recent detections of CO emission at cosmological distances provide hints about the physical structure of newly formed objects (Combes, Maoli & Omont (1999) and reference therein). A measure of the total gas and dust mass is indeed a very useful indicator of the object evolutionary status, because it provides an estimation of the fraction of the galaxy which has yet to be turned into stars at the epoch of observation. At high redshifts such measurements, therefore, provide hints about the occurrence of active star-formation processes and help in investigating models of galaxy formation (Silk & Spaans (1997)).
Only a handful of distant objects was detected so far in CO, and most of them appear to be magnified by gravitational lenses (table 1). For these objects the mass of molecular gas inferred from the CO intensities – corrected for gravitational amplification and using the Galactic CO to H2 conversion factor – turns out to be % of the total dynamical mass, with typical values of M(H2) M⊙. These masses could be somewhat smaller if the CO to H2 conversion factor were higher than in the Galaxy. Large quantities of CO are expected when large FIR luminosities and dust content are detected. Most of the objects detected until now in CO were indeed selected because they were dust–rich systems.
| Name | type | redshift | M ( M⊙) | references |
|---|---|---|---|---|
| F10214+4724 l | ULIRG | 2.28 | 4.2⋆ | Solomon et al. (1992) |
| Cloverleaf l | QSO | 2.558 | 0.9⋆ | Barvainis et al. (1994) |
| BR1202-0725 l | QSO | 4.69 | 2.4 | Ohta et al. (1996); Omont et al. 1996 |
| MG0414+0534 l | QSO | 2.639 | 3.3 | Barvainis et al. (1998) |
| SMM02399-0136 l | submm-HLG | 2.808 | 1.8⋆ | Frayer et al. (1998) |
| SMM14011+0252 l | submm-HLG | 2.565 | 1.1⋆ | Frayer et al. (1999) |
| APM08279+5255 l | BAL quasar | 3.911 | 0.03⋆ | Downes et al. (1999) |
| BRI1335-0417 | QSO | 4.407 | 2.4 | Guilloteau et al. (1997) |
| 53W002 | weak RG | 2.39 | 1.3 | Scoville et al. 1997a ; Alloin et al. (1999) |
| 4C 60.07 | RG | 3.79 | 1.8 | Papadopoulos et al. (1999) |
| 6C 1909+722 | RG | 3.53 | 1.0 | Papadopoulos et al. (1999) |
: evidence for a lensed object
: corrected for magnification
HR10 belongs to the class of objects with very red colours (). Their faintness at optical/NIR wavelengths makes the redshift determination and the investigation of their nature difficult even with 4m class telescopes. HR10 is so far the only one with a measured spectroscopic redshift (Graham & Dey (1996)). One of the main issues regarding ERGs is whether they are young and starbursting galaxies hidden in the optical by a large amount of dust or whether they are old passively evolving galaxies at . Recent results indicate that both classes contribute to the population of ERGs (Cimatti et al (1999)). HR10 was first detected in the submm/mm continuum with the IRAM 30m equipped with the MPIfR bolometer and with the JCMT equipped with the SCUBA double arrays (Cimatti et al (1998)). Subsequent observations confirmed the submm detection of this galaxy (Dey et al. (1999)). The inferred properties of this object show its extraordinary nature: its dust mass is M⊙ and its total FIR luminosity in the range 10 –2000 m rest–frame is L⊙ (H Mpc/km/s). This places HR10 in the class of the ultra-luminous infrared galaxies and suggests the presence of a star–forming object with a SFR of M⊙ yr-1 or even higher.
In this paper we present CO(2-1) and CO(5-4) observations of HR10 made with the IRAM Plateau de Bure interferometer. The observations are described in Sect. 2, the resulting detection of both lines are presented in Sect. 3, while implications of these measurements are reported in Sect. 4. Throughout the paper, we adopt H Mpc/km/s and q.
2 Observations
The observations were done partly during the winter 1998-99 and partly during the summer of 1999 with the IRAM Plateau de Bure Interferometer. A dual SIS 3mm/1.3mm receiver was used to observe simultaneously the CO(2-1) (redshifted in the 3mm band) and the CO(5-4) (redshifted in the 1.3mm band) lines. In both cases, the 3mm receiver was connected to two units of the Correlator, providing a velocity coverage of about 850 km s-1, while 4 units were connected to the 1.3mm receiver providing a velocity coverage of about 650 km s-1. The observations made during the winter 1998-99 assumed a redshift of deduced from the H line. This yields frequencies of GHz for the CO(2-1) line and GHz for the CO(5-4) line. Both lines were detected, but blue-shifted by about 400 km s-1 with respect to the H line and thus truncated. The observations were repeated during the summer 1999 with a new frequency setup: GHz and GHz for the CO(2-1) and CO(5-4) lines respectively. The observations were made in the CD configuration of the interferometer. The phase drifts were calibrated by observing the nearby quasars 1633+382 and 1732+389 every 20 minutes throughout the observations. The amplitude was calibrated with the quasars 3C273, 3C345 and 2145+067, and the compact H ii region MWC349 at the beginning and/or the end of each transit. The passband of the system was calibrated using 3C273 or 2145+067. At 1.3mm, the total useful integration time on source was about 9 hours during the winter 1998/99, and 12 hours during the summer 1999. More integration time was available at 3mm because some additional data were obtained, marginal at 1.3mm but of good quality at 3mm. The 3mm receiver was tuned in single side band, while the 1.3mm was tuned in double side band, with the CO(5-4) in the lower side band. The upper side band was then available to measure the continuum.
Three visibility tables were produced from the calibrated data: two spectral tables containing the CO(2-1) and CO(5-4) data respectively and one continuum table with the 1.3mm continuum. The spectral data were smoothed in frequency to improve their signal-to-noise ratio: the velocity resolution of the CO(2-1) data was smoothed to 50 km s-1 and that of the CO(5-4) to 75 km s-1. The UV tables were imaged, CLEANed and restored with elliptical gaussian beams of () and () for the 3mm and 1.3mm data respectively.
3 Results
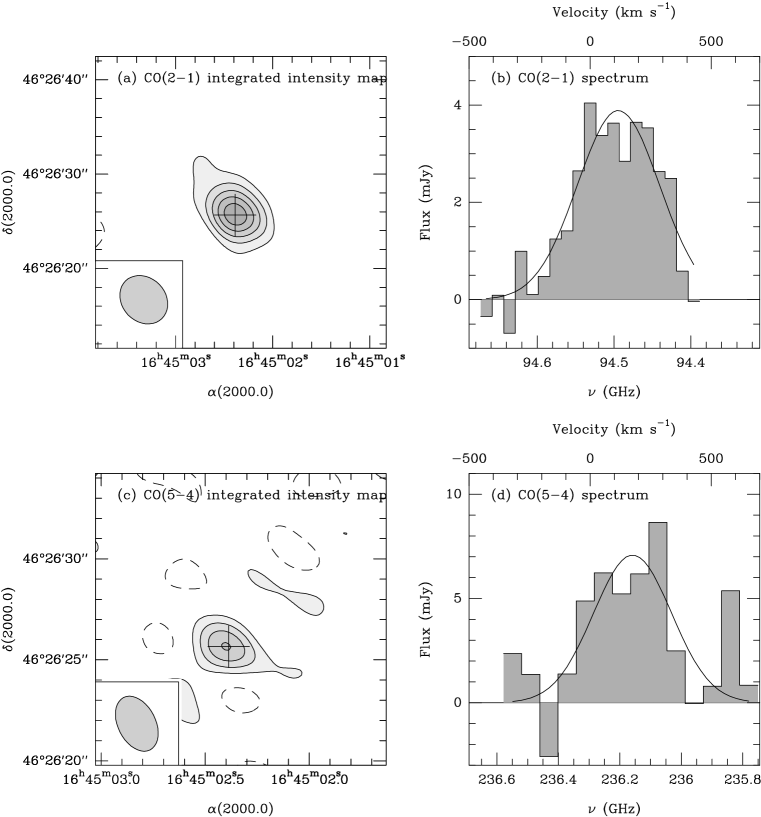
Signal is detected in the central channels of both the CO(2-1) and CO(5-4) spectral data sets at 10 and 5 sigmas respectively. The averages of the channels with detected emission were used to produce the integrated maps shown on Figs. 1a and 1c. The CO(2-1) integrated flux is 1.4 Jy km s-1. There is no indication for any extension of the emission at this resolution. The peak of the source is offset by about from the position of the optical source as measured by HST (Dey et al. (1999)). This offset is well within the astrometric accuracy of HST but if real it may be indicative of a spatial extinction.
The corresponding CO(2-1) profile (Fig 1b) is roughly gaussian, with a FWHM of almost exactly 400 km s-1, and a central frequency that corresponds to a redshift of . The appearance of a flat-top or even double peak profile around km s-1 (see Fig1b) cannot be checked with the present data and only observations at higher signal-to-noise ratio (those exploiting the full spectral resolution) can settle its reality. The line-width observed is fairly large, although not atypical for this kind of sources (e.g. SMMJ02399, Frayer et al. 1998) and could be due either to an edge-on system or to various separate components. The redshift deduced from the CO line is apparently shifted from that deduced from the H line (), but corresponds to the redshift deduced from the [O ii] line at 3727 Å (). This shift is still within the uncertainties in the optical redshift but if real it would be different from what is typically found for low redshift luminous galaxies (Sanders & Mirabel (1996)), where systematic blue-ward offsets of optical lines from the CO redshift are attributed to outflows with dust obscuration (see e.g., Gonzalez-Delgado et al. (1998)). The question remains, however, completely open since a recent analysis by McIntosh et al. (1999) of a sample of quasars shows how high-redshift objects present H lines with a systematic mean red-ward shift of 500 km/s with respect to the systemic redshift of the objects (that defined by the narrow line region). Even though the comparison with quasars may not be fair since the line emitting regions could be different, HR10 seems to show similar properties with the CO redshift corresponding to that of the narrow forbidden lines and coinciding with the centre of mass of the system, while the H line is shifted with respect to that.
The integrated map corresponding to the CO(5-4) map (Fig. 1c) shows a source at the same position as the CO(2-1) integrated map. The integrated intensity of that source (corrected for the contribution of the continuum) is 1.35 Jy km s-1. The corresponding CO(5-4) profile (Fig. 1d) is roughly gaussian, with a FWHM of 380 km s-1 similar to that of the CO(2-1) profile. The central frequency corresponds to a redshift of similar to that deduced from the CO(2-1) line. Although the CO level is above the ground state the integrated flux (in Jy km s-1) of CO(5-4) is equal to that of the CO(2-1) line, . CO luminosities, in solar units, are and L⊙ for the CO(2-1) and CO(5-4) line respectively, while the total line luminosities L are and K km s-1 pc2 , for the CO(2-1) and CO(5-4) line respectively. When expressed in these latter units, the ratio between the CO(2-1) and CO(5-4) luminosities of the same source is proportional to the line intrinsic brightness (Rayleigh-Jeans) temperature ratio integrated over the area of the source:
| (1) |
where is the source solid angle. If the spatial extent of the CO(5-4) emission region is similar to that of the CO(2-1) – a plausible hypothesis since both transitions have same line-width and profile – and corresponds to a value of the excitation temperature of K (see e.g. Maloney, & Black (1988)). If gas and dust are in thermodynamic equilibrium the kinetic temperature would equal , but it is usually found that . In HR10 the dust temperature was estimated to be (Cimatti et al (1998); Dey et al. (1999)) and this value can be taken as the upper limit to the gas temperature. If we assume that K the gas density implied by this ratio is less than . As an example, at K and K the estimated excitation temperature is K for a CO density of . The present data cannot distinguish between a picture where the dominant component of the ISM in this system is a diffuse () gas or whether the medium is clumpy. The spatial shift between the CO and H lines would be more compatible with this latter picture.
If the ratio between L and the mass of molecular gas is similar in HR10 and Arp 220 (Scoville et al. 1997b ), the molecular gas mass in HR10, using the CO(2-1) line, is , larger than what is usually found in local ULIRGs (Solomon et al. (1997); Braine & Dumke (1998)) but similar to that of other detected high-z sources (Frayer et al. (1998)).
The 1.3mm continuum map shows only a marginal () detection at the position of the source, with an integrated flux of mJy beam-1. The flux detected with the IRAM 30m telescope was mJy (Cimatti et al (1998)) at 240 GHz. Scaling the flux as , the PdBI detection would correspond to an expected flux of mJy at the observed frequency of the 30m. We exclude that this discrepancy is due to an extended component; it is more likely due to the difference in the calibration of the two instruments since the two values are consistent within the error bars.
4 Implications
The analysis of the spectral energy distribution of HR10 shows the presence of thermal emission at rest-frame with a range of dust temperatures between 30 and 45 K. The implied total dust mass is M⊙ (for a dust emissivity index of 2, Cimatti et al (1998)). Therefore the resulting gas-to-dust mass ratio for HR10 ranges between 200 and 400, as local spirals (Andreani, Casoli & Gerin (1995)), ULIRGs (Solomon et al. (1997)) and also sub-mm selected luminous sources show (Frayer et al. (1999)). The total rest-frame far-IR luminosity in the range is L⊙ (Cimatti et al (1999)) as estimated taking into account the ISO upper limits at 90 and 170 (Ivison et al (1997)). When these latter are not considered and the 450 detection is included the luminosity turns out to be a factor of 3 larger (Dey et al. (1999)). The ratio lies therefore in the range (K km s-1 pc2)-1, which agrees with the relation found for nearby luminous galaxies (Sanders & Mirabel (1996)), whose emission is mainly powered by star-formation. Objects whose FIR emission is dominated by an AGN – as the hyperluminous Infrared Galaxies – show much larger and do not even show up in CO (e.g., Evans et al. (1998)). This indicates that the overall FIR emission by HR10 is dominated by star formation. Assuming that most of the FIR luminosity is due to recent OB star formation activity, the star formation rate turns out to be M⊙/yr. Star formation efficiency is usually measured by the ratios and (see e.g. Young (1999)). While the former shows indeed quite a high value () similar to that of merging local systems (Young (1999)), the latter is of only 0.007 and very likely indicates a large extinction affecting the H emission.
With the values above for molecular mass and SFR this active phase of gas depletion lifetime should have lasted at least:
| (2) |
The large value of gas conversion into stars (with respect to local galaxies) could be consistent with two possible scenarios: either a genuinely young galaxy in the process of active star-formation (and the detected amount of gas seems enough to feed it), or the presence of a large amount of gas could be the result of a merging process of two discs (in this latter case the resulting galaxy will have a mass of a present-day massive elliptical).
Most of the properties of HR10 suggest that the ‘locus’, which best characterizes it, is that of local ULIRGs (Hughes, Dunlop, Rawlings (1997)). HR10 follows also the expected tight correlation between the infrared flux and the radio continuum: in fact the logarithmic ratio of FIR (60 ) and radio (1.5GHz) continuum flux density (in HR10 rest-frame) again falls within the value of nearby starbursts (Sanders & Mirabel (1996)). Furthermore, the ratio between the line (2-1) and (5-4) and the FIR luminosities, and , agree with a model of CO emission in high redshift galaxies, based on an extrapolation of the properties of local ULIRGs (Blain et al. (1999)).
With the detected line width and the upper limit on the CO source size, given by the effective beam width , the upper limit to the total dynamical mass contained within the CO emitting region is:
| (3) |
where is the observed deconvolved line width, is the inclination and is the linear diameter of the source (). The resulting dynamical mass is a factor of 5 larger than the estimation of the molecular mass. The two values would coincide if the CO emission were concentrated within the inner 10 kpc.
Acknowledgements.
We are grateful to Roberto Neri for his help during the data reduction and analysis, all the IRAM staff for providing us with excellent data and the referee, Francoise Combes, for helping in the interpretation of these observations. Part of this work was supported by the CNR contract progetto strategico ”Astronomia Submillimetrica” del Comitato Scienze Fisiche. P.A. thanks MPE for hospitality during 1999 when this work was done. We dedicate this paper to the memory of the 25 people who lost their lives in the tragedies of the Plateau de Bure cable-car and helicopter.References
- Alloin et al. (1999) Alloin D., Barvainis R., Guilloteau S., 1999, astro-ph/9910196
- Andreani, Casoli & Gerin (1995) Andreani P., Casoli F., Gerin M., 1995, A&A 300, 43
- Barvainis et al. (1998) Barvainis R., Alloin D., Guilloteau S., Antonucci R., 1998, ApJ 492, L13
- Barvainis et al. (1994) Barvainis R., Tacconi L., Antonucci R., Coleman P. 1994, Nat 371, 586
- Blain et al. (1999) Blain A. et al., 1999, astro-ph/9911108
- Braine & Dumke (1998) Braine J. & Dumke M., 1998 A&A 333, 38
- Cimatti et al (1998) Cimatti A., Andreani P., Röttgering H., Tilanus R., 1998, Nat 392, 895.
- Cimatti et al (1999) Cimatti A., Andreani P., Röttgering H., Tilanus R., 1999, Proc. Xth Rencontres de Blois “ The Birth of Galaxies’, Blois, France June 1998, eds. B. Guiderdoni et al.
- Cimatti et al (1999) Cimatti A. et al. 1999, A&A 352, L45
- Combes, Maoli & Omont (1999) Combes F., Maoli R., Omont A., 1999, A&A 345, 369
- Dey et al. (1999) Dey A., Graham J.R., Ivison R.J., Smail I., Wright G.S., Liu M.C., 1999, ApJ 519, 610
- Downes et al. (1999) Downes D., Neri R., Wiklind T., Wilner D.J., Shaver P. 1999, ApJ 513, L1
- Evans et al. (1998) Evans A.S., Sanders D.B., Cutri R.M., Radford S.J.E., Surace J.A., Solomon P.M., Downes D., Kramer C. 1998, ApJ 506, 205
- Frayer et al. (1998) Frayer D.T.,Ivison R.J.,Scoville N.Z. et al. 1998, ApJ 506, L7
- Frayer et al. (1999) Frayer D.T.,Ivison R.J.,Scoville N.Z. et al. 1999, ApJ 514, L13
- Gonzalez-Delgado et al. (1998) Gonzalez-Delgado R.M., Leitherer C., Heckman T., Lowenthal J.D., Ferguson H.C., Robert C. 1998, ApJ 495, 698
- Graham & Dey (1996) Graham J.R., Dey A., 1996, ApJ 471, 720
- Guilloteau et al. (1997) Guilloteau S., Omont A., McMahon R.G., Cox P., Petitjean P. 1997, A&A 328, L1
- Hughes, Dunlop, Rawlings (1997) Hughes D.H.,Dunlop J.S.,Rawlings S.,1997, MNRAS 289, 766
- Ivison et al (1997) Ivison, R.J., Archibald, E.N., Dey, A., Graham, J.R. 1997, in The Far-Infrared and Submillimetre Universe, Proc. of the ESA/IRAM Symposium, Grenoble, ESA Publications Division, ESTEC Noordwijk, the Netherlands, ESA-SP 401
- McIntosh et al. (1999) McIntosh D.H., Rix H.W., Rieke M.J., Foltz C.B., 1999, ApJ 517, L73
- Maloney, & Black (1988) Maloney P.R., Black J.H. 1988, ApJ 325, 389
- Ohta et al. (1996) Ohta K., Yamada T., Nakanishi K., Kohno K., Akiyama M., Kawabe R., 1996, Nat 382, 426
- (24) Omont A., Petitjean P., Guilloteau S., McMahon R.G., Solomon P.M., 1996, Nat 382, 428
- Papadopoulos et al. (1999) Papadopoulos P.P., Röttgering H.J.A., van der Werf P.,P., Guilloteau S., Omont A., van Breugel W.J.M. and Tilanus R., 1999, astrop-ph/9908286
- Sanders & Mirabel (1996) Sanders D.B. & Mirabel I.F. 1996 ARA&A 34, 749
- (27) Scoville N.Z., Yun M.S., Windhorst R.A., Keel W.C., Armus L. 1997a, ApJ 485, L21
- (28) Scoville N.Z., Yun M.S., Bryant 1997b, ApJ 484, 702
- Silk & Spaans (1997) Silk J., Spaans M. 1997, ApJ 488, L79
- Solomon et al. (1992) Solomon P.M., Downes D., Radford S.J.E., 1992, Nat 356, 318
- Solomon et al. (1997) Solomon P.M., Downes D., Radford S.J.E., Barrett J.W., 1997 ApJ 478, 144
- Young (1999) Young J. S., 1999, ApJ 514, L87