Modeling the X-ray – UV Correlations in NGC 7469
Abstract
We model the correlated X-ray – UV observations of NGC 7469, for which well sampled data in both these bands have been obtained recently in a multiwavelength monitoring campaign. To this end we derive the transfer function in wavelength and time lag , for reprocessing hard (X-ray) photons from a point source to softer ones (UV-optical) by an infinite plane (representing a cool, thin accretion disk) located at a given distance below the X-ray source, under the assumption that the X-ray flux is absorbed and emitted locally by the disk as a black body of temperature appropriate to the incident flux. Using the observed X-ray light curve as input we have computed the expected continuum UV emission as a function of time at several wavelengths (1315 Å, 6962 Å, 15000 Å, 30000 Å) assuming that the X-ray source is located one Schwarzschild radius above the disk plane, with the mass of the black hole and the latitude angle of the observer relative to the disk plane as free parameters. We have searched the parameter space of black hole masses and observer azimuthal angles but we were unable to reproduce UV light curves which would resemble, even remotely, those observed. We also explored whether particular combinations of the values of these parameters could lead to light curves whose statistical properties (i.e. the autocorrelation and cross correlation functions) would match those corresponding to the observed UV light curve at 1315 Å. Even though we considered black hole masses as large as M⊙ no such match was possible. Our results indicate that some of the fundamental assumptions of this model will have to be modified to obtain even approximate agreement between the observed and model X-ray – UV light curves.
submitted to Astrophys. J.
1 Introduction
The study of the physics of Active Galactic Nuclei (AGN) involves length scales much too small to be resolved by current technology or technology of the foreseeable future. As a result, this study is conducted mainly through the theoretical interpretation of the spectral and temporal properties of these systems, much in the way that the study of spectroscopic binaries has been used to deduce the properties of the binary system members and the elements of their orbit. Thus, studies of the spectral energy distribution in AGN have revealed the ubiquitous presence of a broad quasithermal component in the optical – UV part of the spectrum, the so called Big Blue Bump (BBB), as well as soft and hard ( keV) X-ray emission, which in cases of sufficiently bright objects, was found to extend to several hundred keV. At lower frequencies, AGN were found to emit roughly the same amount of luminosity in the IR and the far-IR part of the spectrum as in the higher energy bands. This rough equipartition of the AGN luminosity from the far-IR to the X-ray part of the electromagnetic spectrum is an interesting fact for which no apparent, compelling explanation is presently at hand.
It was proposed long ago (Shields 1978) that a feature such as the BBB would signify the presence of a geometrically thin, optically thick accretion disk. It is generally thought that these disks radiate away the locally dissipated accretion energy in black body form at the temperature required to deliver the necessary radiant flux. For a quasar of luminosity erg s-1 , associated with a black hole of mass the corresponding disk temperature is in reasonable agreement with the observed excess flux at the relevant wavelengths. The successful, detailed fits of the BBB feature as described above (Malkan & Sargent 1982; Malkan 1983; Sun & Malkan 1989; Laor & Netzer 1989), has convincingly established the identification of this spectral component with this specific structure of accretion flow onto the black hole. Even though certain of its properties do not completely conform with this notion, (e.g. the absence of prominent Ly edges, and the magnitude of polarization with wavelength (see Koratkar & Blaes 1999), it is generally considered that this spectral component does indicate the presence of a geometrically thin, optically thick disk in the vicinity of the AGN black hole.
The X-ray emission must originate in a tenuous, hot ( K) plasma, and its spectrum has been modeled successfully by Comptonization of soft photons by the hot electrons. The source of the soft photons is usually not specified but it is (naturally) considered to be the UV emission of the BBB, while the hot electrons are considered to be located in a corona overlying the BBB thin disk. This corona is thought to be confined and powered either by magnetic loops threading this disk, much the way it is the case with the solar corona (Galeev, Rossner & Vaiana 1979), or to be part of an Advection Dominated Flow (Narayan & Yi 1994) which are hot on their own right. The precise arrangement of these two components is not well defined; however, the form of the AGN spectral luminosity distribution between the optical–UV (BBB) and the X-ray bands suggests that only a small () fraction of the soft BBB photons traverse the volume occupied by the overlying hot electrons. This fact then suggests that either: (a) the hot plasma is confined in a small region with extent of only a few Schwarzschild radii around the black hole (while the BBB emission comes from a much larger region) or (b) the X-ray emitting plasma consists of small patches which cover only partially the thin disk (the source of BBB soft photons).
The sites of the IR and far-IR emission are thought to be at much larger distances from the compact object than that of the optical - UV emission, a conclusion reached on the basis of the much longer variability time scales in these components (Edelson & Malkan 1987) compared to those associated with the UV and the X-ray emission in AGN. In the context of unified AGN models, it is considered that the IR and far-IR emission results from reprocessing of the ionizing continuum by a molecular torus, whose inclination to the observer’s line of sight is believed responsible for the apparent dichotomy of Seyfert galaxies in types I and II.
While the above inferences and associations of the various spectral AGN components with specific spacial structures of rather well defined properties and location appear reasonable and make sense in the broader context of AGN physics, one has to bear in mind that they have been deduced mainly on the basis of spectral fits and radiative transfer. In this respect, it is well known (but some times not appreciated) that radiative transfer provides, generally, information only about column densities and optical depths (see e.g. Kazanas, Hua & Titarchuk 1997). However, in order to probe the dynamics and geometry of AGN one needs information about physical lengths and densities; these latter quantities have to be obtained by independent means, usually from time variability. For example, the goal of AGN monitoring (Netzer & Peterson 1987) has been precisely this, namely the determination of the physical size of the AGN Broad Line Region (BLR) using the reverberation mapping technique. The results of this effort have shown that the size of specific AGN components (the BLR region in this case) can in fact be very different from prior estimates based on spectral considerations alone (the size of BLR was found to be off by a factor of and the cloud density by a factor of ; for a review see Netzer & Peterson 1997).
An additional product of the extensive AGN multiwavelength monitoring efforts - which were aimed primarily in the determination of the BLR size from the continuum- Broad Emission Line correlations - has been the measurement of lags in the cross correlation functions between the optical and the UV continua. These are important because both these bands are part of the BBB and are hence thought to be produced by the putative thin accretion disk responsible for the emission of this spectral component. These studies indicated that the optical and the UV continua vary with much higher synchrony than expected on the basis of simple accretion disk models for the BBB emission. In the simplest models the variations in these two components should be propagating from the low to the high frequencies (the sense of mass inflow) and should be of order of the viscous time scales at the appropriate radii. Much shorter time scales are those associated with the propagation of sound waves traveling on the surface of the disk (in this case the UV variation could preceed that of the optical). Assuming a gas temperature K, typical of the values needed to account for the BBB spectral characteristics and a size cm, the sound crossing time scales are of order s, much longer than the s measured (Collier et al. 1998) or upper limits (Krolik et al. 1991) to the lags between the optical and UV wavelengths.
For the above reasons it was conjectured (Krolik et al. 1991) that the correlated optical – UV variability maybe caused by the reprocessing of X-rays, emitted by the hot corona overlying the thin disk, since this process yields signals which propagate much faster (at the speed of light) and might thus account for both the spectral and the temporal properties of these systems. However, the absence (until recently) of well coordinated, simultaneous observations in the X-ray and the UV – optical bands left this conjecture supported only by circumstantial evidence. In fact, timing studies and modeling limited to the correlations between UV and optical bands gave results consistent with such a picture: Rokaki & Magnan (1992) analyzed the results of the NGC 5548 monitoring campaign assuming that the observed variability is due to the reprocessing of an unseen harder spectral component (EUV - X-rays) by an optically thick geometrically thin disk. They found that the correlations between the continuum light curves at 1360, 1840, 2670 and 4870 Å are consistent with their assumption, provided that the X-ray source had a variability they themselves prescribed and it were located 15 above the plane of an accretion disk around a black hole of mass M⊙. Nonetheless, the absence of simultaneous X-ray observations, left this entire effort at the level of “reasonable conjecture”.
The launch of RXTE and the simultaneous presence of IUE in orbit made such coordinated observations possible: The active nucleus NGC 7469 was observed simultaneously both in the optical (Collier et al. 1998), in the UV (Wanders et al. 1997), and in the X-ray (Nandra et al. 1998) bands over an interval of roughly thirty days with a sampling rate no smaller than once every other orbit (in the UV and X-rays). The results of this campaign were rather startling and to some extent disappointing: While both the X-ray and the UV band exhibited variability of similar amplitudes (), there were no apparent, easily understood correlations between the variability of these two bands, at least none that could be attributed reasonably to reprocessing of the X-rays as the cause of the observed optical – UV variability. In the UV, Wanders et al. (1997), measured lags of 0.23, 0.32 and 0.28 days between the variations at 1315 Å and 1485, 1740 and 1825 Å respectively. With an error of 0.07 days determined through Monte Carlo simulations they were unable to decide conclucively whether these results represented variability in accordance with accretion disk models or variability due to contamination by a very broad delayed emission feature which becomes stronger toward the red part of the spectrum. The optical observations of Collier et al. (1998), in conjuction with those of the UV provided a much larger dynamic range in wavelength which allowed the determination of lags between the UV (1315 Å) and the optical (4815, 6962 Å) with greater confidence. The day relative lags between 1315 and 6962 Å measured can in fact be intepreted as due to reprocessing by an accretion disk, as generally considered; however, it is not apparent which part of the spectrum drives the observed variability, while there appears to be, in addition, an inconsistency by more than a factor of 10 between the observed an inferred luminosity of this specific model.
Motivated by these observations we have decided to take a closer look at this particular question through the detailed modeling of the specific situation thought to take place in the innermost regions of AGN. Our approach is straightforward and similar in spirit to the analysis of Rokaki & Magnan (1992) : In §2 we compute the response function of reprocessing X-rays, from a point source above an infinite plane, as a function of the wavelength of the reprocessed radiation , the lag time and the latitude angle of the observer with respect to the disk plane . In §3 we fold this response function with the observed X-ray light curve to produce model UV, optical and IR light curves for different values of the black hole mass and inclination angle. We then compute the autocorrelation and cross correlation functions of the model UV, optical and infrared light curves with that of the input X-ray and compare them to those observed. We search the black hole mass - latitude angle parameter space in search of combinations which would result in autocorrelation and cross correlation functions similar to those observed. Finally, in §4 the results are summarized and conclusions are drawn.
2 The Response Function
In order to make the problem of X-ray reprocessing from a hot corona into UV-optical radiation by an underlying cool, geometrically thin, optically thick accretion disk as tractable as possible we have made the following idealizations: We have assumed the source of X-rays to be point-like and located at a height above an infinite plane representing the accretion disk producing the UV - optical emission associated with the BBB. We believe that the above assumptions approximate adequately the situation under consideration in that the X-ray source does not cover completely the source of UV photons, as required by the spectral fits and discussed in the introduction. This assumption is furthermore confirmed a posteriori by the more rapid variability of the X-ray relative to the UV emission.
The geometric construction associated with the arrangement of the X-ray source and the accretion disk described above is given in Figure 1. We choose Cartesian coordinates with the axes on the plane of the disk, their origin on the compact object (black hole), and the X-ray source at a distance above the disk plane in the direction. The observer’s line of sight lies on the plane, along the -direction, as shown in the figure, making an angle with the plane of the disk.
The response function of the situation depicted in Figure 1 is obtained from the following considerations: The loci of a given constant temperature on the surface of the disk, due to the reprocessing of X-rays from the source , are circles centered around the foot of the vertical from the X-ray source to the disk plane; on the other hand, the loci of constant delay between the X-ray source and the observer are paraboloids of revolution about the observer - X-ray source axis (the axis) with the X-ray source as their focal point. The intersection of these paraboloids with the plane of the disk are generally ellipses; the response function is precisely the (thermal) emission by the intersection of the ellipses of constant delay with the circles of constant temperature on the disk. Because it is assumed that the reprocessed radiation is emitted in black body form at a temperature determined by the local X-ray flux, the determination of the response function reduces to computing the area of intersection of the constant delay ellipses with the circles of constant temperature.

To determine this quantity, we choose Cartesian coordinates whose origin is located on the extremum of the paraboloids of revolution (which have the source as their focal point) of a given constant delay , with the -axis pointing to the observer, also located on the plane. In these coordinates one can easily verify that the surfaces of constant delay are paraboloids of revolution of the form
| (1) |
with the distance between the origin of the coordinates (at the extremum of the paraboloids) and the X-ray source, located at their focal point, being .
We now consider a Cartesian coordinate system with its origin located on the compact source and with the and axes parallel to as shown in Figure 1. Let and be the coordinates of the X-ray source position in this system. Then, the relation between the coordinates and can be easily obatained from the geometric construction of Figure 1. These are
| (2) |
In terms of these coordinates the equation of paraboloids of constant delay (Eq. 1) reads
| (3) |
One can now express the coordinates of the source’s position and in terms of the height of the source above the disk and the observer’s latitude , which read:
| (4) |
The intersection of the paraboloids of constant delay with the disk plane (i.e. the isodelay curves on the disk plane) are obtained by finding the intersection of the paraboloid (Eq. 3) with the disk plane . This leads to
| (5) |
which after some rearrangement reads
| (6) |
This is the equation of a circle on the plane (the plane perpendicular to the observer’s line of sight to the X-ray source) of radius square , which, along with the equation for the accretion disk plane , give the parametric equations of the sought curve. Clearly the radius of the circle is non-zero only for sufficiently long lags, i.e. for , that is for the time it takes the corresponding isodelay surface to “cut” the surface of the accretion disk. For , the coordinate of the center of this circle is at a distance , i.e. symmetric about the origin of the system (i.e. the location of the black hole) and the intersection of the observer – X-ray source line on the plane. One can easily see that for the above value of the lag , the isodelay surfaces are tangent to the plane at the point .
In order to compute the equation of the intersection on the plane of the accretion disk, the above equation has to be expressed in terms of the coordinates on the plane . These are related to by the relation , , ; i.e. one has to project this circle onto the plane of the accretion disk. This, as expected, yields the equation of an ellipse, namely
| (7) |
Dropping the primes and defining polar coordinates on this plane, , , one obtains easily, solving for ,
| (8) |
This is the equation for the delays used by Rokaki & Magnan (1992), with the difference that their angle denotes the colattitude (inclination angle) rather than the lattitude of the observer with respect to the accretion disk, given in our notation.
One can now compute, by setting the value of the angle in Eq. (8) to , the range of values of the delay for which a ring of given radius will be illuminated by an instantaneous flash of X-rays emitted by the source at . These are
| (9) |
where the subscripts and refer to the leading and trailing times. Then, the entire interval of the illumination of a ring of radius on the plane of the accretion disk is , while the position at which the isodelay surface of lag touches the plane of the accretion disk is given by the projection of the circle of Eq. (6) onto this plane, i.e. at the point of radius .
Using Eq. (8) one can now compute the area of overlap between these two families of curves. The simplest way to do this is to form the cross product of the tangent vectors of these two families of curves at the points of their intersection . These vectors are and . After a considerable amount of algebra, performed with the use of Mathematica, the expression for the overlap area reduces to the following simple expression
| (10) |
with the values of given above.
One can now integrate the above area over all between and . This integration yields indicating that the Area function as given above is properly normalized. Therefore, the emitting area as a function of the time lag is
| (11) |
where and .
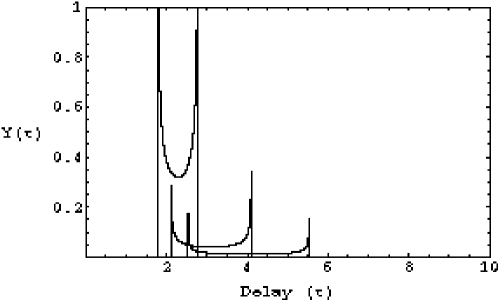
In Figure 2 we present the ratio of the overlap function divided by the cube of the radius of the disk as a function of the delay in units of , for and assuming . This is a quantity of interest as it indicates the reprocessed flux, integrated over all frequencies, contributed at a given lag by the appropriate radii, in units of . The figure makes apparent the rapid decrease of the reprocessed radiation with radius and also the increasing range of delays which contribute to the emission at a given radius with the increase of the radius. For the given geometry, most of the reprocessing is effected by the shortest radii . Also apparent in the figure are the (integrable) singularities associated with the instants of intersection of the constant temperature circles with the constant delay ellipses.
The response function at a wavelength and lag will be the flux contributed at a given wavelength by all radii of the disk which emit at the given lag . Assuming that the reprocessed radiation is emitted locally with a black body spectrum, the response function has the form
| (12) |
where is the Planck function of temperature . The limits of integration and are the minimum and maximum radii contributing to a given lag and are computed using Eq. (8) by setting and .
The temperature is calculated assuming that a fraction ( is the albedo of the disk) of the X-ray flux incident at a given point on the disk is thermalized and re emitted in black body form, i.e.
| (13) |
or
| (14) |
If the source of X-rays is not point-like but extended, a different relation between the flux and the distance to the disk would result; Rokaki & Magnan (1992), for example, have used the expression for a spherical source of radius . This would lead to a slightly different relation between and for . However, for large the above relation is essentially correct.
3 Reprocessing the X-ray Flux
Having obtained the expression for the response of the disk to X-ray illumination as a function of the frequency of the reprocessed radiation and the lag , one can now proceed to the computation of the time dependence of the reprocessed radiation at a given wavelength . If is the light curve of the observed X-ray radiation, then, the reprocessed emission at a wavelength as a function of time, , will be given by
| (15) | |||||
| (16) |
It is apparent from the discussion of the previous section that the quantity which sets the scale of the lag is the distance of the X-ray source from the disk, or alternatively, for extended sources the size of the X-ray emitting region, . We shall assume in the rest of this note, in order to fix our units, that this distance is equal to the Schwarzschild radius of the black hole. Since the scale of the temperature of the reprocessed radiation for the given, observed luminosity of NGC 7469 at a given radius is scaled by the value of measured in cm, should be larger than the Schwarzschild radius by a given factor, this could simply be reabsorbed in the value of the mass of the black hole, which would have to be decreased by the same factor.
Using as input the observed X-ray flux as a function of time, we employed Eq. (16) to compute the corresponding variations of the reprocessed flux at a number of wavelengths , for a set of values for the black hole mass and for two values of the latitude angle of the observer with respect to the plane of the disk . The (normalized) X-ray light curve in the 2-4 keV range we used is given in Figure 3. This light curve consists of 256 equally spaced points, each representing the average flux in an interval of 10,768 seconds, provided to us by P. Nandra. The flux was obtained by interpolation of the real light curve at the equally spaced intervals given in the figure. The details of these observations are given in Nandra et al. (1998). It is worth noting that in the first 10 days of the observing campaign the sampling interval was roughly half of that given in the figure (once every 90 min., or 5,400 s), while for the remaining of the campaign it was once every 180 minutes or 10,800 seconds. The values of the black hole mass used in our calculations were , while for the angle we used the values .


Figure 4 exhibits a representative set of such light curves corresponding to and for four different wavelengths, i.e. 1315Å, 6962Å, 15000Å ( Hz) and 30000Å ( Hz). The first two wavelengths were chosen to match those at which the UV and optical observations were made, while the last two in order to explore whether model light curves at different wavelengths could reproduce the general characteristics of the observed light curves. The general trend apparent in this figure is the “smoothing” of light curves with increasing wavelength, this “smoothing” becoming apparent already at 6962 Å. Such a trend is not surprising, as the contribution to the flux at these longer wavelengths comes from increasingly larger radii. In addition to the smoothing of the sharpest features associated with the X-ray light curve, the RMS variability also decreases significantly with increasing wavelength from at 1315 Å, to at 6962 Å, to at 15000 Å ( Hz), since an increasing range in the lag contributes to the emission at a given wavelength.

Figure 5 exhibits the effect of the black hole mass (or the height of the location of the X-ray source above the disk) on the light curves of the reprocessed radiation, where the light curves at a specific wavelength (1315 Å) are shown for three different values of the black hole mass . The most obvious feature in this figure is the increase of the flux with the increase of the black hole mass. This fact can be understood as follows: for a given constant reprocessed luminosity, an increase in the mass corresponds to a decrease in the corresponding disk effective temperature; since the 1315 Å wavelength is in the Rayleigh–Jeans part of the corresponding spectra, a smaller temperature requires, in this regime of the spectrum, a larger flux in order that the same luminosity be radiated away. Increase in the black hole mass leads also to a certain amount of smoothing and shifts in the corresponding light curves, which become most prominent at the largest values of this parameter (see also the figures of the autocorrelation and cross c correlation functions). These trends are expected, as a larger value for the black hole mass corresponds to a larger distance of the X-ray source from the reprocessing disk plane. In this respect, one should note that the increase of the mass from to M⊙ causes very little additional smoothing at 1315 Å. The flux in this wavelength is emitted by a region of extent , which, in both these cases, is smaller than the light crossing distance associated with the X-ray light curve sampling interval ( s), i.e. cm. The smoothing and shifting trends become more pronounced at longer wavelengths as it becomes apparent in Figure 6, where the reprocessed light curves are shown for two values of the wavelength (= 1315, 6962 Å) and two values of the black hole mass .

The effects of the inclination angle on the resulting light curves are shown in figure 7 which exhibits these light curves at 6962, 15000 Å for two different values of the observer’s latitude . One can see that the effect of the latitude on the light curve does increase with increasing wavelength: It is barely discernible at 6962 Å (it is even smaller at 1315 Å), but it is easily observable (though still small) at 15000 Å. Qualitatively, the larger inclination angle light curve preserves slightly more of the high frequency content of the X-ray light curve than does the lower inclination one () and it certainly has a faster “turn–on” phase. The reason for that is that in the former case part of the reprocessing takes place almost along the observer’s line of sight and thus does not get “washed-out” by time-of-travel across the source effects.

To cast the arguments given above concerning the “smoothing” and “shifting” of the model light curves with increasing black hole mass and wavelength in more quantitative form, we have computed the autocorrelation (ACF) functions of our model light curves (a sample of which is given in the figures above) as well as their cross correlation (CCF) functions with the input X-rays. We have searched the black hole mass and angle parameter space with the intent of comparing these ACFs and CCFs to those of NGC 7469 given in Nandra et al (1998). A slight technical detail should be mentioned here: the model light curves we produce using as input that of the X-rays have a “turn–on” phase; had this section of the light curve been included in the computation of the ACF and CCF, it would lead to unphysical forms for these functions. For instance, this “turn–on” feature would lead to an ACF for the 1315 Å light curve which is narrower than that of the X-ray light curve, an unphysical result since the latter signal can at best track the former exactly. To avoid such unphysical effects, in computing the ACF and CCF, we have excluded this “turn–on” section from the corresponding light curves. For the computation of the CCFs in particular, we have excluded at the same time an interval of equal length from the X-ray light curve too.


The ACFs are given in figures 8 and 9 for two different values of the black hole mass (, and for the four different wavelengths 1315Å, 6962Å, 15000Å ( Hz), 30000Å ( Hz) along with the ACF of the X-ray light curve itself depicted by the solid curve. These figures make more quantitative the statements made above concerning the “smoothing” of light curves with wavelength and black hole mass: The ACF of the 1315 Å light curve is almost identical to that of the X-rays and it changes very little with increasing the black hole mass from to M⊙. The ACFs become broader with increasing both the black hole mass and the wavelength of the corresponding emission, indicating progressively “smoother” light curves with changes in these parameters, in agreement with the above discussion.
The shift in time of the emission due to X-ray reprosessing relative to the incident X-rays themselves is given by their corresponding cross correlation functions (CCF). These are shown in Figures 10 and 11 respectively along with the observed value of the X-ray–UV CCF (Nandra et al. 1999), for the same values of the parameters used to produce the ACFs of Figures 8 and 9. The trends are similar to those of the ACFs: Increasing black hole masses and wavelengths lead to longer lags between the X-rays and the reprocessed radiation, again in agreement with the qualitative arguments made earlier. An exception to this rule is CCF of the light curve of 30000 Å for M⊙ and . The CCF these values of the parameters exhibits a behavior not unlike that corresponding to the CCF between the X-rays and the UV emission at 1315 Å in the data of Nandra et al. (1998). We believe that this particular feature is related to the specific form of the X-ray light curve. As it is apparent it disappears for a larger value of the black hole mass (see Figure 11).


Finally, in order to exhibit our results in a manner similar to that of Collier et al. (1998), who discussed in detail the UV – optical continuum lags of NGC 7469, and cast them in the parlance of accretion disk physics, we have produced the cross correlation of our model light curves at 6962 Å with those at 1315 Å. We have done that in two ways: (a)First we assumed, as done so far, that the variability in both these bands is driven by the X-rays. The resulting cross correlations functions are given in Figure 12 for three values of the black hole mass and . As expected, since either light curve tracks very closely that of the X-rays, their cross correlation peaks at time scales associated with the X-ray variability. The observed lags are therefore too long to be accounted by the geometric arrangement. (b) In the spirit of the Rokaki & Magnan (1992) treatement (and at the referee’s suggestion) we have assumed that the UV - optical variability is driven by an unseen spectral component other than the X-rays (EUV ?), with a light curve identical to that of the observed UV emission. We then computed the resulting light curves at 1315 Å and 6962 Å and their cross correlation functions which are shown in Figure 13, for the same values of the black hole mass as before, namely and for . The smoother variations of the UV band lead to a broader CCF, which for leads to a lag of about 1 day, consistent with those given in Collier et al. (1998). However, in this specific value of , the UV light curve at 1315 Å is visibly smoother than the observed light curve at the same wavelength. For the smaller values of the incident and reprocessed UV light curves are in fact almost identical but in this case the correponding lags are a lot smaller, as seen in Figure 13. Perhaps, one should have used as an incident light curve one with substantially more power in the high frequencies than the observed UV light curve, as done in Rokaki & Magnan (1992). However, in the absence of such data one can only speculate.


4 Discussion, Conclusions
In the sections above we explored the observational effects of X-ray reprocessing by a geometrically thin, optically thick accretion disk in AGN. We assumed in doing this that a point-like X-ray source irradiates the accretion disk (approximated by an infinite plane) from a given distance above it; the disk then re emits the locally incident X-ray flux in black body form, much in the way considered for producing the BBB spectrum. Our goal has been to compare our results to the observations of the recent mulitwavelength campaign of NGC 7469, which sampled its optical, UV and X-ray light curves at a rate sufficiently high to allow meaningful measurements of the lags between these components. We searched the relevant parameter space to examine whether it is possible to account for the observed correlated variability in the optical – UV bands as the result of reprocessing of the observed X-rays by an accretion disk. This is a relevant question, as this process was suggested to be the origin of the optical – UV lags in previous, less well sampled (in time and wavelength) campaigns.
Our “bottom line” results are summarized by Figure 12 which exhibits the relative lags of our model light curves between the UV (1315 Å) and the optical (6962 Å) bands, in order to compare directly with the same quantity as determined by the NGC 7469 campaign (see figure 5 in Collier et al. 1998): The model lags are much too short to account for the observations under the assumptions of our model (i.e. that they are due to X-ray reprocessing), for any reasonable value of the black hole mass or the angle . The model lags are shorter than those observed by, at least, a factor five, for any reasonable value of the black hole mass (or, equivalently, height of the X-ray source above the disk). However, the lags reported by Collier et al. (1998) could be accounted within the model, provided that the variability is due to the reprocessing of a continuum component other than the X-rays, with a light curve similar to that observed in the UV.
This outcome, as indicated also by the detailed X-ray reprocessing model light curves, is the result of the short distances associated with black hole - accretion disk systems of these models. For reasonable values of the black hole mass, , the 1315 Å light curves track almost identically that of X-rays. Even for the optical wavelength, 6962 Å, the reprocessed light curves follow quite closely those of the X-rays as seen in the relevant figures and as shown by the autocorrelation functions. We have also produced model light curves for two additional wavelengths, namely 15000 Å and 30000 Å, both well outside the range of observations, in order to explore at what wavelengths our model could yield light curves with autocorrelation functions similar to those observed in the UV. It was only for the longest wavelength (30000 Å) and for that we were able to produce autocorrelation functions resembling that associated with the light curve of NGC 7469 at 1315 Å. However, in this last case the reprocessed emission comes from such large radii that the resulting RMS variability is much smaller than that the UV observations indicate.
In view of our model light curves of Figures 4, 5, 6 and also as discussed in Nandra et al. (1998), the correlated X-ray – UV variability of NGC 7469 appears really puzzling. One might argue that the variability in the UV – optical bands is intrinsic to that of the accretion disk itself; as argued in Collier et al. (1998) the wavelength dependence of the UV – optical lags are consistent with this view. However this would present the following two problems: (a) the observed lag time scales are too short for the standard accretion disk models (as discussed in the introduction); (b) given the roughly equal luminosities in the X-ray and UV bands, there should exist some evidence of a high frequency component in the UV light curve due to the (expected) reprocessing of the observed X-rays, should the geometry assumed in the present note be valid. Perhaps this last constraint could be alleviated if the albedo of the disk were high, i.e. , as this could make the amplitude of the reprocessed component very hard to discern. It has been suggested recently that this may very well be the case under certain conditions in X-ray illuminated disks (Nayakshin, Kazanas & Kallman 1999). In this case however, the presence of such a reflected component with amplitude similar to that of the intrinsic X-ray flux should be apparent in the X-ray autocorrelation function at lags , where is the height of the X-ray source above the disk. Allowing for additional speculation to remove this last conundrum, one could argue that the X-ray emission comes from magnetic loops (Galeev, Rosner, Vaiana 1979) of sizes smaller than the X-ray sampling time multiplied by the speed of light (i.e. cm). Such a solution appears contrived and it still does not explain the origin of the UV – optical lags.
In conclusion, the observations of the correlated multiwavelength variability of NGC 7469 seems to be grossly incompatible with the simplified model examined herein, namely that this variability is due to reprocessing of the observed X-rays by an optically thick, geometrically thin disk, with the X-ray source approximated by a point source at a given distance above this disk. It is not apparent to us how simple modifications to this model could lead to results compatible with these observations. The connection between the X-ray and the longer wavelength (BBB) components appears to be much less direct than allowed through this very simplified model, which suggests much more rapid variability, yet these two spectral components should be somehow related, given their similar overall variability amplitudes.
It is not known whether the correlations of the multiwavelength variations observed in NGC 7469 are a general AGN property or particular to this specific object. These intriguing results suggest that additional studies with similar wavelength coverage and sampling rates are badly needed in order to establish whether our present, general notions of AGN structure are indeed sound or in need of a major revision. Our models and their comparison to observations should be viewed only as a case in support of the argument made in the introduction, namely that spectral fits alone are unable to provide unequivocal information concerning the structure of AGN and generally of sources powered by accretion onto compact objects. Time variability observations and successful modeling are an absolutely necessary supplement to the spectral studies.
We would like to thank P. Nandra for providing us with the X-ray light curve of NGC 7469. We would also like to thank Sergei Nayakshin, Hagai Netzer and Brad Peterson for several interesting discussions.
References
- (1)
- (2) Collier, S. J. et al. 1998, ApJ, 500, 162
- (3)
- (4) Edelson, R. A. & Malkan, M. A. 1987, ApJ, 323, 516
- (5)
- (6) Galeev, A. A., Rosner, R., & Vaiana, G. S., 1979, ApJ, 229, 318
- (7) Kazanas, D., Hua, X.-M. & Titarchuk, L. G. 1997, ApJ, 480, 735
- (8)
- (9) Koratkar, A. & Blaes, O. 1999, PASP, 111, 1
- (10)
- (11) Malkan, M. A. & Sargent, W. L. W. 1982, ApJ, 254, 68
- (12)
- (13) Malkan, M. A. 1983, ApJ, 286, 582
- (14)
- (15) Laor, A. & Netzer, H. 1989, MNRAS, 238, 897
- (16)
- (17) Krolik, J. H., Horne, K., Kallman, T. R., Malkan, M. A., Edelson, R. A., & Kriss, G. A. 1991, ApJ, 371, 541
- (18) Nandra, K., et al. 1998, ApJ, 505, 594
- (19) Narayan, R. & Yi, I. 1994, ApJ, 428, L13
- (20)
- (21) Nayakshin, S., Kazanas, D. & Kallman, T. R. 1999, submitted to ApJ (astro-ph/9909359 )
- (22)
- (23) Netzer, H. & Peterson, B. M., 1997, in Astronomical Time Series, ed. D. Maoz, A. Sternberg & Leibowitz, E. M., Dordrecht: Kluwer, 85 (also astro-ph/9706039)
- (24)
- (25) Rokaki, E. & Magnan. C. 1992, A & A, 261, 41
- (26)
- (27) Shields, G. 1978, Nature, 272, 706
- (28)
- (29) Sun, W. H. & Malkan, M. A., 1989, ApJ, 346, 68
- (30)
- (31) Wanders, I., et al. 1997, ApJS, 113, 69
- (32)