The stellar populations of early-type galaxies in the Fornax cluster
Abstract
We have measured central line strengths for a magnitude-limited sample of early-type galaxies in the Fornax cluster, comprising 11 elliptical (E) and 11 lenticular (S0) galaxies, more luminous than . When compared with single-burst stellar population models we find that the centres of Fornax ellipticals follow a locus of fixed age and have metallicities varying roughly from half solar to two times solar. The centres of (lower luminosity) lenticular galaxies, however, exhibit a substantial spread to younger luminosity-weighted ages indicating a more extended star formation history.
Galaxies with old stellar populations show tight scaling relations between metal-line indices and the central velocity dispersion. Remarkably also the Fe-lines are well correlated with . Our detailed analysis of the stellar populations suggests that these scaling relations are driven mostly by metallicity. Galaxies with a young stellar component do generally deviate from the main relation. In particular the lower luminosity S0s show a large spread.
Our conclusions are based on several age/metallicity diagnostic diagrams in the Lick/IDS system comprising established indices such as Mg2 and H as well as new and more sensitive indices such as H and Fe3, a combination of three prominent Fe-lines. The inferred difference in the age distribution between lenticular and elliptical galaxies is a robust conclusion as the models generate consistent relative ages using different age and metallicity indicators, even though the absolute ages remain uncertain. The absolute age uncertainty is mainly caused by the effects of non-solar abundance ratios which are not yet accounted for by the stellar population models.
Furthermore we find that elliptical galaxies and the bulge of one bright S0 are overabundant in magnesium, where the most luminous galaxies show the strongest overabundances. The stellar populations of young and faint S0s are consistent with solar abundance ratios or a weak Mg underabundance. Two of the faintest lenticular galaxies in our sample have blue continua and extremely strong Balmer-line absorption suggesting star formation Gyrs ago.
keywords:
galaxies: abundances - galaxies: clusters: individual: Fornax - galaxies: formation - galaxies: elliptical and lenticular - galaxies: kinematics and dynamics1 INTRODUCTION
Great efforts have been made in the last few years to develop evolutionary stellar population synthesis models [Bruzual & Charlot 1993, Worthey 1994, Weiss, Peletier & Matteucci 1995, Vazdekis et al. 1996, Kodama & Arimoto 1997] in order to analyze the integrated light of galaxies and derive estimates of their mean ages and metal abundances. One of the main obstacles in the interpretation has been the age/metallicity degeneracy in old stellar populations. As pointed out by Worthey (1994) the integrated spectral energy distribution (SED) of an old ( Gyrs) stellar population looks almost identical when the age is doubled and total metallicity reduced by a factor of three at the same time. Therefore two galaxies with almost identical broad-band colours can have significantly different ages and metallicities. In the optical wavelength range, only a few narrow band absorption line-strength indices and the 4000 Å break (see also Gorgas et al. 1999) have so far been identified which can break this degeneracy.
One of the most successful and widely used methods for measuring the strength of age/metallicity discriminating absorption features is the Lick/IDS system [Burstein et al. 1984, Worthey et al. 1994, Trager et al. 1998] which has been used by many authors [González 1993, Davies, Sadler & Peletier 1993, Fisher, Franx & Illingworth 1995, Fisher, Franx & Illingworth 1996, Ziegler & Bender 1997, Longhetti et al. 1998, Mehlert 1998, Jørgensen 1999]. In contrast with high resolution index systems [Rose 1994, Jones & Worthey 1995], which promise a better separation of age and metalllitiy, the Lick/IDS system allows the investigation of dynamically hot galaxies that have intrinsically broad absorption lines. By plotting an age sensitive index and a metallicity sensitive index against each other, one can (partially) break the age/metallicity degeneracy and estimate, with the help of model predictions, the luminosity weighted age and metallicity of an integrated stellar population (see Figure 4). Most recently, Jørgensen (1999) used this methodology to investigate the stellar populations of a large sample of early-type galaxies in the Coma cluster. She concluded that there are real variations in both the ages and the abundances while an anti-correlation between the mean ages and the mean abundances makes it possible to maintain a low scatter in scaling relations such as Mg–. Colless et al. (1999) present similar conclusions from the analysis of a combination of the Mg– relation and the Fundamental Plane in a large sample of cluster early-type galaxies.
The spread in the ages for early-type galaxies and the anti-correlation of age and metallicity found by the previous authors supports the hierarchical picture for the construction of galaxies in which galaxies form via several mergers involving star-formation [Baugh et al. 1996, Kauffmann 1996]. However, the results are inconsistent with the conventional view that all luminous elliptical galaxies are old and coeval. In this picture the global spectrophotometric relations observed for ellipticals, for example the colour-magnitude relation [Visvanathan & Sandage 1977, Bower, Lucey & Ellis 1992, Terlevich 1998] are explained by the steady increase in the abundance of heavy elements with increasing galaxy mass. This increase arises naturally in galactic wind models such as that of Arimoto & Yoshii (1987) and Kodama & Arimoto (1997).
Although with line-strength indices we can (partially) break the age/metallicity degeneracy this is by no means the last obstacle to overcome on our way to fully understand the stellar populations of early-type galaxies and the cause of scaling ralations. Since the late 70’s evidence has been accumulating that abundance ratios in galaxies are often non-solar. In particular the Magnesium to Iron ratio seems to be larger in luminous early-type galaxies when compared to solar neighbourhood stars [O’Connell 1976, Peletier 1989, Worthey, Faber & González 1992, Davies, Sadler & Peletier 1993, Henry & Worthey 1999, Jørgensen 1999]. However, with only a very few exceptions (e.g., Weiss, Peletier & Matteucci 1995), non-solar abundance ratios have not yet been incorporated in the model predictions. Among other issues this seems to be the most important single problem which prevents us from deriving accurate absolute age and metallicity estimates from integrated light spectroscopy [Worthey 1998]. Nevertheless with the current models and high S/N data we are able to study relative trends in ages and abundances as well as start to investigate the effects of non-solar abundance ratios for individual elements [Worthey 1998, Peletier 2000].
In this paper, high S/N nuclear spectra of a complete sample of early-type galaxies in the Fornax cluster brighter than are analyzed in the Lick/IDS system. The early results of this study have already been presented in a letter to this journal [Kuntschner & Davies 1998]. This paper is organized as follows. Section 2 describes the sample selection and basic data reduction. The calibration of the line-strength indices to the Lick/IDS system is presented in Section 3 and the Appendix. Section 4 presents a consistency test for the model predictions and our measured line-strength indices. In Section 5 several index combinations are compared to model predictions. In particular the effects of non-solar abundance ratios, composite stellar populations and age/metallicity estimates of the integrated light are discussed. In Section 6 observed index– relations are presented. Relations between derived parameters such as age, metallicity and [Mg/Fe] with the central velocity dispersion are investigated in Section 7. We then discuss the implications of our results in Section 8 and present the conclusions in Section 9. The fully corrected Lick/IDS indices of our sample are tabulated in the Appendix.
2 THE OBSERVATIONS AND DATA REDUCTION
2.1 The sample
Our sample of 22 early-type galaxies has been selected from the catalogue of Fornax galaxies (Ferguson 1989, hereafter F89), in order to obtain a complete sample down to or 111Adopting a distance modulus of ; based on I-band surface brightness fluctuations [Jensen, Tonry & Luppino 1998]. This corresponds to H km s-1 Mpc-1 for a flat Universe. We have adopted the morphological classifications given by F89 and checked them with images we obtained on the Siding Spring 40 telescope. From these we noted a central dust lane in ESO359-G02 and a central disc in ESO358-G59 which led us to classify them as lenticular galaxies. NGC 1428 was not observed because of a bright star close to its centre. We also added the elliptical galaxy IC2006 to our sample, as it was not classified by F89. The bona-fide elliptical NGC3379 was observed as a calibration galaxy. The observations were carried out with the AAT (3.9m) on the nights of 1996 December 6-8 using the RGO spectrograph. The characteristics of the detector and the instrument set-up is given in Table 1.
| Telescope | AAT (3.9m) |
|---|---|
| Dates | 6-8 December 1996 |
| Instrument | RGO spectrograph |
| Spectral range | 4243 - 5828 Å |
| Grating | 600 V |
| Dispersion | 1.55 Åpixel-1 |
| Resolution (FWHM) | Å |
| Spatial Scale | 077 pixel-1 |
| Slit Width | 23 |
| Detector | Tek1k #2 (24 m2 pixels) |
| Gain | |
| Read-out-noise | rms |
| Seeing | 1″ |
Typically, exposure times were between 300 and 1800 sec per galaxy (see Table 2 for a detailed listing). For most of the observations the slit was centred on the nucleus at . The seeing was generally better than one arcsec. Additionally we observed 15 different standard stars (mainly K-giants) during twilight to act as templates for velocity dispersion measurements as well as to calibrate our line-strength indices to the Lick/IDS system [Worthey et al. 1994]. The spectrophotometric standard stars GD 108 and L745-46A were observed to enable us to correct the continuum shape of our spectra. Table 3 lists all observed standard stars with their spectral types (obtained from SIMBAD, operated by CDS, Strasbourg) and also comments on their use as Lick/IDS standard, velocity standard or spectrophotometric standard.
| Galaxy | Type | BT | Exp. time | PA |
|---|---|---|---|---|
| [mag] | [sec] | [°] | ||
| NGC 1316 | S0 pec | 9.4 | 300 | 90 |
| NGC 1336 | E4 | 13.1 | 1200 | 90 |
| NGC 1339 | E4 | 12.5 | 600 | 90 |
| NGC 1351 | E5 | 12.5 | 900 | 90 |
| NGC 1373 | E3 | 14.1 | 1200 | 90 |
| NGC 1374 | E0 | 12.0 | 900 | 90 |
| NGC 1375 | S0 | 13.2 | 900 | 90 |
| NGC 1379 | E0 | 11.8 | 600 | 90 |
| 600 | 90 | |||
| NGC 1380 | S0 | 10.9 | 300 | 90 |
| NGC 1380A | S0 | 13.3 | 900 | 90 |
| NGC 1381 | S0 | 12.4 | 480 | 90 |
| 900 | 140 | |||
| 900 | 50 | |||
| NGC 1381a | S0 | 1800 | 50 | |
| NGC 1399 | E0, cD | 10.6 | 300 | 90 |
| 600 | 181 | |||
| NGC 1404 | E2 | 11.0 | 300 | 90 |
| 300 | 90 | |||
| NGC 1419 | E0 | 13.5 | 1200 | 90 |
| NGC 1427 | E4 | 11.8 | 600 | 90 |
| 1800 | 79 | |||
| 1800 | 169 | |||
| IC 1963 | S0 | 12.9 | 600 | 90 |
| IC 2006 | E | 12.2 | 600 | 90 |
| ESO 359-G02 | S0 | 14.2 | 1200 | 90 |
| ESO 358-G06 | S0 | 13.9 | 1800 | 90 |
| ESO 358-G25 | S0 pec | 13.8 | 1200 | 90 |
| ESO 358-G50 | S0 | 13.9 | 1200 | 90 |
| ESO 358-G59 | S0 | 14.0 | 1200 | 90 |
| NGC 3379b | E1 | 10.2 | 300 | 90 |
Notes – aoffset from nucleus; bcalibration galaxy, non Fornax member
| Name | Type | comment |
|---|---|---|
| HD004656 | K4IIIb | Lick/IDS std |
| HD037160 | K0IIIb | Lick/IDS std |
| HD040657 | K1.5III | velocity std |
| HD047205 | K1III | Lick/IDS std |
| HD050778 | K4III | Lick/IDS std |
| HD054810 | K0III | Lick/IDS std |
| HD058972 | K3III | Lick/IDS std |
| HD061935 | G9III | Lick/IDS std |
| HD066141 | K2III | Lick/IDS std |
| HD071597 | K2III | velocity std |
| HD083618 | K2.5III | Lick/IDS std |
| HD088284 | K0III | Lick/IDS std |
| HD095272 | K1III | Lick/IDS std |
| HD219449 | K0III | Lick/IDS std |
| HD221148 | K3III variable | Lick/IDS std |
| L745-46A | DF | spec. std [Oke 1974] |
| GD 108 | sd:B | spec. std [Oke 1990] |
2.2 Basic data reduction
Most of the basic data reduction steps have been performed with packages under IRAF. For each night individually the science frames were overscan corrected and a bias frame was subtracted. A few bad columns were removed by linear interpolation. From several domeflats and skyflats a final flatfield accounting for the pixel-to-pixel variations and vignetting was constructed and applied to the frames. Cosmic rays were removed using the cleanest task in the REDUCEME package [Cardiel et al. 1998]. This task automatically detects and removes cosmic rays via a sophisticated deviation algorithm, while at the same time one can interactively inspect potential cosmic rays in sensitive areas such as close to the galaxy centre. The wavelength solution was determined from Th-Ar-lamp spectra which were taken before and after most of the science observations. The rms residual in the wavelength fit was typically 0.1 - 0.2 Å. Finally the sky was subtracted.
The central spectrum for each galaxy was extracted by fitting a low order polynomial to the position of the centre along the wavelength direction, re-sampling the data in the spatial direction and finally co-adding the spectra within a 5 pixels aperture yielding an effective aperture of 23385. Multiple exposures of the same galaxy were combined. The resulting S/N in the spectra ranges from [Å-1] for the faintest galaxies to more than 100 [Å-1] for the brightest ones (measured in a 100 Å wide region just bluewards of the Mg b feature). For stars we used the IRAF task apall to extract 1d-spectra. All galaxy and stellar spectra were logarithmically rebinned to a common wavelength range and increment. Finally the continuum shape of our spectra was corrected to a relative flux scale with the help of the spectrophotometric standard stars.
2.3 Kinematics
In order to correct the line-strength indices for velocity dispersion broadening and to construct index– relations we need to measure the central velocity dispersion for each galaxy. Estimates were derived with the Fourier correlation quotient (FCQ, version 8) method [Bender 1990, Bender, Saglia & Gerhard 1994]. For the FCQ analysis the spectra were rebinned to twice the original spectral sampling and a wavelength range of 4876 to 5653 Å was extracted. Note that the feature is excluded from the wavelength range as it proved to be a source of severe template mismatch for galaxies with strong Balmer absorption. As we only consider central spectra in this paper we fit a pure Gaussian profile to the broadening function, neglecting higher order terms. To check the reliability of the FCQ analysis we used eight different G & K-giant template stars. For galaxies with a central velocity dispersion of km s-1, all eight template stars give very similar results and an average value was adopted. The rms scatter between different template stars is 0.007 in log units for galaxies with km s-1. For galaxies with km s-1 the rms scatter increases to 0.024 and for galaxies with km s-1 we find an rms scatter of 0.074. The uncertainty introduced by different template stars was comparable or larger than the internal error estimates of the FCQ program. Note, that for galaxies with km s-1 some template stars gave a poor fit to the broadening function and were excluded from the template sample. Only remaining measurements were averaged.
Using this procedure, velocity dispersions as low as km s-1 could be recovered, although systematic errors will start to dominate for km s-1. As our spectral resolution is rather low compared to velocity dispersions of km s-1 we emphasize that for these faint galaxies our velocity dispersions are only rough estimates. The final velocity dispersion errors for galaxies with km s-1 () were derived by a literature comparison (see Appendix, Figure 13). For galaxies with km s-1 we adopt the mean rms scatter of the template stars ().
3 LICK/IDS CALIBRATION
The wavelength range of our spectra covers 16 different line-strength indices, such as Mg2, and , in the Lick/IDS system which is described in detail in Worthey (1994, hereafter W94), Worthey & Ottaviani (1997, hereafter WO97) and Trager et al. (1998). In the following analysis we use an updated version of the W94 models which is available from Dr. G. Worthey’s home page. The updates affect only models where and are most noticable for the index. For a recent study of the behaviour of the Balmer indices at low metallicities see Poggianti & Barbaro (1997) and Maraston, Greggio & Thomas (1999). Before one can compare the measured indices with model predictions by e.g., W94 and Vazdekis et al. (1996, hereafter V96), the measurements have to be carefully calibrated to the Lick/IDS system. Generally there are three effects to account for: (a) the difference in the spectral resolution between the Lick/IDS system and our set-up, (b) the internal velocity broadening of the observed galaxies and (c) small systematic offsets caused by e.g., continuum shape differences.
(a) In order to account for diffrences in spectral resolution we broadened the spectra with a Gaussian of wavelength dependent width, such that the Lick/IDS resolution was best matched at each wavelength (see Figure 7 in WO97). After this step our spectra should resemble very well the general properties of the original spectra obtained by the Lick group.
(b) In a second step we need to correct the indices for velocity dispersion broadening. The observed spectrum of a galaxy is the convolution of the integrated spectrum of its stellar population(s) by the instrumental broadening and the distribution of line-of-sight velocities of the stars. These effects broaden the spectral features, in general reducing the observed line-strength compared to the intrinsic values. In order to compare the raw index measurements for galaxies with model predictions we calibrate the indices to zero velocity dispersion. Spectra of 15 different G9-K4 giant stars were first broadened to the Lick/IDS resolution and then further broadened using a Gaussian to km s-1 in steps of 20 km s-1. The indices are then measured for each star and -bin and a correction factor, , such that Index(0)/Index() is determined.
Figure 15 in the Appendix shows the dependence of the correction factor on for all 16 indices. Note that for the molecular indices Mg1 and Mg2 and the index 222This index is actually not a molecular index but typical index values are close to zero hence a correction factor can degenerate. the correction factor is defined as Index(0) – Index(). The scatter in at 360 km s-1 was for all indices but .
It is worth looking in detail why the velocity dispersion correction seems to be so insecure. The derived correction factors are only useful if the stars used for the simulations resemble the galaxy spectra. In principle one might expect a dependence of the correction factor on line-strength – but most indices do not show such a behaviour. In fact is the only index where we find a significant influence of line-strength on the correction factor at a given . It turns out that stars which exhibit -absorption Å lead to correction factors of and stars with -absorption Å imply positive corrections. In the Fornax sample there are no galaxies with absorption line-strength of less than 1.4 Å, hence only stars with a index greater 1.1 Å have been used to evaluate the correction factor (scatter ).
Another way to check the accuracy of the velocity dispersion corrections is to use galaxy spectra with small internal velocity dispersions as templates and treat them in the same way as stars. The galaxies NGC1373, NGC1380A, NGC1336, IC1963 and ESO358-G59 were used for this purpose. They span a range in absorption of Å and a range in central velocity dispersion of km s-1. In Figure 15 the galaxies are represented by open circles and they agree very well with the stellar correction for most of the indices. As expected for , the galaxies match the results from stars with a absorption Å.
The final correction factors are derived by taking the mean of 15 stars and the five galaxies in each -bin (solid line in Figure 15). The velocity dispersion corrections are applied by a FORTRAN program which reads in the raw index-measurements from continuum corrected and resolution corrected galaxy spectra. For each galaxy and index it applies a correction for velocity dispersion. The program linearly interpolates between -bins and also adds the error from the velocity-dispersion correction factor to the raw Poisson error of the spectra. As the error in the correction factor is much bigger than any error caused by uncertainties in , we assumed the velocity dispersion of the galaxies to be error free.
(c) Although we have matched very well the spectral resolution of the Lick system, small systematic offsets of the indices introduced by continuum shape differences are generally present (note that the original Lick/IDS spectra are not flux calibrated). To establish these offsets we compared our measurements for stars in common with the Lick/IDS stellar library. In total we observed 13 different Lick/IDS stars. Figure 14 in the Appendix shows the difference between Lick/IDS measurements and ours after the mean offset has been removed. The mean offsets and associated errors for each index are summarized in Table 4. The star HD221148 was excluded from the offset analysis because our index measurements proved to be very different from the original Lick/IDS measurements – possibly due to its variable nature (see Table 3). The formal error in the offset is evaluated by the mean standard deviation of stars with respect to the mean offset divided by .
| Index | offset (Lick/IDS - AAT) |
|---|---|
| G4300 | Å |
| Fe4383 | Å |
| Ca4455 | Å |
| Fe4531 | Å |
| C24668 | Å |
| H | Å |
| Fe5015 | Å |
| Mg1 | mag |
| Mg2 | mag |
| Mg b | Å |
| Fe5270 | Å |
| Fe5335 | Å |
| Fe5406 | Å |
| Fe5709 | Å |
| Å | |
| Å |
Most off the indices show small offsets to the Lick/IDS system, similar to the ones quoted in (WO97, Table 9). The rather large offset in Mg2 is due to a well known difference in continuum shape.
Recently Trager et al. (1998) published the Lick/IDS library of extragalactic objects including 7 galaxies in the Fornax cluster and NGC3379. We can check our previous offset evaluation by comparing our galaxy measurements with Trager et al. For this purpose we extracted a 3 pixels central aperture (23244) for our galaxies matching the Lick/IDS standard aperture of 144″. Our indices are then corrected for velocity dispersion as described in paragraph (b) and the offsets from Table 4 are applied. The results are overplotted in Figure 14 in the Appendix (filled symbols). The galaxies show for all indices more scatter around the mean offset than the stars which is somewhat reflected in the bigger error bars, but there are also some outliers. This is not surprising as seeing effects and aperture differences will introduce some non-reproduceable offsets for individual galaxies. Furthermore we note that the Lick group had to observe the Fornax galaxies at a very high airmass. With the possible exception of the indices G4300 and Fe4383 the offset inferred from the galaxy comparison are consistent with the stellar comparison.
The offsets listed in Table 4 were applied to all indices after the correction for velocity dispersion. Note that the Lick/IDS-system offset-error is a constant value and does not depend on the velocity dispersion of the galaxy itself. Therefore we did not include this error in the individual index errors but rather quote for each index a common offset error (see also Table 4). The final corrected central (2385) index measurements and associated errors for the Fornax galaxies and NGC3379 are presented in Table D2 in the Appendix. For each galaxy we give the index measurement in the first row and the 1 error in the second row.
Note that for the galaxies NGC1381 and NGC1427 we combined three exposures yielding a very high S/N spectrum. Here our index-error estimation taking into account only the Poisson error becomes invalid because of other error sources such as the wavelength calibration, continuum correction and aperture effects. By comparing individual exposures we established that 1.5 the original Poisson error estimate is a good indicator of the true error. This adjusted error was adopted in Table D2 and for any further analysis.
4 A consistency test of the model predictions
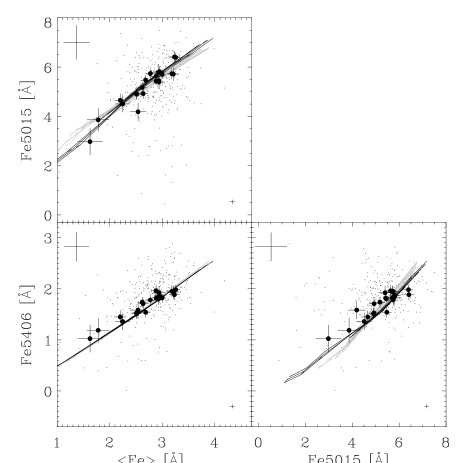
For the following analysis of the nuclear stellar populations (Section 5) it is extremely important that our index measurements are accurately calibrated onto the Lick/IDS system which is based on the Lick/IDS stellar library [Worthey et al. 1994]. Here we investigate the accuracy and consistency of our calibration and the model predictions by presenting index–index plots which are almost degenerate in age and metallicity. In that way the model predictions cover only a small “band” of the parameter space and they should trace the relation of the galaxies if the models describe accurately the galaxy properties and our calibration is accurate. Figure 1 shows the relation between Fe333Fe=(Fe5270+Fe5335)/2, Fe5015 and Fe5406 for our sample of galaxies (filled circles) and the original Lick/IDS sample of galaxies (Trager et al. 1998, small dots). Overplotted are models by W94 (black lines) and V96 (grey lines). The plots show a good agreement between index measurements and the model predictions. The reduced Poisson noise of our data set compared to the Lick/IDS measurements can be clearly seen (see also Figure caption). We note that the model predictions of Vazdekis and Worthey are in good agreement.
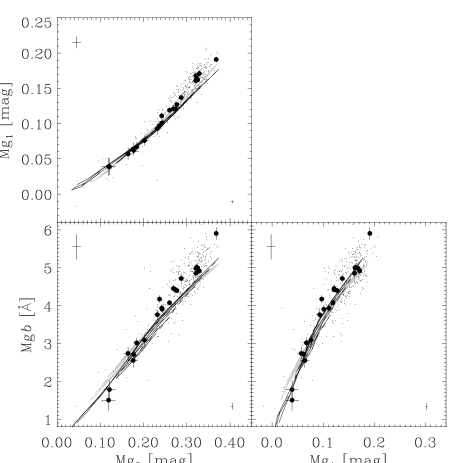
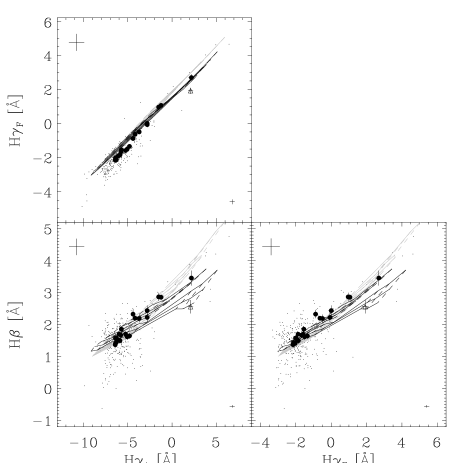
A similar analysis of the three Mg indices is shown in Figure 2. Here we find a significant deviation of the measured index values compared to the model predictions for metal rich and/or old stellar populations. The deviations are seen in the Fornax sample as well as in the original Lick/IDS galaxy spectra (see also Worthey 1992, Figure 5.12 & 5.13). We therefore note that this discrepancy is inherent to the Lick/IDS system & models and any models which use the Lick/IDS fitting functions are likely to show the same offset. In Figure 3 we present the Balmer indices , and . Here we find generally good agreement with small deviations between model predictions and data at low values of vs which is present in our data and the original Lick/IDS measurements.
Figures 1 to 3 suggest that our Lick/IDS calibration is very consistent with the original galaxy measurements of the Lick group. However, we note that small, systematic offsets exist between the parameter space covered by galaxies and the model predictions for Magnesium at high index values and for Balmer lines at low index values.
5 THE NUCLEAR STELLAR POPULATIONS
The aim of this section is to derive estimates of the mean (luminosity weighted) ages and metal abundances of early-type galaxies in the Fornax cluster. As pointed out by W94, the determination of the ages and metallicities of old stellar populations is complicated by the similar effects that age and metallicity have on the integrated spectral energy distributions. However, this degeneracy can be partially broken by plotting a particular age sensitive index, such as one of the Balmer line indices, against a more metallicity sensitive index. The usefulness of this approach has been demonstrated by many authors [González 1993, Fisher, Franx & Illingworth 1995, Mehlert 1998, Kuntschner & Davies 1998, Jørgensen 1999]. However, as we will see in this Section, among other issues the treatment of non-solar abundance ratios is a crucial parameter in the determination of absolute age and metallicity estimates. We will also investigate the effects of nebular emission and composite stellar populations on age/metallicity estimates in Sections 5.2 & 5.3 respectively, before we present our best age/metallicity estimates of the Fornax early-type galaxies in Section 5.4.
5.1 Non-solar abundance ratios
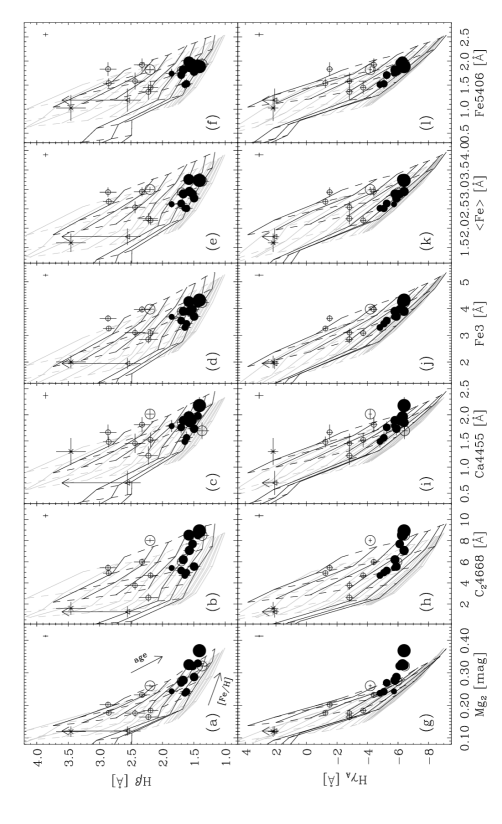
In Figure 4 we present age/metallicity diagnostic diagrams of six metallicity sensitive indices (Mg2, C24668, Ca4455, Fe3, Fe & Fe5406) plotted against the age sensitive Balmer line indices and (the new index Fe3 is defined in Equation 1). Figure 4h is a reproduction from Kuntschner & Davies (1998) with minor data up-dates. Overplotted are model predictions from W94, WO97 (black lines) and V96 (grey lines). Solid lines represent lines of constant age and the dashed lines are lines of constant metallicity. The Worthey models span a range in age of 1.5–5 Gyr with [Fe/H]=-0.225 to 0.5 and 8–17 Gyr with [Fe/H]=-2 to 0.5. The V96 models span a range in age of 1–17.4 Gyr with [Fe/H]=-0.7 to 0.4. The direction of increasing age and metallicity is indicated in Figure 4a by arrows.
Our previous result from Kuntschner & Davies (1998), that Fornax ellipticals form a sequence in metallicity at old ages and that the S0s spread to younger ages is confirmed in all diagrams. Examining the diagrams in detail one can see that the mean age and metallicity of the sample changes from diagram to diagram; e.g., the ellipticals appear older and more metal poor in the Fe vs diagrams compared to the Mg2 vs diagram. This effect was previously reported and recently reviewed by Worthey (1998). It is now widely accepted that this discrepancy in the model predictions is caused by non-solar abundance ratio effects. For example Mg as measured by the Mg2 index is overabundant compared to Fe in luminous elliptical galaxies, i.e., [O’Connell 1976, Peletier 1989, Worthey, Faber & González 1992, Davies, Sadler & Peletier 1993, Weiss, Peletier & Matteucci 1995, Jørgensen 1997, Jørgensen 1999].
The Mg overabundance can be examined in a Mg-index vs Fe-index plot [Worthey, Faber & González 1992]. In such a diagram the model predictions cover only a narrow band in the parameter space as effects of age and metallicity are degenerate. Figure 5 shows plots of Fe & Fe5270 vs Mg2 for the Fornax sample. Overplotted are model predictions from W94, V96 and Weiss et al. (1995). We assume that the models reflect solar abundance ratios if not stated otherwise, i.e., . If the model predictions accurately resemble the galaxy properties they should trace the observed relation. The measured line-strength of most of the S0s agrees with the model predictions, perhaps 3–4 galaxies having slightly low Mg2 absorption compared to Fe5270 & Fe. However, for most of the ellipticals and the S0 NGC1380, the models predict too little Mg-absorption at a given Fe-absorption strength. Additionally the most metal rich galaxies are the furthest away from the model grids. Using the Mg-overabundance correction by Greggio (1997, see Figure 5a) and the models for [Mg/Fe]=0.45 by Weiss et al. (1995), we conclude that the stellar populations of Fornax ellipticals and the bulge of NGC1380 are Mg-overabundant relative compared to Fe. The overabundance ranges between [Mg/Fe]=0.0 to 0.4. We note that there exists considerable spread in overabundance at a given Fe-line strength in our sample.

Non-solar abundance ratios do exist not only in elliptical galaxies but also in our own galaxy where stars show an overabundance for -elements444 includes the elements O, Mg, Si, S, Ca, and Ti at [Fe/H]0.0 [Edvardsson et al. 1993, McWilliam 1997]. Of course if those stars are incorporated in a stellar library which in turn is used for model predictions of integrated stellar populations, the predictions will be somewhat -element overabundant at low metallicities. We therefore note that models which use the Lick/IDS fitting functions are probably -element overabundant at low metallicities which makes it more difficult to interpret trends in diagrams such as Figure 5.
Several indices covered by our wavelength range show deviations from the model predictions when compared to the average Fe index: Mg1, Mg2, Mg b, Fe5709 & C24668. Fe5709 is a very weak index and its correction for velocity dispersion broadening may well be insecure, so we cannot draw any firm conclusions. C24668 is an important index because it shows the strongest total metallicity sensitivity in the Lick/IDS system [Worthey 1998] and is therefore preferentially used in age/metallicity diagnostic diagrams. In Figure 6 we present a plot of C24668 vs Fe3. Fe3 is a combination of three prominent Fe lines, thus maximizing its sensitivity to Fe while minimizing the Poisson errors:
| (1) |
As a consequence of the extreme metallicity sensitivity of C24668, the models are not as degenerate as in the previous plots. Nevertheless it is clear that for a C24668 absorption strength in excess of 6 Å the model predictions do not follow the observed trend (see also Kuntschner 1998). Hence, we conclude that C24668, or better at least one of the species contributing to the index, is overabundant compared to Fe in metal rich Fornax galaxies. Can this overabundance be caused by Mg as seen in the Fe vs Mg plot (Figure 5)? Due to the proximity of metal absorption lines in the optical wavelength region non of the Lick/IDS indices measures the abundance of only a particular element such as Fe or Mg. There are always contributions from other elements or molecules to an index [Tripicco & Bell 1995]. In particular, the C24668 index has a relatively wide central bandpass (86.25 Å) including a wide range of metal lines. The most dominant species here is carbon in form of C2-bands which blanket the central bandpass [Tripicco & Bell 1995]. Yet, more important here is that according to Tripicco & Bell (1995; Table 6, cool giants) the C24668 index decreases when the Mg-abundance (or Oxygen-abundance) is increased (at fixed abundances of all other elements). Therefore the ’overabundance’ of C24668 cannot be caused by Mg. What exactly drives the overabundance of C24668 compared to Fe remains to be seen.

The overabundance of certain elements compared to Fe has a profound effect on the use of age/metallicity diagnostic diagrams if the model predictions reflect only solar abundance ratios. Recalling Figure 4f (see also Kuntschner & Davies 1998) we find that not only are the metallicities (measured as [Fe/H]) overestimated due to the C24668 overabundance but furthermore much of the age upturn at high metallicities is caused by the overabundance. The effect of changing the age estimates is caused by the residual age/metallicity degeneracy which is still present in all diagrams in Figure 4. Only if the index-combination breaks the degeneracy completely, i.e., if lines of constant age and constant metallicity are perpendicular, would the age estimates not be affected by non-solar abundance ratios. We further note that trends in abundance ratios within a dataset such as our Fornax sample (increasing Mg/Fe with galaxy mass) can lead to artificial relative age trends in diagrams such as in Figure 4f. Taking into account not only the uncertainties introduced by non-solar abundance ratios but also other model parameters such as which isochrone library to use, it seems very insecure to derive absolute age estimates from the currently available stellar population models.
Introducing non-solar abundance ratios in model predictions is rather complicated, as accurate model predictions do need a stellar library covering the whole parameter space of Te, log g, [Fe/H] and [Mg/Fe]. Furthermore, new isochrone calculations may well be needed for each [Mg/Fe] bin: recently Salaris & Weiss (1998) suggested that scaled-solar isochrones cannot be used to replace Mg-enhanced ones at the same total metallicity. The latter will not only change the model predictions for indices such as Mg2 but may affect all indices and in particular the age sensitive ones such as and (see also Worthey 1998). However, note that Weiss, Peletier & Matteucci (1995) concluded in their study that scaled solar isochrones are sufficient to calculate model predictions for non-solar abundance ratios.
Another way to examine non-solar abundance ratios is to compare the metallicity estimates derived from different metal lines using the same age indicator. Figure 7 compares the metallicity estimates taken from Mg2, C24668, Fe5406, Ca4455 vs diagrams with the estimates taken from a Fe3 vs diagram. Here Fe3 serves as our mean Fe-abundance indicator. The metallicity estimates are derived from the V96 models555These models have a bimodal IMF which is very similar to Salpeter for . Note that for an age of 17 Gyrs V96 models predict Å less -absorption compared to W94 models. This of course will affect the absolute age estimates but has little affect on the metallicity estimates.. To get more accurate estimates, the age/metallicity–grid was expanded to a step size of 0.025 in [Fe/H] by linear interpolation. Furthermore the diagram was extrapolated to [Fe/H]=+0.7 by linear extrapolation. The age range of 1 to 17.4 Gyrs is covered by 18 grid points. Errors on the metallicity estimates were derived by adding and subtracting the index error for each galaxy individually (Poisson error and Lick/IDS offset error added in quadrature) and re-deriving the metallicity estimates. The final uncertainty displayed in Figure 7 was taken to be 0.7 times the maximum change in [Fe/H].

In panel (a) of Figure 7 we can clearly see that for elliptical galaxies Mg2 gives metallicity estimates which are larger than those derived from Fe3 and there is a trend that the Mg-overabundance increases with increasing metallicity. Most of the S0s are consistent with solar or slightly less than solar abundance ratios of Mg/Fe. However, the (more luminous) S0s NGC1380 & NGC1381 show a weak overabundance of Mg. The index C24668 (panel b) gives on average high metallicity estimates compared to Fe3. Although three galaxies with just above solar metallicity show solar abundance ratios. As expected the Fe-index Fe5406 (panel c) is in good agreement with the estimates derived from Fe3. The Ca4455 index (panel d) gives marginally higher metallicity estimates compared to the Fe3 indicator. We note that the Ca4455 index is more sensitive to a mix of heavy elements than to Calcium on its own despite its name [Tripicco & Bell 1995].
In conclusion we can confirm our previous results that Mg and C24668 are overabundant compared to Fe. The Mg-overabundance follows a trend where metal rich (and luminous) Es show a stronger overabundance than less luminous and metal poor galaxies.
5.2 Nebular emission in early-type galaxies
So far we have concentrated on breaking the age/metallicity degeneracy and the treatment of non-solar abundance ratios. A further important issue when estimating ages and metallicities from line strength indices is nebular emission. Elliptical galaxies normally contain much less dust and ionized gas than spirals, in fact, for a long time they were regarded as dust and gas free. However, spectroscopic surveys of large samples of early-type galaxies revealed that about 50-60% of the galaxies show weak optical emission lines [Phillips et al. 1986, Caldwell 1984]. Typically the reported strength of emission lines such as [OII], [H] and [NII] indicates the presence of only of warm ionized gas in the centre. A more recent study of 56 bright elliptical galaxies by Goudfrooij et al. (1994) detected ionized gas in 57% of their sample and confirms the amount of ionized gas present. Additionally, HST images of nearby bright early-type galaxies revealed that approximately 70-80% show dust features in the nucleus [van Dokkum & Franx 1995]. Stellar absorption line-strength measurements can be severely affected if there is emission present in the galaxy which weakens the stellar absorption [Goudfrooij & Emsellem 1996]. For example, nebular -emission on top of the integrated stellar -absorption weakens the -index and leads therefore to wrong, i.e., too old age estimates.
The spectrum of ESO358-G25 shows clear emission in and H along with weak [O III] emission (see Kuntschner & Davies 1998, Figure 3). As a consequence, the age is overestimated in Figures 4 (a)–(f). The arrow attached to ESO358-G25 indicates a rough emission correction. However, it is extremely difficult to accurately correct the -index in individual galaxies for emission contamination. A much better method to reduce emission contamination is to use higher order Balmer lines such as as they are less affected by nebular emission [Osterbrock 1989]. Indeed, in Figures 4 (g)–(l) the galaxy ESO358-G25 moves to much younger ages. As none of the other galaxies move significantly to younger ages we conclude that nebular emission is not very prominent in our Fornax sample. This is supported by the absence of strong [OIII] emission. Only 5 galaxies show emission above our detection limit of 0.2 Å. The strongest emission is detected in ESO358-G25 with 0.7 Å equivalent width (for details see Kuntschner 1998).
5.3 Effects of composite stellar populations
Most of the S0s in our sample have luminosity weighted young stellar populations with some of them having also high metallicities when compared to single-burst stellar population (SSP) models. However, these galaxies show only a central young stellar population on top of an underlying older one as opposed to be entirely young. It is not straight forward to compare composite stellar populations with SSP models [de Jong and Davies 1997]. So, how reliable are the age, metallicity and abundance ratio estimates taken directly from SSP models for these young galaxies? In order to explore this issue we calculated model predictions based on V96 for simple composite stellar populations. Two representative tracks are shown in Figure 8 for two age/metallicity diagnostic diagrams and a plot of Fe3 vs Mg2 in order to explore the behaviour of abundance ratios: Model A is a 15 Gyr old (90% in mass) stellar population plus a burst (10% in mass) of varying ages from 0.1 Gyr to Gyrs. Both populations have solar metallicity. For Model B we reduced the burst fraction to 1% (in mass) while the other parameters are the same as in Model A.
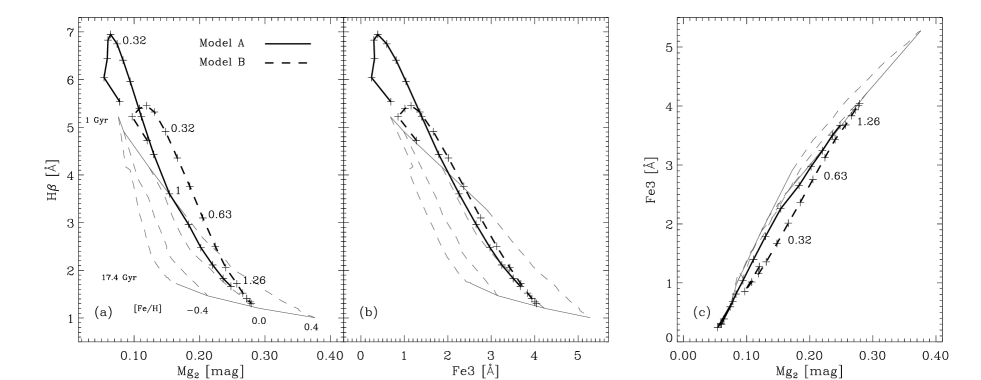
Overall one can see in the age/metallicity diagnostic diagrams that for a short time the burst population will dominate the integrated light leading to strong absorption and weak metal-line absorption. Then the underlying old population becomes more and more important and after 3 Gyrs the galaxy is almost back to its original place in the diagram. However, the burst strength influences the exact track which the galaxy takes in the diagram. For a burst of 10% or 20% (not shown) in mass the tracks follow roughly the solar metallicity line in the normal SSP models. Yet, for a small burst (1% in mass) the integrated light looks for a short while as having metallicities well above solar. This effect is more pronounced for Mg2 than for Fe3. Of course, this in turn leeds to an artificially created overabundance when these galaxies are compared to SSP models (see Figure 8c). For bursts stronger than a few percent the abundance ratios are not significantly affected.
In summary we find that composite stellar populations and in particular small (in mass) bursts, such as used in our simple models, can lead to an overestimation of the metallicity in the context of SSP models. Abundance ratios can be affected in the sense that the Mg/Fe ratio is too strong. Our model calculations show that these conclusions qualitatively hold if the metallicity is changed or different metallicities are combined. A more thorough investigation of these issues would be very valuable but is beyond the scope of this paper (see Hau, Carter & Balcells (1999) for a more detailed analysis).
5.4 Best age and metallicity estimates
Having examined some of the fundamental problems with applying stellar population model predictions to observed line-strength indices we present in Figure 9 what we consider our best age/metallicity diagnostic diagram. A mean Fe-index (Fe3) is plotted against an emission robust higher order Balmer line (). Due to the lack of model predictions with non-solar abundance ratios we decided to avoid indices which are affected by overabundance problems (e.g., Mg & C24668). Instead we use here a combination of Fe-indices (Fe3) as metal indicator which will bias our results towards the Fe abundance. We note however, that our metallicities are not to be understood as total metallicity but rather as a good estimate of the Fe-abundance. Any non-solar abundance ratios which affect are ignored. Model predictions by W94 and V96 are overplotted in Figure 9.
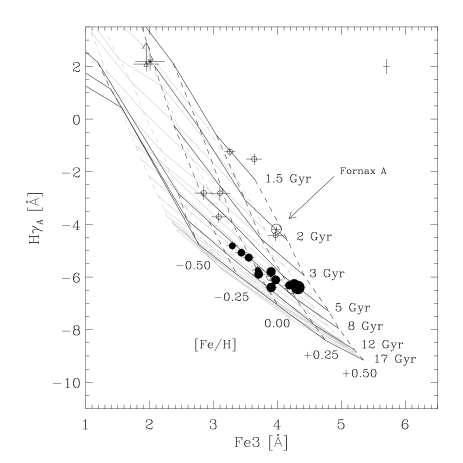
The ellipticals form a sequence of metallicity at roughly constant age. The centres of the bright S0s NGC1380 & NGC1381 follow the sequence of Es. The remaining S0s cover a large range in metallicity and spread to much younger luminosity weighted ages than the Es. We emphasize that these age and metallicity estimates are central luminosity weighted estimates and for apparently young galaxies the derived parameters are somewhat more insecure (see previous discussion about the effects of composite stellar populations). The age and metallicity gradients within the galaxies will be discussed in a future paper. Fornax A, a bright peculiar S0, shows strong Balmer lines and strong Fe absorption which translates into a luminosity weighted young and metal rich stellar population. As we will see in the next section all other young or metal poor S0s have velocity dispersions of km s-1. The two galaxies with the weakest metal lines and strong & absorption (ESO359-G02, cross and ESO358-G25, open triangle) appear to be different from the rest of the sample. These galaxies are likely to be post-starburst or starburst galaxies respectively. They have remarkable spectra for early-type galaxies, showing blue continua, strong Balmer lines, and weak metal lines. These galaxies are amongst the faintest in our sample and are 3° away from the centre of the cluster (see also Kuntschner & Davies 1998).
6 LINE–STRENGTH INDICES AND THE CENTRAL VELOCITY DISPERSION
The central velocity dispersion of early-type galaxies is known to correlate strongly with colours [Bower, Lucey & Ellis 1992] and the absorption strength of the Mg-absorption feature at 5174 Å [Terlevich et al. 1981, Burstein et al. 1988, Bender, Burstein & Faber 1993, Jørgensen 1997, Colless et al. 1999]. The relatively small scatter about these relations imply that the dynamical properties of galaxy cores are closely connected with their stellar populations. However, analysing the Mg– relation for a sample of 736 mostly early-type galaxies in 84 clusters, the EFAR group [Colless et al. 1999] finds a rather large dispersions in age (40%) and in metallicity (50%) at fixed velocity dispersion using the constraints from the Mg– relation and the Fundamental Plane. Correlations of other metal indices, such as Fe, with the central velocity dispersion have long been expected but so far relations have shown a large scatter and only weak correlations [Fisher, Franx & Illingworth 1996, Jørgensen 1997, Jørgensen 1999]. However, we will demonstrate that galaxies in the Fornax cluster do show a clear correlation between Fe-indices and central velocity dispersion.
Following Colless et al. (1999) we find it more convenient to express the “atomic” indices in magnitudes like the “molecular” index Mg2. The new index is denoted by the index name followed by a prime sign [′], e.g., Mg b ′. Note that by using only the logarithm of the atomic index, one introduces a non linear term in comparison to the magnitude definition. Furthermore negative index values such as for the index cannot be put on a simple logarithmic scale. A priori it is not clear whether index or index correlates better with , but as the classical Mg– relation was established with Mg2 measured in mag we adopt this approach here for all other indices as well. The conversion between an index measured in Å and magnitudes is
| (2) |
where is the width of the index bandpass (see e.g., WO97 and Trager et al. 1998 for a list of bandpass definitions). Fe3′ is defined as
| (3) |
Figure 10 shows index– relations for eight different metal indices and two Balmer-line indices. The best fitting linear relations and the scatter are summarized in Table 5 for all indices considered in this paper. For the fits we used an ordinary least square method, minimizing the residuals in y-direction [Isobe et al. 1990, hereafter OLS(YX)]. Included in the fit are all galaxies with old stellar populations, i.e., all Es plus the bright S0s NGC1380 & NGC1381; in total 13 galaxies. The 1- scatter around the relation was robustly estimated by deriving a value which includes 9 out of 13 galaxies (69%). A correlation coefficient derived from a (non parametric) Spearman rank-order test is given in the lower right corner of each panel in Figure 10. The probability that the parameters are not correlated is given in brackets.

| index | scatter | ||
| [mag] | |||
| Mg2 | 0.017 | ||
| Mg1 | 0.014 | ||
| Mg b ′ | 0.011 | ||
| C24668 | 0.012 | ||
| Fe3′ | 0.005 | ||
| Fe4383′ | 0.007 | ||
| Fe4531′ | 0.007 | ||
| Fe5015′ | 0.005 | ||
| Fe5270′ | 0.004 | ||
| Fe5335′ | 0.005 | ||
| Fe5406′ | 0.005 | ||
| Ca4455′ | 0.009 | ||
| ′ | 0.004 | ||
| ′ | 0.010 | ||
| ′ | 0.009 | ||
| Note – Errors are estimated by a Jack-Knife error analysis. | |||
For the galaxies with old stellar populations the Mg– relation is in excellent agreement with the literature (Jørgensen 1997; Colless et al. 1999). Remarkably, the Fe-line-indices also show a clear positive correlation with the central velocity dispersion and little scatter. This is the first time such strong correlations have been found at a significant level. We note that all the Fe-line and Ca4455– relations show a slope consistent with a value of . In contrast the slope of the Mg-lines and C24668 are significantly steeper (see dot-dashed line in Figure 10 and Table 5).
Although our Mg2– relation agrees well with the literature values we find significant differences for other – relations compared to the data of Jørgensen (1997,1999). Table 6 shows a comparsion of the slopes. The Fe– relation seems to be far steeper in the Fornax cluster whereas the – relation is shallower compared to Coma. The – relation in Fornax is marginally consistent with Jørgensen (1997). It is not clear why the – relations for H and Fe should be different to the Coma cluster. We will present a possible explanantion at the end of this Section and in Section 8 where we discuss our results.
| index | this data | literature | reference |
| Fe | (1) | ||
| (2) | |||
| (1) | |||
| (2) | |||
| (1) | |||
| References: | (1) Jørgensen (1997, 11 nearby clusters) | ||
| (2) Jørgensen (1999, Coma cluster) | |||
The centres of the two bright and old S0s NGC1380 & NGC1381 follow generally well the relation set by the elliptical galaxies. The lower luminosity S0s have velocity dispersions km s-1 and show a large scatter about the mean relation of the old galaxies. However, it is worth noting that they exhibit generally weak Mg absorption and some of the faint S0s show as much Fe absorption as L∗ ellipticals. Fornax A, the brightest galaxy in our sample has a central velocity dispersion of km s-1 which is too low compared to ellipticals of this luminosity in the Faber-Jackson relation (see Figure 11). It also departs significantly from the Mg– relations in the sense that it shows too weak Mg-absorption. As Fornax A is regarded as the product of a recent merger [Schweizer 1980, Schweizer 1981, Mackie & Fabbiano 1998] we interpret our results as strong indications of at least one young stellar component in this galaxy.
One would expect the young stars in this galaxy to produce strong Balmer absorption lines (as seen in Figure 9) and to dilute (or weaken) the metal lines of the underlying older stellar component. However, if the burst mass is not too small, the relative abundances of metal lines should in first order not be affected (see discussion of composite stellar populations in Section 5.3). Yet, we find that Fornax A deviates only from the Mg– relation and not from any of the other metal-index– relations (Figure 10). We interpret this as good evidence that the underlying older stellar population of Fornax A is significantly different from ellipticals at this velocity dispersion, i.e.,the [Mg/Fe] ratio is lower, close to solar.

Two of the ellipticals stand out from the normal metal index– relation: NGC1373 and IC2006 (labelled in Figure 10). These galaxies always show stronger metal line absorption than what would be expected from the mean relation. This is most prominent in the Fe3′– diagram (panel c). We note however, that the galaxies follow the mean Faber-Jackson relation (Figure 11). There is little known about the galaxy NGC1373; perhaps the best explanation why this (elliptical) galaxy is somewhat off the mean relation is to regard it as a transition galaxy between the sequence of Es and the faint S0s. However, IC2006 has been studied in detail by Schweizer et al. (1989). They found a large counter-rotating ring of neutral hydrogen (HI) associated with faint optical features and suggest that the HI ring may have formed during a merger which created IC2006. Franx et al. (1994) re-analysed the optical photometry of Schweizer et al. taking into account the inclination of the galaxy and concluded that it probably has a large disc in the outer parts which is seen almost face on and therefore difficult to detect. They suggest that it should be classified as E/S0 rather than a bona fide elliptical.
It seems plausible that the (perhaps peculiar) merger history of this galaxy is the reason for its deviation from the index– relations. However from our data, it is not clear whether the stellar populations of IC2006 are too metal rich or whether the central velocity dispersion is reduced compared to other elliptical galaxies of this mass. If indeed this type of galaxy is more frequent in other clusters, such as the Coma cluster (see Jørgensen 1999), it would explain why previous authors did not find a clear correlation of Fe-lines with . A detailed analysis of the kinematics and stellar population of this galaxy could be very valuable for our understanding of how todays early-type galaxies were created.
Panels (i) & (j) in Figure 10 show the index– relations for two Balmer lines. Both indices show negative correlations. Elliptical galaxies and the bulges of NGC1380 and NGC1381 show little spread around the mean relation whereas the younger galaxies, most remarkably NGC1316, tend to have significantly stronger Balmer absorption at a given . We emphasize here that the slope in the relation of the galaxies with old stellar populations is mainly caused by a metallicity effect (metal poorer galaxies have stronger Balmer absorption) and has little to do with age differences. The two “metal-rich” galaxies IC2006 and NGC1373 are deviant from the main ′– relation in the sense of lower line strengths. This is caused by the residual metallicity sensitivity of . The side-bands of this index are located on metal lines which lower the pseudo-continuum level and thus weaken the index.
7 Global relations
In this section we investigate the relations between our best age, metallicity, [Mg/Fe] estimates and the central velocity dispersions. Figure 12 presents the results. The ages and metallicities were estimated from a Fe3 vs age/metallicity diagnostic diagram (Figure 9) in combination with V96 models. The errors are evaluated following the procedure outlined in Section 5.1 but only including the Poisson error for individual galaxies. Some of the young galaxies are at the edge or outside the range of the model predictions which prevents an accurate error evaluation. For the latter galaxies we do not plot error bars. Notice that the ages and metallicities are derived parameters which carry all the caveats discussed in the previous sections. For example the independent measurement errors of the line-strength indices translate into correlated errors in the age – metallicity plane due to the residual age/metallicity degeneracy in the Fe3 vs diagram. We note that the results presented in the following paragraphs would not change significanlty if is used as an age indicator (see Figure 16 and 17 in the Appendix for a comparison of the age and metallicity estimates derived from & ). The Mg-overabundance is estimated by evaluating the difference in metallicity estimate between a Mg2– and a Fe3– diagram (see Figure 18 in the Appendix for an estimation of [Mg/Fe] using ).

Our age estimates of ellipticals do not show a significant correlation with (panel a). With the exception of Fornax A all galaxies with km s-1 show roughly the same age whereas the younger galaxies populate the low velocity dispersion range. However, there is a hint that the two dynamically hottest galaxies are younger than their smaller brethren.
For galaxies with old stellar populations there is a clear correlation between the central metallicity and the central velocity dispersion (panel b). Consistent with our findings for the Fe3– relation the galaxies IC2006 and NGC1373 show a stronger metal content than what would be expected from the mean relation. The young S0s spread over the whole metallicity range. The best fitting OLS(YX) relation (solid line, Jack-Knife error analysis) to galaxies with old stellar populations gives:
| (4) |
A correlation coefficient derived from a Spearman rank-order test (including all ellipticals and the two large S0s) is given in the lower right corner of each panel in Figure 12. The probability that the parameters are not correlated is given in brackets. Excluding NGC1373 and IC2006 from the fit gives the following relation (dashed line in panel b):
| (5) |
In the age-metallicity plane (panel c) we find a statistically significant relation in the sense that the more metal rich (and also more luminous) galaxies are younger. The slope of this relation is similar to what Jørgensen (1999) found for the Coma cluster (see also Worthey, Trager & Faber 1995), yet the Fornax galaxies with velocity dispersion km s-1 span a much smaller range in age and [Fe/H]. We note that the non-treatment of non-solar abundance ratios in combination with correlated errors could be the sole reason for the trend found in Fornax. The direction and magnitude of correlated errors for a galaxy of solar metallicity and 8 Gyrs age are shown in panel (c), top right corner. Following on from the age–metallicity relation Jørgensen (1999) established for the Coma cluster an age–[Mg/H]– relation. It would be very interesting to see whether such a correlation exists also in Fornax. However, the small number of galaxies combined with a rather small spread in age makes such an analysis very insecure and has therefore not been attempted.
The Mg-overabundance shows a weak positive correlation with central velocity dispersion and [Fe/H] in the sense that dynamically hotter and more metal rich galaxies are more overabundant (panel d, f). In the Fornax cluster significant overabundances are found for galaxies with km s-1 or (panel f, g). The best fitting linear relation between [Mg/Fe] and is:
| (6) |
This relation is qualitatively in agreement with the results from the Coma cluster (Jørgensen 1999, long-dashed line in Figure 12d). The scatter about the [Mg/Fe]– relation in Fornax is consistent with the errors for [Mg/Fe], but there seems to be a rather large spread in the [Mg/Fe] ratio at a given metallicity (panel f). Although the latter is in good agreement with our findings in the Fe-Mg2 diagram (Figure 5), we note that the errors are heavily correlated in the [Mg/Fe]–[Fe/H] diagram. There is no significant correlation of the [Mg/Fe] ratio with where the young S0s show solar or slightly less than solar [Mg/Fe] ratios.
8 DISCUSSION
In this study, great care was taken to calibrate the line-strength measurements to a standard system in which we can compare the results with theoretical model predictions (Section 3). The accuracy of this calibration is vital when one wants to derive absolute age and metallicity estimates. Although we were able to demonstrate the high quality of our calibration some unresolved issues such as the systematic offset in the Mg2 vs Mg b diagram, the rather large rms error in the original Lick/IDS stellar library and perhaps most important of all the largely unknown effects of non-solar abundance ratios prevent us from deriving accurate absolute age and metallicity estimates. However, for the discussion of relative differences in the stellar populations of early-type galaxies our data set and current models are of excellent use.
In this paper we have made use of two stellar population models provided by Worthey (1994) and Vazdekis et al. (1996). Both models make use of the Lick/IDS fitting functions but have otherwise somewhat different prescriptions to predict line-strength indices of integrated single-burst stellar populations (SSP). The predictions of the two models are consistent and our conclusions would not change if only one of them had been used for the analysis. To our knowledge, this would be also true if we had used any other model which makes use of the Lick/IDS fitting functions.
One of the most important results from this study is the homogeneity of the stellar populations in dynamically hot early-type galaxies in the Fornax cluster. Apart from Fornax A all early-type galaxies (Es & S0s) with km s-1 are of roughly the same age and their central metallicity scales with . The homogeneity is reflected in tight relations of observables such as Mg– and Fe– and a clear correlation of [Fe/H] with the central velocity dispersion. The existence of the latter is reassuring in terms of our current understanding of the colour-magnitude-relation (CMR) in clusters being mainly a result of increasing metallicity with increasing luminosity [Kodama & Arimoto 1997, Terlevich et al. 1999].
Previous authors [Fisher, Franx & Illingworth 1996, Jørgensen 1997, Jørgensen 1999] pointed out that the lack of a correlation of Fe-absorption strength with central velocity dispersion would give evidence for a second parameter or conspiracy of age, metallicity and [Mg/Fe] ratio which keeps the CMR tight. For example in the Coma cluster Jørgensen (1999) did not find a strong correlation of Fe with central velocity dispersion and hence her [Fe/H]– relation is also not significant. However, both the Mg– and [Mg/H]– relation are clearly seen in Coma. In this context it is important to note that the slope of the Fe– relation which one would expect from the change of metallicity in the CMR [Kodama & Arimoto 1997] is quite shallow and therefore only detectable with high S/N data. In contrast, the Mg– relation is steeper, and therefore easier to detect. The reason for this is a combination of a larger dynamical range in the Mg indices compared to the average Fe-index and an increasing Mg overabundance with central velocity dispersion giving a steeper slope than what would be expected from the change in metallicity only.
An alternative explanation for the lack of a Fe– relation in Coma could be based on galaxies such as IC2006, which do not follow the Fe– relation very well. If this type of galaxy is more frequent in the Coma cluster than in Fornax it would be impossible to find a clear Fe– relation. In summary we find that in the Fornax cluster there is no need for a second parameter such as age, metallicity or [Mg/Fe] to keep the CMR tight. Indeed, we favour an interpretation where small variations of age, metallicity and/or [Mg/Fe] at any given are responsible for some real scatter in the scaling relations for the Fornax cluster. However, we emphasize that this may not be true for other (larger?) clusters.
In addition to the population of old, dynamically hot early-type galaxies, we find a sizeable fraction of young, dynamically colder ( km s-1) systems within our magnitude limited survey. Some of the young S0s (NGC1375, ESO359-G02 and ESO358-G25) fit in remarkably well with the predictions of galaxy harassment in clusters (Moore, Lake, Katz 1998; Lake, Katz, Moore 1998). In this scenario, medium sized disc galaxies (Sc-type) fall into a cluster environment and get “harassed” by high speed encounters with cluster galaxies. The end-products are small spheroidal galaxies where some gas of the disc is driven into the centre of the galaxy. This gas is likely to be turned into stars in a central stellar burst. We note, that most of these young galaxies are in the periphery of the Fornax cluster consistent with having been “accreted” onto the cluster from the field.
Two of the S0s which show young populations in the centre, also have extended discs (NGC1380A and IC1963). This seems to be in contradiction with the harassment picture. However we emphasize, that the existing harassment simulations do not include spirals with a substantial bulge component. Here the bulge is likely to stabilize the disc and the end-products may be able to keep substantial disc components (Ben Moore, private communication). The existence of a population of dynamically colder galaxies with young stellar populations in the nuclear regions is in agreement with a typical (nearby) cluster CMR where one finds a tail of blue galaxies towards the faint end (e.g., Terlevich 1998). Furthermore Terlevich et al. (1999) demonstrate for the Coma cluster, using line-strength analysis, that these blue galaxies contain young stellar populations rather than being metal poor.
It seems that in the Fornax cluster significant amounts of young stellar populations are predominantly found in low luminosity (lenticular) systems. However, for a sample of Coma cluster early-type galaxies Mehlert (1998) found that relatively bright S0s spread over the whole range in age (Es, excluding the cDs, are found to be old). This of course raises the question whether morphology is the driving parameter for young stellar populations (only S0s are younger) or whether luminosity is the important parameter (low luminosity E & S0 galaxies are on average younger). Taking the results from Coma and Fornax together we would like to argue that in clusters it is only the lenticular galaxies which show signs of recent star formation and that low luminosity lenticular systems are more likely to do so. The latter may be just caused by the recent accretion of these low luminosity systems onto the cluster.
So far we have addressed the age and metallicity distributions in the Fornax cluster with the help of line-strength indices. However there is more detailed information on the star formation (SF) processes to be gained if one investigates the [Mg/Fe] abundance ratios. When new stars are formed chemical enrichment is predominantly driven by the ejecta of SN Ia (main producer of Fe peak elements) and SN II (producing mainly alpha elements). However, SN Ia are delayed compared to SN II which explode on short time-scales of yr. Taking this into account there are mainly two mechanisms which determine the Mg/Fe ratio in galaxies: (i) the star formation time scale and (ii) the fraction of high mass stars, i.e., the initial mass function (IMF) (see e.g., Worthey et al. 1992). As re-confirmed in this study, the majority of cluster early-type galaxies show a trend of increasing [Mg/Fe] ratio with central velocity dispersion. Galaxies with young stellar populations and/or low luminosity galaxies show roughly solar abundance ratios. Given that the most luminous galaxies are also the metal richest, we emphasize that any realistic star-formation models have to be able to produce metal rich and Mg-overabundant stars at the same time.
In principle one can reproduce the observed trends of overabundances and metallicity with varying star-formation time-scales: large galaxies form within shorter time-scales than smaller galaxies [Bressan, Chiosi, & Tantalo 1996]. However, this leeds to extremely short star-formation time-scales for the most massive galaxies. A plausible way to solve this dilemma would be a varying IMF where massive galaxies have a top heavy IMF and low luminosity galaxies show a more Salpeter like IMF. For further discussions of the matter see also Peletier (1999) and Tantalo, Chiosi & Bressan (1998).
Recently, Thomas & Kauffmann (1999, see also Thomas 1999) presented preliminary results from their semi-analytic galaxy formation models for the distribution of [Mg/Fe] in galaxies as a function of luminosity. In this scenario luminous ellipticals are the last to form and hence Thomas & Kauffmann find a trend that the [Mg/Fe] ratio decreases with increasing luminosity, opposite to the observed trend. In general it seems very difficult with the current stellar population models to reproduce the observed Magnesium strength, and therefore [Mg/Fe] values () of luminous ellipticals (Greggio 1997, but also see Sansom & Proctor 1998).
9 CONCLUSIONS
We have measured the central line strength indices in a magnitude limited sample of early-type galaxies brighter than in the Fornax cluster and have applied the models of Worthey (1994), Worthey & Ottaviani (1997) and Vazdekis et al. (1996) to estimate their ages, metallicities and abundance ratios. We find that:
-
1.
Elliptical Galaxies appear to be roughly coeval forming a sequence in metallicity varying roughly from to in [Fe/H]. This result is consistent with the conventional view of old, coeval elliptical galaxies where the metallicity scales with the luminosity of the galaxy. This is reflected in scaling relations such as Mg–. Remarkably, we could show that all other metal line-strength indices also clearly correlate with the central velocity dispersion. In fact all Fe-line– relations are consistent with having the same slope.
-
2.
Lenticular Galaxies have luminosity weighted metallicities spanning the whole range of SSP model predictions. Lower luminosity S0s show luminosity weighted ages younger than those of the ellipticals. However, the centres of the bright lenticular galaxies NGC1380 and NGC1381 resemble the properties of ellipticals suggesting that they experienced similar star formation histories. The peculiar S0 galaxy Fornax A (NGC1316), which is the brightest galaxy in the sample, has strong Balmer lines implying a very young luminosity weighted age, yet the metallicity is equal to the most metal rich Es. This is consistent with Fornax A having been involved in a recent gaseous merger. The S0s NGC1380 and NGC1381 follow the index– relations of the ellipticals very well. However, the S0s with a young stellar component generally show a large scatter around the scaling relations.
-
3.
Our conclusions are based on several age/metallicity diagnostic diagrams which give consistent results. Furthermore we demonstrate the advantage of using an emission robust age indicator such as H when analysing the stellar populations of extragalactic objects.
-
4.
We have discovered that two of the fainter and very metal poor lenticular galaxies appear to have undergone major star-formation in the last 2 Gyrs (in one case very much more recently). We note that, like Fornax A, most of the young galaxies lie on the periphery of the cluster. This is consistent with the harassment picture where these galaxies are accreted from the field and undergo a morphological transformation with a central star burst.
-
5.
The elliptical galaxies and the S0 NGC1380 exhibit overabundances up to 0.4 dex in Magnesium compared to Fe. There is a trend that the most massive and metal rich galaxies are the most overabundant, whereas the fainter Es approach solar ratios. This trend is inconsistent with the currently available semi-analytical predictions for hierarchical galaxy formation. S0s with young stellar populations are consistent with roughly solar abundance ratios, and may even be slightly underabundant. Remarkably also Fornax A, the brightest galaxy in our sample, shows close to solar abundance ratios which is not what one would expect of an early-type galaxy of its size.
-
6.
Furthermore we note that abundance ratio trends, which are not included in the models, can lead to a change of relative age and metallicity estimates depending on which index combination is used in the analysis. As long as the non-solar abundance ratios are not properly incorporated into the models the estimation of absolute ages of integrated stellar populations remains insecure.
ACKNOWLEDGEMENTS
HK acknowledges the use of STARLINK computing facilities at the University of Durham and also wishes to thank the Dr. Carl Duisberg Stiftung and University of Durham for generous financial support during the course of this work. Special thanks go to Roger Davies who provided excellent supervision throughout this project. Interesting and very helpful discussions of the following people are acknowledged: Eric Bell, Richard Bower, Taddy Kodama, Reynier Peletier, Jim Rose and Alexandre Vazdekis. Thanks also go to Scott Trager and Guy Worthey for providing the Lick/IDS measurements of the higher order Balmer lines. HK thanks the referee, Inger Jørgensen, for a careful and thorough reading of this paper which helped to improve the final presentation.
Appendix A Kinematics
In Figure 13 a literature comparison of the central velocity dispersion measurements is presented. The most recent data for Fornax galaxies from Graham et al. (1998) as well as the literature compilation of Smith (1998, Private communication) is in good agreement with our data. The comparison with the literature compilation by McElroy (1995) shows a somewhat larger scatter. In order to establish an average error for the velocity dispersion estimates the mean scatter of the data compared to Smith (1998) and Graham et al. (1998) is evaluated. For the comparison all galaxies with km s-1 and also NGC1419 (marked in Figure 13) from the Smith compilation were excluded. The mean scatter is 0.027 in . Subtracting in quadrature a mean error of 0.015 for the literature data gives an error of 0.022 [in ] for galaxies with km s-1. For galaxies with km s-1 we adopt the rms scatter of the template stars as estimate of the error ().

Appendix B Lick/IDS calibration
In Figure 14 a comparison between the original Lick/IDS index measurements of stars and selected galaxies in common with our data is shown. The individual diagrams show the scatter (Lick/IDS - AAT) around the mean offset vs the average of Lick/IDS and AAT.

Figure 15 shows the velocity dispersion corrections for each index as derived from broadened stellar and selected galaxy spectra.

Appendix C Comparison of derived ages, metallicities and [Mg/Fe] ratios
Here we present three Figures (16, 17 & 18) comparing our age, metallicity and [Mg/Fe] estimates derived with different index combinations. In general we find very consistent results when we use e.g., instead of as an age indicator. Most of the differences, such as the [Mg/Fe] ratios of some of the young lenticular galaxies, is caused by the data points lying at the edge of the model predictions or where they have been extrapolated. The extrapolation was necessary because the models reflect roughly solar abundance ratios and cannot account for e.g., the strongest Mg2 absorption found in our sample.


Appendix D Final calibrated central indices
D.1 Table of central index measurements
The final, fully corrected central (2385) index measurements and associated errors for the Fornax galaxies and NGC3379 are presented in Table D2. For each galaxy we give our Lick/IDS index measurement in the first row and the 1 error in the second row. The second column (first part of Table D2) lists central velocity dispersions in units. The last column (part two of Table D2) lists H (not Lick/IDS index); for further details see Section D.2.
D.2 vs H relation
Figure 19 shows a plot of equivalent width vs H equivalent width. The bandpasses of the H index are defined by Jørgensen (1997), based on an earlier definition of an emission index by González (1993), in such a way that the influence of the Fe feature right next to the absorption feature is minimized. For wavelength definitions see Table 7.
| Index | Index bandpass | Pseudocontinua |
|---|---|---|
| H | 4851.32 – 4871.32 | 4815.00 4845.00 |
| 4880.00 4930.00 |
The indices & H show an excellent correlation for the Fornax sample. The solid line in Figure 19 shows the fit to all the data, excluding ESO358-G25 (open triangle) because of its emission contamination, using a method which bisects the ordinary least squares fits made by minimising the X and the Y residuals:
| (7) |
The derived relation (errors from a Jack-Knife analysis) is in very good agreement with the relation found by Jørgensen (1997).

| Name | log | G4300 | Fe4383 | Ca4455 | Fe4531 | C4668 | Fe5015 | Mg1 | |
|---|---|---|---|---|---|---|---|---|---|
| [Å] | [Å] | [Å] | [Å] | [Å] | [Å] | [Å] | [mag] | ||
| NGC1316 | 2.344 | 5.14 | 5.95 | 2.02 | 3.57 | 8.02 | 2.20 | 5.70 | 0.119 |
| 0.022 | 0.11 | 0.16 | 0.09 | 0.12 | 0.19 | 0.07 | 0.16 | 0.003 | |
| NGC1336 | 1.982 | 5.47 | 4.85 | 1.49 | 3.03 | 4.70 | 1.64 | 4.90 | 0.097 |
| 0.022 | 0.15 | 0.21 | 0.11 | 0.16 | 0.23 | 0.09 | 0.21 | 0.005 | |
| NGC1339 | 2.199 | 5.93 | 6.15 | 1.88 | 3.78 | 7.69 | 1.52 | 5.63 | 0.168 |
| 0.022 | 0.17 | 0.25 | 0.14 | 0.18 | 0.26 | 0.11 | 0.25 | 0.006 | |
| NGC1351 | 2.196 | 6.04 | 5.56 | 1.73 | 3.26 | 5.54 | 1.50 | 5.74 | 0.137 |
| 0.022 | 0.16 | 0.23 | 0.13 | 0.17 | 0.25 | 0.10 | 0.23 | 0.005 | |
| NGC1373 | 1.875 | 5.98 | 5.83 | 1.78 | 3.36 | 5.41 | 1.85 | 5.18 | 0.101 |
| 0.022 | 0.15 | 0.21 | 0.11 | 0.16 | 0.24 | 0.10 | 0.21 | 0.005 | |
| NGC1374 | 2.267 | 6.21 | 5.80 | 1.85 | 3.58 | 7.07 | 1.57 | 5.82 | 0.164 |
| 0.022 | 0.15 | 0.22 | 0.13 | 0.16 | 0.24 | 0.09 | 0.22 | 0.005 | |
| NGC1375 | 1.748 | 3.90 | 4.40 | 1.48 | 3.33 | 4.93 | 2.85 | 5.47 | 0.062 |
| 0.074 | 0.14 | 0.19 | 0.10 | 0.15 | 0.22 | 0.09 | 0.20 | 0.005 | |
| NGC1379 | 2.114 | 5.99 | 5.37 | 1.76 | 3.14 | 5.16 | 1.70 | 4.93 | 0.121 |
| 0.022 | 0.14 | 0.21 | 0.11 | 0.16 | 0.23 | 0.09 | 0.21 | 0.005 | |
| NGC1380 | 2.340 | 5.92 | 6.26 | 1.70 | 3.84 | 8.50 | 1.37 | 5.72 | 0.161 |
| 0.022 | 0.18 | 0.27 | 0.16 | 0.19 | 0.29 | 0.11 | 0.27 | 0.006 | |
| NGC1380A | 1.740 | 4.16 | 5.04 | 1.67 | 3.53 | 5.43 | 2.87 | 5.79 | 0.076 |
| 0.074 | 0.20 | 0.28 | 0.15 | 0.21 | 0.32 | 0.13 | 0.29 | 0.007 | |
| NGC1381 | 2.185 | 6.09 | 5.82 | 1.85 | 3.42 | 5.99 | 1.70 | 5.45 | 0.121 |
| 0.022 | 0.11 | 0.15 | 0.08 | 0.11 | 0.16 | 0.06 | 0.15 | 0.003 | |
| NGC1399 | 2.574 | 5.90 | 6.49 | 2.18 | 4.06 | 8.93 | 1.41 | 6.41 | 0.191 |
| 0.022 | 0.17 | 0.29 | 0.16 | 0.17 | 0.39 | 0.08 | 0.24 | 0.004 | |
| NGC1404 | 2.415 | 6.03 | 6.26 | 1.96 | 3.81 | 8.52 | 1.58 | 6.39 | 0.162 |
| 0.022 | 0.14 | 0.20 | 0.12 | 0.14 | 0.24 | 0.08 | 0.20 | 0.004 | |
| NGC1419 | 2.068 | 5.75 | 5.28 | 1.56 | 3.18 | 4.97 | 1.62 | 4.92 | 0.111 |
| 0.022 | 0.15 | 0.22 | 0.12 | 0.16 | 0.24 | 0.10 | 0.22 | 0.005 | |
| NGC1427 | 2.243 | 5.95 | 5.92 | 1.89 | 3.61 | 6.20 | 1.67 | 5.43 | 0.127 |
| 0.022 | 0.09 | 0.12 | 0.07 | 0.09 | 0.14 | 0.05 | 0.12 | 0.003 | |
| IC1963 | 1.763 | 5.08 | 6.03 | 1.81 | 3.31 | 5.98 | 2.33 | 5.39 | 0.093 |
| 0.074 | 0.19 | 0.27 | 0.14 | 0.21 | 0.31 | 0.13 | 0.28 | 0.007 | |
| IC2006 | 2.134 | 5.95 | 6.18 | 1.98 | 3.74 | 8.50 | 1.44 | 5.73 | 0.171 |
| 0.022 | 0.15 | 0.22 | 0.12 | 0.16 | 0.23 | 0.10 | 0.22 | 0.005 | |
| E359-G02 | 1.653 | 1.64 | 2.77 | 1.30 | 2.23 | 1.58 | 3.46 | 2.97 | 0.039 |
| 0.074 | 0.35 | 0.50 | 0.26 | 0.39 | 0.61 | 0.23 | 0.55 | 0.013 | |
| E358-G06 | 1.763 | 5.00 | 4.05 | 1.22 | 2.64 | 2.60 | 2.22 | 4.51 | 0.057 |
| 0.074 | 0.23 | 0.33 | 0.17 | 0.25 | 0.38 | 0.15 | 0.34 | 0.008 | |
| E358-G25 | 1.763 | 1.58 | 2.28 | 0.70 | 2.01 | 1.25 | 2.56 | 3.86 | 0.039 |
| 0.074 | 0.30 | 0.43 | 0.23 | 0.34 | 0.53 | 0.21 | 0.47 | 0.012 | |
| E358-G50 | 1.690 | 4.85 | 4.22 | 1.46 | 2.64 | 3.76 | 2.44 | 4.18 | 0.064 |
| 0.074 | 0.24 | 0.35 | 0.18 | 0.27 | 0.41 | 0.16 | 0.36 | 0.009 | |
| E358-G59 | 1.732 | 5.04 | 4.84 | 1.52 | 3.00 | 4.71 | 2.19 | 4.66 | 0.067 |
| 0.074 | 0.19 | 0.26 | 0.14 | 0.20 | 0.30 | 0.12 | 0.27 | 0.007 | |
| NGC3379 | 2.367 | 6.02 | 6.30 | 1.90 | 3.92 | 7.48 | 1.33 | 5.56 | 0.166 |
| 0.022 | 0.15 | 0.23 | 0.13 | 0.16 | 0.24 | 0.09 | 0.21 | 0.004 |
| Name | Mg2 | Mg b | Fe5270 | Fe5335 | Fe5406 | Fe5709 | |||
|---|---|---|---|---|---|---|---|---|---|
| [mag] | [Å] | [Å] | [Å] | [Å] | [Å] | [Å] | [Å] | [Å] | |
| NGC1316 | 0.260 | 4.08 | 3.10 | 2.90 | 1.82 | 1.04 | -4.18 | -0.64 | 2.49 |
| 0.004 | 0.08 | 0.08 | 0.10 | 0.07 | 0.05 | 0.11 | 0.08 | 0.04 | |
| NGC1336 | 0.237 | 4.17 | 2.70 | 2.33 | 1.51 | 0.81 | -4.82 | -1.34 | 1.92 |
| 0.006 | 0.10 | 0.12 | 0.13 | 0.10 | 0.08 | 0.17 | 0.10 | 0.06 | |
| NGC1339 | 0.321 | 4.99 | 3.04 | 2.72 | 1.96 | 0.93 | -6.11 | -1.91 | 1.89 |
| 0.007 | 0.12 | 0.13 | 0.16 | 0.11 | 0.09 | 0.20 | 0.12 | 0.07 | |
| NGC1351 | 0.287 | 4.72 | 3.03 | 2.51 | 1.78 | 0.98 | -5.89 | -1.85 | 1.85 |
| 0.006 | 0.11 | 0.12 | 0.15 | 0.11 | 0.09 | 0.18 | 0.11 | 0.07 | |
| NGC1373 | 0.243 | 3.90 | 2.95 | 2.29 | 1.74 | 0.89 | -5.74 | -1.55 | 2.19 |
| 0.006 | 0.10 | 0.12 | 0.13 | 0.10 | 0.08 | 0.17 | 0.11 | 0.06 | |
| NGC1374 | 0.323 | 5.01 | 3.13 | 2.76 | 1.87 | 0.98 | -6.40 | -2.02 | 1.86 |
| 0.006 | 0.10 | 0.12 | 0.14 | 0.10 | 0.08 | 0.17 | 0.11 | 0.06 | |
| NGC1375 | 0.177 | 2.71 | 2.88 | 2.49 | 1.54 | 1.08 | -1.24 | 1.06 | 3.06 |
| 0.006 | 0.10 | 0.11 | 0.13 | 0.10 | 0.08 | 0.14 | 0.09 | 0.06 | |
| NGC1379 | 0.269 | 4.45 | 2.80 | 2.47 | 1.71 | 0.92 | -5.26 | -1.59 | 1.94 |
| 0.006 | 0.10 | 0.11 | 0.13 | 0.10 | 0.08 | 0.17 | 0.10 | 0.06 | |
| NGC1380 | 0.321 | 4.86 | 3.24 | 3.18 | 1.93 | 1.00 | -6.43 | -2.16 | 1.77 |
| 0.007 | 0.13 | 0.14 | 0.17 | 0.13 | 0.09 | 0.20 | 0.13 | 0.08 | |
| NGC1380A | 0.202 | 3.09 | 3.01 | 2.84 | 1.83 | 1.01 | -1.52 | 0.96 | 3.12 |
| 0.009 | 0.15 | 0.16 | 0.19 | 0.14 | 0.12 | 0.21 | 0.13 | 0.09 | |
| NGC1381 | 0.274 | 4.42 | 3.15 | 2.71 | 1.80 | 0.97 | -5.99 | -1.87 | 2.04 |
| 0.005 | 0.07 | 0.08 | 0.09 | 0.07 | 0.05 | 0.12 | 0.08 | 0.04 | |
| NGC1399 | 0.368 | 5.91 | 3.36 | 3.11 | 1.88 | 0.83 | -6.40 | -2.04 | 1.83 |
| 0.004 | 0.16 | 0.11 | 0.17 | 0.11 | 0.07 | 0.12 | 0.14 | 0.05 | |
| NGC1404 | 0.325 | 5.00 | 3.37 | 3.14 | 1.98 | 0.88 | -6.29 | -1.99 | 1.95 |
| 0.004 | 0.10 | 0.10 | 0.13 | 0.09 | 0.06 | 0.13 | 0.10 | 0.05 | |
| NGC1419 | 0.242 | 3.93 | 2.72 | 2.30 | 1.53 | 0.82 | -5.08 | -1.50 | 1.95 |
| 0.006 | 0.10 | 0.12 | 0.14 | 0.10 | 0.08 | 0.17 | 0.11 | 0.07 | |
| NGC1427 | 0.277 | 4.40 | 3.13 | 2.64 | 1.82 | 0.99 | -5.80 | -1.68 | 2.02 |
| 0.003 | 0.06 | 0.06 | 0.07 | 0.05 | 0.04 | 0.09 | 0.07 | 0.03 | |
| IC1963 | 0.232 | 3.76 | 3.06 | 2.82 | 1.92 | 1.04 | -4.41 | -0.88 | 2.52 |
| 0.008 | 0.14 | 0.15 | 0.17 | 0.13 | 0.11 | 0.22 | 0.14 | 0.09 | |
| IC2006 | 0.329 | 4.92 | 3.19 | 3.17 | 1.95 | 0.96 | -6.32 | -2.13 | 1.91 |
| 0.006 | 0.10 | 0.12 | 0.14 | 0.10 | 0.08 | 0.18 | 0.11 | 0.06 | |
| E359-G02 | 0.119 | 1.50 | 1.87 | 1.38 | 1.02 | 0.77 | 2.19 | 2.69 | 3.50 |
| 0.016 | 0.28 | 0.31 | 0.36 | 0.27 | 0.22 | 0.33 | 0.20 | 0.16 | |
| E358-G06 | 0.164 | 2.74 | 2.54 | 1.95 | 1.36 | 0.60 | -2.81 | -0.07 | 2.48 |
| 0.010 | 0.17 | 0.19 | 0.22 | 0.16 | 0.14 | 0.25 | 0.15 | 0.10 | |
| E358-G25 | 0.121 | 1.78 | 1.99 | 1.57 | 1.19 | 0.52 | 2.09 | 1.92 | 2.46 |
| 0.014 | 0.24 | 0.28 | 0.32 | 0.24 | 0.20 | 0.28 | 0.17 | 0.14 | |
| E358-G50 | 0.176 | 2.55 | 2.74 | 2.34 | 1.58 | 0.95 | -2.82 | 0.00 | 2.67 |
| 0.011 | 0.18 | 0.20 | 0.23 | 0.17 | 0.15 | 0.27 | 0.16 | 0.11 | |
| E358-G59 | 0.184 | 3.02 | 2.30 | 2.11 | 1.45 | 0.89 | -3.72 | -0.49 | 2.42 |
| 0.008 | 0.13 | 0.15 | 0.17 | 0.13 | 0.11 | 0.21 | 0.13 | 0.08 | |
| NGC3379 | 0.329 | 5.13 | 3.21 | 2.86 | 1.89 | 0.99 | -6.39 | -2.20 | 1.80 |
| 0.005 | 0.11 | 0.11 | 0.14 | 0.10 | 0.07 | 0.16 | 0.11 | 0.06 |
References
- [Arimoto & Yoshii 1987] Arimoto N., Yoshii Y., 1987, AA, 173, 23
- [Baugh et al. 1996] Baugh C. M., Cole S., Frenk C., 1996, MNRAS, 283, 1361
- [Bender 1990] Bender R., 1990, AA, 229, 441
- [Bender, Burstein & Faber 1993] Bender R., Burstein D., Faber S. M., 1993, ApJ, 411, 153
- [Bender, Saglia & Gerhard 1994] Bender R., Saglia R. P., Gerhard O. E., 1994, MNRAS, 269, 785
- [Bower, Lucey & Ellis 1992] Bower R. G., Lucey J. R., and Ellis R. S., 1992, MNRAS, 254, 601.
- [Bressan, Chiosi, & Tantalo 1996] Bressan A., Chiosi C., Tantalo R., 1996, AA, 311, 425
- [Bruzual & Charlot 1993] Bruzual G. A., Charlot S., 1993, ApJ, 287, 586
- [Burstein et al. 1984] Burstein D., Faber S. M., Gaskell C. M., Krumm N., 1984, ApJ, 287, 586
- [Burstein et al. 1988] Burstein D., Davies R. L., Dressler A., Faber S. M., Lynden-Bell D., Terlevich R. J., Wegner G., 1988, in Kron R. G. and Renzini A., eds, Towards Understanding Galaxies at Large Redshifts, page 17, Dordrecht, Kluwer
- [Caldwell 1984] Caldwell N., 1984, PASP, 96, 287
- [Cardiel et al. 1998] Cardiel N., Gorgas J., Cenarro J., Gonzalez J. J. 1998, AAS, 127, 597
- [Colless et al. 1999] Colless M., Burstein D., Davies R. L., McMahan R. K., Saglia R. P., Wegner G., 1999, MNRAS, 303, 813
- [Davies, Sadler & Peletier 1993] Davies R. L., Sadler E. M., Peletier R. F., 1993, MNRAS, 262, 650
- [de Jong and Davies 1997] de Jong R. S., Davies R. L., 1997, MNRAS, 285, 1L
- [de Vaucouleurs et al. 1991] de Vaucouleurs G., de Vaucouleurs A., Corwin H. G., Jr., Buta R. J., Paturel G., Fouqué P., 1991, Third Reference Catalogue of Bright Galaxies, (Springer Verlag), (RC3)
- [Edvardsson et al. 1993] Edvardsson B., Anderson J., Gustafsson B., Lambert D. L., Nissen P. E., Tomkin J., 1993, AA, 275, 101
- [Ferguson 1989] Ferguson H. C., 1989, AJ, 98, 367
- [Fisher, Franx & Illingworth 1995] Fisher D., Franx M., Illingworth G., 1995, ApJ, 448, 119
- [Fisher, Franx & Illingworth 1996] Fisher D., Franx M., Illingworth G., 1996, ApJ, 459, 110
- [Franx et al. 1994] Franx M., van Gorkom J. H., de Zeeuw T., 1994, ApJ, 436, 642
- [Gorgas et al. 1999] Gorgas J., Cardiel N., Pedraz S., Gonzalez J. J., 1999, AAS, 139, 29
- [González 1993] González J. J., 1993, PhD thesis, University of California
- [Goudfrooij & Emsellem 1996] Goudfrooij P., Emsellem E., 1996, AA, 306, 45L
- [Goudfrooij et al. 1994] Goudfrooij P., Hansen L., Jørgensen H. E., Nørgaard-Nielsen H. U., 1994, AAS, 105, 341
- [Graham et al. 1998] Graham A. W., Colless M. M., Busarello G., Zaggia S., Longo G., 1998, AAS, 133, 325
- [Greggio 1997] Greggio L., 1997, MNRAS, 285, 151
- [Hau et al. 1999] Hau G. K. T., Carter D., Balcells M., 1999, MNRAS, 306, 437
- [Henry & Worthey 1999] Henry R. B. C., Worthey G., 1999, PASP, 111, 919
- [Isobe et al. 1990] Isobe T., Feigelson E. D., Akritas M. G., Babu G. J., 1990, ApJ, 364, 104
- [Jensen, Tonry & Luppino 1998] Jensen J. B., Tonry J. L., Luppino G. A., 1998, ApJ, 505, 111
- [Jørgensen 1997] Jørgensen I., 1997, MNRAS, 288, 161
- [Jørgensen 1999] Jørgensen I., 1999, MNRAS, 306, 607
- [Jones & Worthey 1995] Jones L. A., Worthey G., 1995, ApJL, 446, 31
- [Kauffmann 1996] Kauffmann G., 1996, MNRAS, 281, 475
- [Kodama & Arimoto 1997] Kodama T., Arimoto N., 1997, AA, 320, 41
- [Kuntschner 1998] Kuntschner H., 1998, PhD thesis, University of Durham, Durham
- [Kuntschner & Davies 1998] Kuntschner H., Davies R. L., 1998, MNRAS, 295, L29
- [Lake et al. 1998] Lake G., Katz N., Moore B., 1998, ApJ, 495, 152
- [Longhetti et al. 1998] Longhetti M., Rampazzo R., Bressan A., Chiosi C., 1998, AAS, 130, 251
- [Mackie & Fabbiano 1998] Mackie G., Fabbiano G., 1998, AJ, 115, 514
- [Maraston et al. 1999] Maraston C., Greggio L., Thomas D., 2000, Ap&SS, submitted
- [McElroy 1995] McElroy D. B., 1995, AJS, 100, 105
- [McWilliam 1997] McWilliam A., 1997, ARAA, 35, 503
- [Mehlert 1998] Mehlert D., 1998, PhD thesis, Ludwig - Maximilian - Universiät, München
- [Moore et al. 1998] Moore B., Lake G., Katz N., 1998, ApJ, 495, 139
- [O’Connell 1976] O’Connell R. W., 1976, ApJ, 206, 370
- [Oke 1974] Oke J. B., 1974, ApJS, 27, 210
- [Oke 1990] Oke J. B., 1990, AJ, 99, 1621
- [Osterbrock 1989] Osterbrock D. E., 1989, “Astrophysics of Gaseous Nebula and Active Galactic Nuclei”, University Science Books, Mill Valley, CA
- [Peletier 1989] Peletier R. F., 1989, PhD thesis, University of Groningen, Groningen
- [Peletier 2000] Peletier R. F., 2000, in Beckman J. E. and Mahoney T. J., eds, ASP Conf. Ser. Vol ??, The Evolution of Galaxies on Cosmological Timescales. Astron. Soc. Pac., San Francisco, p. ???
- [Phillips et al. 1986] Phillips M. M., Jenkins C. R., Dopita M. A., Sadler E. M., Binette L., 1986, AJ, 91, 1062
- [Poggianti & Barbaro 1997] Poggianti B. M., Barbaro G., 1997, AA, 325, 1025
- [Rose 1994] Rose J. A., 1994, AJ, 107, 206
- [Salaris & Weiss 1998] Salaris M., Weiss A., 1998, AA, 335, 943
- [Sansom & Proctor 1998] Sansom A. E., Proctor R. N., 1998, MNRAS, 297, 953
- [Schweizer 1980] Schweizer F., 1980, ApJ, 237, 303
- [Schweizer 1981] Schweizer F., 1981, ApJ, 246, 722
- [Schweizer et al. 1989] Schweizer F., van Gorkom J. H., Seitzer P., 1989, ApJ, 338, 770
- [Tantalo, Chiosi & Bressan 1998] Tantalo R., Chiosi C., Bressan A., 1998, AA, 333, 419
- [Terlevich 1998] Terlevich A. I., 1998, PhD thesis, University of Durham, Durham
- [Terlevich et al. 1999] Terlevich A. I., Kuntschner H., Bower R. G., Caldwell N., Sharples R. M., 1999, MNRAS, 310, 445
- [Terlevich et al. 1981] Terlevich R., Davies R. L., Faber S. M., Burstein D., 1981, MNRAS, 196, 381
- [Thomas 1999] Thomas D., 1999, MNRAS, 306, 655
- [Thomas & Kauffmann 1999] Thomas D., Kauffmann G., 1999, in Hubeny I., Heap S., and Cornett R., eds, ASP Conf. Ser. Vol ??, Spectrophotometric dating of stars anf galaxies. Astron. Soc. Pac., San Francisco, p. ???
- [Trager et al. 1998] Trager S. C., Worthey G., Faber S. M., Burstein D., González J. J., 1998, ApJS, 116, 1
- [Tripicco & Bell 1995] Tripicco M. J., Bell R. A., 1995, AJ, 110, 3035
- [van Dokkum & Franx 1995] van Dokkum P. G., Franx M., 1995, AJ, 110, 2027
- [Vazdekis et al. 1996] Vazdekis A., Casuso E., Peletier R. F., Beckman J. E., 1996, ApJS, 106, 307 (V96)
- [Visvanathan & Sandage 1977] Visvanathan N., Sandage A., 1977, ApJ, 216, 214
- [Weiss, Peletier & Matteucci 1995] Weiss A., Peletier R. F., Matteucci F., 1995, AA, 296, 73
- [Worthey 1992] Worthey G., 1992, PhD thesis, University of California.
- [Worthey 1994] Worthey G., 1994, ApJS, 95, 107 (W94)
- [Worthey 1998] Worthey G., 1998, PASP, 110, 888
- [Worthey & Ottaviani 1997] Worthey G., Ottaviani D. L., 1997, ApJS, 111, 377 (WO97)
- [Worthey, Faber & González 1992] Worthey G., Faber S. M., González J. J., 1992, ApJ, 398, 69
- [Worthey et al. 1994] Worthey G., Faber S. M., González J. J., Burstein D., 1994, ApJS, 94, 687
- [Worthey, Trager & Faber 1995] Worthey G., Trager S. C., Faber S. M., 1995, in Buzzoni A., Renzini A., and Serrano A., eds, ASP Conf. Ser. Vol 86, Fresh views of elliptical galaxies. Astron. Soc. Pac., San Francisco, p. 203
- [Ziegler & Bender 1997] Ziegler B. L., Bender R., 1997, MNRAS, 291, 527