A \roHRI survey of bright nearby galaxies
Abstract
We use the extensive public archive of ROSAT High Resolution Imager (HRI) observations to carry out a statistical investigation of the X-ray properties of nearby galaxies. Specifically we focus on the sample of 486 bright () northern galaxies studied by Ho, Filippenko and Sargent (HFS) in the context of their exploration of the optical spectroscopic properties of nearby galactic nuclei. Over of HFS galaxies are encompassed in ROSAT HRI fields of reasonable (ks) exposure. The X-ray sources detected within the optical extent of each galaxy are categorised as either nuclear or non-nuclear depending on whether the source is positioned within or outside of a radius circle centred on the optical nucleus.
A nuclear X-ray source is detected in over 70% of the galaxies harbouring either a Seyfert or LINER nucleus compared to a detection rate of only in less active systems. The correlation of the H luminosity with nuclear X-ray luminosity previously observed in QSOs and bright Seyfert 1 galaxies appears to extend down into the regime of ultra-low luminosity (LX) active galactic nuclei (AGN). The inferred accretion rates for this sample of low-luminosity AGN are significantly sub-Eddington.
In total 142 non-nuclear sources were detected. In combination with published data for M31 this leads to a luminosity distribution (normalised to an optical blue luminosity of ) for the discrete X-ray source population in spiral galaxies of the form , where is the X-ray luminosity in units of . The implied LX/LB ratio is . The nature of the substantial number of “super-luminous” non-nuclear objects detected in the survey is discussed.
keywords:
galaxies:general - galaxies:active - X-rays:galaxies1 Introduction
The ROSAT public archive now includes over 4400 pointed observations carried out with the ROSAT High Resolution Imager (HRI) during the period June 1990 to December 1997. One obvious application of this extensive database is the investigation of the X-ray properties of particular classes of object, especially those which are available in large numbers as the result of detailed surveys carried out in other wavebands. This is the approach adopted in the present paper which focuses on the luminous discrete X-ray sources associated with nearby bright galaxies.
For this purpose we use the sample of 486 bright () predominantly northern () galaxies studied by Ho, Filippenko & Sargent (1995) in the context of their search for “dwarf” Seyfert nuclei in nearby galaxies. It turns out that, of the galaxies studied by Ho, Filippenko and Sargent (hereafter the HFS sample), over lie within the field of view of reasonably deep (ks exposure) ROSAT HRI observations. As part of their programme Ho, Filippenko & Sargent (1995, 1997a,b,c) have compiled a huge database of information pertaining to both the optical spectroscopic properties of the galaxy nuclei and the properties of the host galaxy. This comprehensive and coherent body of information provides an ideal resource for our present purpose.
The first detailed studies of the X-ray properties of nearby galaxies utilised the X-ray imaging and spectroscopic capabilities of the EINSTEIN Observatory (as summarised in the EINSTEIN results atlas published by Fabbiano, Kim & Trinchieri 1992 and more recently in the work of Burstein et al. 1997). The Einstein observations demonstrated that the X-ray emission from bright elliptical and lenticular galaxies is often dominated by their hot interstellar medium, whereas in normal spirals it is the integrated emission of evolved stellar sources, such as supernova remnants (SNRs) and X-ray binaries (XRBs) which is generally most important (see Fabbiano 1989 for a review). EINSTEIN studies also established that, barring the presence of a luminous active galactic nucleus (AGN), the X-ray luminosity exhibited by normal galaxies is typically in the range . ROSAT observations have now added considerably to this picture. Specifically the high sensitivity, soft bandpass, modest spectral resolution and spatial resolution of the ROSAT X-ray telescope/position sensitive proportional counter (PSPC) combination has greatly extended our knowledge of diffuse K thermal emission in galaxies and has confirmed the ubiquity of such emission not only in early type and starburst galaxies but also as a significant component in normal spirals (e.g. Read, Ponman & Strickland 1997). Both ROSAT PSPC and HRI observations have also furthered our knowledge of the resolved point X-ray source population in nearby galaxies, for example with the detection of hundreds of such sources in M31 (Primini et al. 1993; Supper et al. 1997).
Although the ROSAT PSPC provided somewhat more sensitivity than the ROSAT HRI, the advantage of using data from the latter instrument is that, by and large, it is possible to focus the investigation on a single theme, namely the resolved discrete X-ray sources associated with nearby galaxies. Moreover the high spatial resolution afforded by the ROSAT HRI (FWHM ) is particularly relevant when attempting to distinguish the emission of putative low-luminosity AGN from other luminous source populations in galaxies. The remainder of this paper is ordered as follows. In section 2 we describe the available database of HRI observations, the possible impact of selection effects in the X-ray data and the method used to detect point X-ray sources in each HRI field. Next, in section 3, we carry out a preliminary analysis of the X-ray source sample, distinguishing between the “nuclear” and “non-nuclear” source populations. We also estimate the likely level of contamination by foreground stars and background QSOs. Section 4 then investigates the incidence of luminous nuclear X-ray sources in galaxies with nuclei of different optical spectroscopic type. Section 5 goes on to consider the X-ray luminosity distribution of the non-nuclear source population and the nature of the substantial subset of “super-luminous” sources. Finally in section 6 we provide a brief summary of our findings.
2 The X-ray database
The relevant subset of ROSAT HRI pointed observations was identified by cross-correlating the ROSPUBLIC database (circa July 1998) available from the Leicester Data Archive Service (LEDAS) with the full list of HFS galaxy (i.e. optical nuclear) positions. All HRI fields which encompassed the HFS galaxy position within of the pointing position and had an exposure of at least 10 ks were initially accepted. This process led to a set of 148 HRI observations of 106 HFS galaxies (with many of the galaxies having been observed more than once). However, a number of these observations were unsuitable for our purposes. The two dominant Local Group members, NGC 224 (M 31) and NGC 598 (M 33), were not included as their full angular extent cannot be imaged in a single HRI observation. The HRI observations of NGC 1275 and NGC 4478/4486 were not used since these galaxies lie at the centre of galaxy clusters (Perseus and Virgo respectively) and the presence of a bright intra-cluster medium confuses the X-ray field and limits the point source sensitivity. Similarly to avoid the complication of the dominant hot interstellar medium in massive early type galaxies, ellipticals and lenticulars with were excluded, as was the bright starburst galaxy NGC 3034 (M82). Finally the galaxies NGC 1052 and 4594 were rejected as southern interlopers in the HFS sample. A total of 83 galaxies remained, covered by 111 HRI observations, representing roughly a sampling of the full HFS catalogue. Hereafter we refer to our HRI-observed subset of HFS galaxies as the XHFS sample.
The parent HFS sample is reasonably complete in statistical terms (see Ho, Filippenko & Sargent 1995) and can certainly be considered as representative of the nearby bright galaxy population. However, our XHFS sample is subject to additional selection biases arising both from the selection criteria noted above and from the fact that quite a high fraction of the galaxies (78%) were the actual target source of the HRI observation. Thus nearby galaxies, known to be X-ray bright on the basis of pre-ROSAT observations, will be well represented in the XHFS sample, as will established X-ray luminous categories of object such as Seyfert galaxies. Table 1 gives details of how the full HFS sample of galaxies are distributed by morphological type and nuclear properties and, for comparison, provides the same information for the XHFS subset. In terms of galaxy morphology, late-type spirals/irregular galaxies appear to be somewhat favoured. Also, as expected, a relatively high fraction of the Seyfert galaxies in the HFS sample were observed by the HRI (i.e. a fraction compared to a norm for all types of galaxy of ), although in numerical terms the excess coverage amounts to only about 6 objects. Despite these clear emphases in the XHFS sample, the different morphological types and nuclear classes are, nevertheless, reasonable well sampled by the HRI database. We conclude that the XHFS sample is representative of the range of galaxies that occupy the nearby Universe (except for giant ellipticals and lenticulars) although possibly subject to a bias towards high X-ray luminosity systems.
| Galaxy Morphology | Type of Nucleus | |||||||||
|---|---|---|---|---|---|---|---|---|---|---|
| Hubble type | Number of Galaxies | Classification | Number of Galaxies | |||||||
| HFS | XHFS | Coverage | HFS | XHFS | Coverage | |||||
| E | -6 -4 | 57 | 9 | 0.16 | Seyferts | 52 | 15 | 0.29 | ||
| SO | -3 -1 | 88 | 10 | 0.11 | LINERs | 159 | 26 | 0.16 | ||
| SO/a - Sab | 0 2 | 77 | 15 | 0.19 | (pure | 94 | 15 | 0.16) | ||
| Sb - Sbc | 3 4 | 103 | 18 | 0.17 | (transition | 65 | 11 | 0.17) | ||
| Sc - Scd | 5 6 | 109 | 16 | 0.15 | H II | 206 | 32 | 0.16 | ||
| Sd and later | 7 99 | 52 | 15 | 0.29 | NoEL | 69 | 10 | 0.14 | ||
| Total | 486 | 83 | 0.17 | Total | 486 | 83 | 0.17 | |||
The individual galaxies contained within the XHFS sample are listed in Table 2, together with brief details relating to the ROSAT HRI observations and the galaxy properties.
| Galaxy | Obs | ROSAT data | Exposure | Hubble | Nuclear | Total | Nuclear | ||
|---|---|---|---|---|---|---|---|---|---|
| N | (s) | (Mpc) | () | type, | class | XRS | XRS? | ||
| IC 10 | A | rh600902n00 | 32678 | 1.3 | 48.1 | 10.0 | H | 1 | |
| B | rh600902a01 | 38564 | |||||||
| NGC 147 | rh400744n00 | 14745 | 0.7 | 10.5 | -5.0 | - | |||
| NGC 185 | rh400743n00 | 21070 | 0.7 | 11.0 | -5.0 | S2 | 1 | ||
| NGC 205 | rh600816n00 | 28145 | 0.7 | 6.7 | -5.0 | 2 | |||
| NGC 221 | rh600600n00 | 12658 | 0.7 | 6.5 | -6.0 | 2 | y | ||
| NGC 404 | rh703894n00 | 23874 | 2.4 | 5.1 | -3.0 | L2 | 1 | y | |
| NGC 520 | A | rh600628n00 | 13454 | 27.8 | 3.3 | 99.0 | H | - | |
| B | rh600628a01 | 18538 | |||||||
| NGC 891 | rh600690n00 | 98118 | 9.6 | 6.8 | 3.0 | H | 5 | ||
| NGC 1058 | rh500450n00 | 60796 | 9.1 | 5.6 | 5.0 | S2 | - | ||
| IC 342 | rh600022n00 | 19147 | 3.0 | 30.3 | 6.0 | H | 7 | y | |
| NGC 1560 | rh702727n00 | 17501 | 3.0 | 11.4 | 7.0 | H | - | ||
| NGC 1569 | rh600157n00 | 11350 | 1.6 | 24.2 | 10.0 | H | 1 | y | |
| NGC 1961 | rh600499n00 | 82704 | 53.1 | 8.5 | 5.0 | L2 | 1 | y | |
| NGC 2276 | A | rh600498n00 | 52235 | 36.8 | 6.0 | 5.0 | H | 1 | |
| B | rh600498a01 | 21731 | |||||||
| NGC 2366 | rh702732n00 | 31823 | 2.9 | 3.9 | 10.0 | - | |||
| NGC 2403 | rh600767n00 | 26544 | 4.2 | 4.1 | 6.0 | H | 4 | ||
| NGC 2775 | A | rh500385n00 | 10892 | 17.0 | 4.3 | 2.0 | - | ||
| B | rh600826a01 | 48468 | |||||||
| NGC 2782 | rh700462n00 | 21715 | 37.3 | 1.8 | 1.0 | H | 2 | y | |
| NGC 2903 | rh600602n00 | 13619 | 6.3 | 3.4 | 4.0 | H | 3 | y | |
| NGC 2976 | A | rh600471n00 | 18801 | 2.1 | 4.5 | 5.0 | H | 1 | |
| B | rh600759n00 | 26524 | |||||||
| C | rh600759a01 | 23443 | |||||||
| NGC 3031 | A | rh600247n00 | 26558 | 1.4 | 4.3 | 2.0 | S1.5 | 20 | y |
| B | rh600247a01 | 21263 | |||||||
| C | rh600739n00 | 20080 | |||||||
| D | rh600740n00 | 19163 | |||||||
| E | rh600881n00 | 14934 | |||||||
| F | rh600882n00 | 18508 | |||||||
| G | rh601001n00 | 19420 | |||||||
| NGC 3079 | A | rh700100n00 | 21005 | 20.4 | 0.9 | 7.0 | S2 | 1 | y |
| B | rh600411n00 | 20676 | |||||||
| C | rh700889n00 | 18677 | |||||||
| D | rh701294n00 | 25330 | |||||||
| E | rh702425n00 | 25077 | |||||||
| NGC 3073 | rh600411n00 | 20676 | 19.3 | 0.9 | -2.5 | H | - | ||
| NGC 3147 | A | rh600614n00 | 23438 | 40.9 | 3.2 | 4.0 | S2 | 1 | y |
| B | rh600721n00 | 22582 | |||||||
| C | rh600721a01 | 26308 | |||||||
| NGC 3185 | rh800844n00 | 29237 | 21.3 | 2.2 | 1.0 | S2: | - | ||
| NGC 3190 | rh800844n00 | 29237 | 22.4 | 2.1 | 1.0 | L2 | 1 | y | |
| NGC 3193 | rh800844n00 | 29237 | 23.2 | 2.1 | -5.0 | L2: | - | ||
| NGC 3226 | rh701299n00 | 30264 | 23.4 | 2.3 | -5.0 | L1.9 | 1 | y | |
| NGC 3227 | rh701299n00 | 30264 | 20.6 | 2.3 | 1.0 | S1.5 | 1 | y | |
| NGC 3294 | rh500389n00 | 11288 | 26.7 | 1.6 | 5.0 | H | - | ||
| NGC 3310 | rh600685a01 | 41842 | 18.7 | 1.1 | 4.0 | H | 2 | ||
| NGC 3377 | rh600830n00 | 34272 | 8.1 | 2.9 | -5.0 | 2 | y | ||
| NGC 3379 | rh600829n00 | 24560 | 8.1 | 2.9 | -5.0 | L2/T2:: | 1 | y | |
| NGC 3384 | rh600829n00 | 24560 | 8.1 | 2.9 | -3.0 | - | |||
| NGC 3389 | rh600829n00 | 24560 | 22.5 | 2.8 | 5.0 | H | - | ||
| NGC 3395 | rh600771n00 | 24925 | 27.4 | 1.8 | 6.0 | H | 1 | ||
| NGC 3628 | rh700009n00 | 13574 | 7.7 | 2.0 | 3.0 | T2 | 2 | ||
| NGC 3998 | rh600430n00 | 13622 | 21.6 | 1.2 | -2.0 | L1.9 | 2 | y | |
| NGC 4051 | rh701298n00 | 10579 | 17.0 | 1.3 | 4.0 | S1.2 | 1 | y | |
| NGC 4088 | rh500391n00 | 10017 | 17.0 | 2.0 | 4.0 | H | 1 | y | |
| NGC 4150 | rh600762a01 | 10457 | 9.7 | 1.6 | -2.0 | T2 | 1 | y |
| Galaxy | Obs | ROSAT data | Exposure | Hubble | Nuclear | Total | Nuclear | ||
|---|---|---|---|---|---|---|---|---|---|
| N | (s) | (Mpc) | () | type | class | XRS | XRS? | ||
| NGC 4151 | A | rh701707n00 | 108216 | 20.3 | 2.1 | 2.0 | S1.5 | 3 | y |
| B | rh701989n00 | 103435 | |||||||
| NGC 4203 | rh600221n00 | 25447 | 9.7 | 1.3 | -3.0 | L1.9 | 1 | y | |
| NGC 4214 | rh600741n00 | 42584 | 3.5 | 1.7 | 10.0 | H | 1 | ||
| NGC 4235 | rh600412a01 | 19694 | 35.1 | 1.5 | 1.0 | S1.2 | 1 | y | |
| NGC 4258 | A | rh701008n00 | 27556 | 6.8 | 1.4 | 4.0 | S1.9 | 8 | y |
| B | rh600599a01 | 25562 | |||||||
| NGC 4291 | A | rh600441n00 | 12405 | 29.4 | 3.2 | -5.0 | 1 | y | |
| B | rh600834n00 | 35363 | |||||||
| NGC 4321 | rh600731n00 | 42797 | 16.8 | 2.4 | 4.0 | T2 | 4 | y | |
| NGC 4388 | rh700192n00 | 11274 | 16.8 | 2.7 | 3.0 | S1.9 | 1 | y | |
| NGC 4395 | rh702725n00 | 11353 | 3.6 | 1.3 | 9.0 | S1.8 | 1 | ||
| NGC 4435 | rh600608n00 | 21651 | 16.8 | 2.7 | -2.0 | T2/H | 1 | y | |
| NGC 4438 | rh600608n00 | 21651 | 16.8 | 2.7 | 0.0 | L1.9 | 1 | y | |
| NGC 4449 | A | rh600743n00 | 15373 | 3.0 | 1.3 | 10.0 | H | 7 | y |
| B | rh600865n00 | 25395 | |||||||
| C | rh600865a01 | 18343 | |||||||
| NGC 4470 | rh600216a01 | 27367 | 31.4 | 1.6 | 1.0 | H | - | ||
| NGC 4485 | A | rh600855n00 | 27048 | 9.3 | 1.8 | 10.0 | H | 1 | y |
| B | rh600855a01 | 24829 | |||||||
| NGC 4490 | A | rh600855n00 | 27048 | 7.8 | 1.8 | 7.0 | H | 4 | y |
| B | rh600855a01 | 24829 | |||||||
| NGC 4527 | rh500390n00 | 10355 | 13.5 | 1.9 | 4.0 | T2 | - | ||
| NGC 4559 | rh600861n00 | 53812 | 9.7 | 1.5 | 6.0 | H | 5 | y | |
| NGC 4569 | rh600603a01 | 21858 | 16.8 | 2.5 | 2.0 | T2 | 1 | y | |
| NGC 4631 | A | rh600193a01 | 14287 | 6.9 | 1.3 | 7.0 | H | 2 | |
| B | rh600193a02 | 12041 | |||||||
| NGC 4638 | A | rh600480a01 | 11915 | 16.8 | 2.4 | -3.0 | - | ||
| B | rh600620a01 | 19923 | |||||||
| NGC 4647 | A | rh600480a01 | 11915 | 16.8 | 2.4 | 5.0 | H | - | |
| B | rh600620a01 | 19923 | |||||||
| NGC 4651 | rh800719n00 | 25396 | 16.8 | 2.0 | 5.0 | L2 | 1 | y | |
| NGC 4656 | rh600605n00 | 27668 | 7.2 | 1.3 | 9.0 | H | 1 | ||
| NGC 4736 | A | rh600678n00 | 112910 | 4.3 | 1.4 | 2.0 | L2 | 5 | y |
| B | rh600769n00 | 27292 | |||||||
| NGC 4772 | rh500397n00 | 12120 | 16.3 | 1.8 | 1.0 | L1.9 | - | ||
| NGC 4826 | rh600715n00 | 10150 | 4.1 | 2.6 | 2.0 | T2 | 1 | y | |
| NGC 5005 | rh701711n00 | 26742 | 21.3 | 1.1 | 4.0 | L1.9 | 1 | y | |
| NGC 5055 | rh600742n00 | 12343 | 7.2 | 1.4 | 4.0 | T2 | 9 | y | |
| NGC 5194 | rh600601n00 | 36323 | 7.7 | 1.5 | 4.0 | S2 | 9 | y | |
| NGC 5195 | rh600601n00 | 36323 | 9.3 | 1.5 | 90.0 | L2: | 1 | ||
| NGC 5204 | A | rh702723n00 | 14852 | 4.8 | 1.5 | 9.0 | H | 1 | y |
| B | rh702723a01 | 13675 | |||||||
| NGC 5273 | rh701006n00 | 10767 | 21.3 | 0.9 | -2.0 | S1.5 | 1 | y | |
| NGC 5354 | rh800743n00 | 22761 | 32.8 | 1.0 | -2.0 | T2/L2: | - | ||
| NGC 5457 | A | rh600092n00 | 18588 | 5.4 | 1.2 | 6.0 | H | 27 | |
| B | rh600383n00 | 32624 | |||||||
| C | rh600820n00 | 108850 | |||||||
| D | rh600820a01 | 68872 | |||||||
| NGC 5775 | rh600964n00 | 35305 | 26.7 | 3.3 | 5.0 | H | - | ||
| NGC 5850 | A | rh600478n00 | 22796 | 28.5 | 4.2 | 3.0 | L2 | - | |
| B | rh600478a01 | 16763 | |||||||
| NGC 5905 | rh703855n00 | 76218 | 44.4 | 1.4 | 3.0 | H | 1 | y | |
| NGC 6217 | A | rh141910n00 | 15991 | 23.9 | 4.1 | 4.0 | H | 1 | y |
| B | rh141913n00 | 14669 | |||||||
| C | rh141921n00 | 13572 | |||||||
| D | rh141926n00 | 11804 | |||||||
| E | rh141928n00 | 11630 | |||||||
| NGC 6503 | rh600618n00 | 14787 | 6.1 | 4.0 | 6.0 | T2/S2: | 1 | ||
| NGC 6654 | A | rh600124a00 | 36803 | 29.5 | 5.4 | 0.0 | - | ||
| B | rh600124a01 | 18270 | |||||||
| NGC 6946 | A | rh600501n00 | 60305 | 5.5 | 20.2 | 6.0 | H | 13 | y |
| B | rh600718n00 | 21723 | |||||||
| NGC 7331 | rh702074n00 | 30481 | 14.3 | 7.7 | 3.0 | T2 | 1 | y |
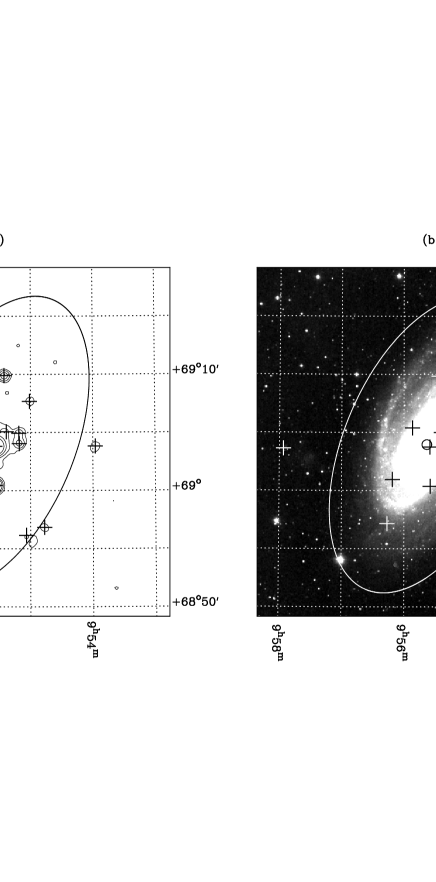
The point source searching was conducted using the PSS algorithm, which is part of the STARLINK ASTERIX software package (Allen 1995). A circular area of 15′ radius about the field centre was searched in each case and all discrete X-ray sources with a detection significance of above a smoothed background level were recorded. The source positions were then plotted on the X-ray image and a visual “quality” check of each detected source was carried out. Sources were flagged as “on-galaxy” or “off-galaxy” dependent upon whether they resided inside or outside of the optical extent of the galaxy. The optical extent was defined in terms of the D25 ellipse (i.e. the elliptical contour best corresponding to the 25 magnitude/arcsec2 blue isophote) using the major axis diameter and nuclear position from Ho, Filippenko & Sargent (1997a), and the position angle and axial ratio from the Third Reference Catalogue of Bright Galaxies (RC3; de Vaucouleurs et al. 1991). In this manner a total of 327 discrete X-ray sources were detected coincident with the galaxies in our sample. Figure 1 illustrates this process in the case of NGC 3031 (M81).
Since a considerable proportion (24/83) of our galaxies were observed on at least two separate occasions, many of these detections represented repeat observations of the same X-ray sources. We therefore compressed the source list to a “definitive” list of detections by considering all sources positionally coincident to within 15′′ in separate observations of the same galaxy, to be the same source (see §3.1)111We note that in correlating the multiple detections we only needed to apply an attitude correction to one field, namely NGC 4258 A, which required corrections of RA, Dec (calibrated by a bright off-axis source).. This led to a final set of 187 discrete X-ray sources, the catalogue of which is presented in Appendix A.
Visual inspection suggests the presence of diffuse X-ray flux in a small fraction of the HRI images considered above. Most notably there are five cases where a bright point-like X-ray source, positionally coincident with the optical nucleus of the galaxy, appears to be embedded in an extended, low surface brightness component. NGC 3031 in Figure 1(a) provides one such example, the others being NGC 4151, NGC 4258, NGC 4291 and NGC 4736. We have not specifically flagged extended emission in our analysis and, in fact, ignore its contribution to the X-ray luminosity of the XHFS galaxies, focussing our attention solely on individual discrete (point-like) X-ray sources associated with nearby galaxies. (In all cases any correction for the the extended luminosity detected by the HRI would be much less than a factor 2).
All fluxes (and hence luminosities) quoted in this paper are for the 0.1–2.4 keV ROSAT HRI band, corrected for the line-of-sight absorption of our Galaxy. The conversion from measured HRI count rate to unabsorbed flux was calculated for a specific spectral form, namely a power-law continuum with photon index . The absorption correction is, in most cases, small (less than a factor 2 upwards) since the galaxies in our sample are generally in regions of low Galactic column density ( ). The count rate to flux conversion factor is sensitive to the choice of spectral model, for example a change to a thermal bremsstrahlung form with keV leads to a reduction in the assigned fluxes.
3 Preliminary Analysis of the XHFS Sample
3.1 Nuclear versus non-nuclear source designation
As a first step in the analysis we have attempted to separate out those X-ray sources possibly associated with the nuclei of the XHFS galaxies from the other constituent X-ray source populations. The reason for this is that an active galactic nucleus (AGN) is known or suspected to be present in quite a number of the galaxies in our sample and, more often than not, is the dominant source of X-ray emission in the nuclear region and sometimes in the whole galaxy (examples include NGC 4736, Roberts, Warwick & Ohashi 1999; NGC 3031, Ishisaki et al. 1996; NGC 3147, Ptak et al. 1997). Since, as far as we know, galaxies contain at most one AGN located close to the mass centroid of the galaxy, then there is clearly some logic in differentiating between “nuclear” and “non-nuclear” sources.
In the present study the identification of a particular X-ray source with the nucleus of a galaxy is based solely on a positional coincidence criterion. In ROSAT HRI observations there is the potential for systematic pointing errors of up to (see Harris et al. 1998) in addition to statistical errors of up to (dependent on the source strength). For example, in the case of NGC 3079, we observe the position of one particular source (designated NGC 3079 X-1 in Appendix A) to shift by up to 15′′ in 5 separate observations. There is also some uncertainty in the position of the optical nucleus; Ho, Filippenko & Sargent (1995) only quote their nuclear positions to one second of time implying a potential error of up to . This would suggest that a reasonable criterion for designating an X-ray source as “nuclear” would be if it lies within of the optical nucleus. In fact the observations reveal a total of 40 X-ray sources with an offset from the optical nucleus of less than , with a further 5 sources lying in the 20 - 25′′ range. However, 4 out of these 5 sources have an X-ray luminosity in excess of the median value for all the galactic nuclei and, considering this along with the detection of some probable AGN out to from the optical nuclear position, we therefore set a very conservative limit of as a threshold radius (thereby avoiding any possible contamination of the non-nuclear sample by AGN). Hereafter we refer to any sources seen within this bound as “nuclear” X-ray sources and label those outside this region as “non-nuclear” X-ray sources.

The division of the XHFS sample into nuclear and non-nuclear X-ray sources is illustrated in Figure 2. One point that is apparent immediately from this figure is that relatively high luminosity (LX ) sources are not confined solely to the nuclear region, in fact such sources are seen at projected distances from the optical nucleus ranging from less than a few hundred pc (i.e. positional coincident with the nucleus in terms of the measurement errors) out to beyond 10 kpc. In a recent paper exploiting ROSAT HRI observations, Colbert & Mushotzky (1999), have suggested the possibility that some nearby spiral galaxies contain X-ray sources powered by accretion onto black holes with masses of typically . These authors invoke the existence of a black-hole population in this intermediate mass range (compared to the Galactic black-hole binaries with masses typically and luminous AGN with ) to explain why X-ray sources with luminosities of LX are occasionally observed in spiral galaxies with a significant positional offset from the optical nucleus. In fact Colbert & Mushotzky quote a mean offset of pc between the X-ray source position and the optical photometric center for the 21 galaxies with X-ray detections in their sample222A total of 11 out of the 39 galaxies studied by Colbert & Mushotzky (1999) overlap with our XHFS sample. In Figure 2 there is no real evidence for the more luminous sources to be grouped preferentially within a projected separation of 1 kpc but such an effect, if present, might well be smeared out by the positional errors. Colbert & Mushotzky (1999) concentrate on a set of galaxies with recessional velocity less than (i.e. a very nearby sample) and hence benefit from the better effective linear resolution.
We find that 45 galaxies out of 83 in the XHFS sample harbour a nuclear X-ray source. The corresponding statistic for the non-nuclear X-ray sources is that 34 of the XHFS galaxies contain at least one such source. There were no X-ray detections in 21 of the XHFS galaxies.
In Figure 3 (panels a & b) we present histograms of the observed luminosity distribution for the 187 sources in the XHFS sample separated into the non-nuclear and nuclear categories. Figure 3(b) also includes 95% upper limits on the X-ray luminosity of the nuclear emission for the 38 galaxies with no detected nuclear X-ray source (these upper limits are tabulated in Appendix B). Although the luminosity distributions for the two populations overlap, on average the detected nuclear X-ray sources are substantially more X-ray luminous than the non-nuclear sources (the median X-ray luminosity of the former being as opposed to for the latter).
It should be emphasized that the X-ray sources designated as nuclear are not necessarily all low-luminosity AGN. Indeed, since the range of X-ray luminosity exhibited by the non-nuclear sources shows a significant overlap with the nuclear sample, some contamination of the latter category by non-AGN looks inevitable. The problem of distinguishing very low-luminosity AGN from individual black hole X-ray binaries, groupings of Eddington-limited low-mass XRBs and recent X-ray luminous supernovae is, of course, well recognised (e.g. Dahlem, Heckman & Fabbiano 1995; Loewenstein et al. 1998; Lira et al. 1999). However the above argument does not preclude the possibility that many of the nuclear X-ray sources contained in the XHFS sample are putative low-luminosity AGN, particularly if the underlying population of super-massive black holes have a very wide range of masses and/or accretion rates (Colbert & Mushotzky 1999).

3.2 Contamination of the XHFS sample by background QSOs and/or foreground stars
A potential source of uncertainty is the detection of either foreground sources or background sources which lie, by chance, within the D25 ellipse of one of the XHFS galaxies. Such contamination is likely to be much more of a problem for the non-nuclear category since, in this case, the total sky area surveyed amounts to almost exactly one square degree (with the area within the nuclear error circles accounting for only of this figure). At the flux limits reached in the present survey (see below), most of the contamination is due to late-type stars in our own Galaxy and distant QSOs (the latter representing the dominant X-ray source population in medium-deep ROSAT images).
In Figure 4(a) we show the distribution of non-nuclear source detections as a function of the observed X-ray flux. We have carried out a quantitative investigation of the contamination of the non-nuclear population expected at different flux levels using two independent approaches. Firstly we estimated the level of contamination in each HRI field using the detections outside of the D25 ellipse of the target galaxy but within the nominal HRI field of view as a control set. After applying an appropriate field by field scaling of the number of off-galaxy detections333The weighting factor was simply the ratio of the on-galaxy to off-galaxy area for the field; here and elsewhere in this paper we neglect vignetting and other effects which reduce the point-source sensitivity at the edge of the HRI field of view compared to that at the centre by about ., we obtain an estimate of the number of false associations expected as a function of flux as illustrated in Figure 4(b). Comparison of the observed distribution with this estimate demonstrates that the contamination of the non-nuclear XHFS sample is at a level of no more than about . As an additional check we also performed a calculation based on published source counts for the soft X-ray band. First the X-ray source detection limit for each field was estimated and the integrated sky area encompassed in the XHFS (within the D25 ellipses of the XHFS galaxies) determined as a function of the limiting X-ray flux - see Figure 4(c). The differential form of the log N - log S relation derived by Hasinger et al. (1993), which includes contributions from both QSOs and Galactic stars, was then folded through this coverage curve to give the predicted number of sources shown in Figure 4(d). The contamination level determined from the second method is , very comparable, within the statistics, to that obtained from the first.
There are two caveats relating to this comparison of observed and predicted source numbers. The effect of absorption by cool gas and dust contained within the galaxy disks will help suppress the detection rate of background QSOs, implying that both of the estimates above actually give upper limit predictions. A second possibility is that the measured off-galaxy detection rate may be biased upwards by sources actually associated with the target galaxy but lying outside its D25 contour. This latter influence could give rise to the slight differences between the two predicted distributions in Figure 4, but clearly the evidence for any such effects is very marginal. In summary we can be confident that the great majority (in excess of 85%) of the non-nuclear X-ray sources in our sample are associated with HFS galaxies. We also confirm that there is essentially no contamination of the nuclear source sample, since we expect a total of sources coincident by chance compared to the 45 sources we detect.
As a final point we note that if we transpose the distributions in Figure 4(b,d) into luminosity space using the appropriate galaxy distances (on a field by field basis), then the distribution in luminosity (of the contamination) is very comparable to that exhibited by the non-nuclear sources in Figure 3(a). We conclude that the high luminosity tail of non-nuclear sources is not due to contamination by foreground or background sources but represents a real super-luminous population associated with nearby galaxies.

4 Properties of the nuclear sample
The search for “dwarf” Seyfert nuclei carried out by Ho, Filippenko & Sargent (1995, 1997a,b,c) has resulted in a consistent and complete classification of the optical emission line properties of each galactic nucleus in the HFS galaxy sample. They found that 11% of nearby galaxies harbour a Seyfert-like nucleus, 33% host a Low Ionisation Nuclear Emission-line Region (LINER) and 42% have a nucleus with an emission line spectrum characteristic of H II regions. The LINERs may be further split into the subsets of “pure” LINERs (19% of the HFS sample) and “transition” LINERs (14%), the difference being that the transition objects display a blend of LINER and H II spectra. Only 14% of galaxies appear to have nuclear spectra devoid of optical emission lines (which are referred to here as “NoEL” nuclei).
As noted earlier (see Table 1) the XHFS sample encompasses the full range of nuclear spectral classification, thus allowing us to consider the X-ray properties, specifically the soft X-ray luminosities, of the different types of nucleus. Figure 3 (panels c & d) compares the X-ray luminosity distribution for those galaxies with Seyfert or LINER nuclei to those with H II spectra or no emission lines. Table 3 gives further details of the mean nuclear X-ray luminosity and detection rate for various sub-groupings in the XHFS sample.444We have calculated the mean value of log LXand the associated error using the Kaplan-Meier estimator procedure in the the ASURV software package (Rev 1.2), which takes account of both the actual measurements and upper-limits (see Feigelson & Nelson 1985). Prior to applying the estimator a few upper-limits below log LX were reset to this minimum value. In some cases the lowest value in the distribution was an upper-limit resulting in a (probably modest) upward biasing of the mean.
| Sample | No. of | Mean log LX | Detection rate |
|---|---|---|---|
| Objects | () | (%) | |
| All nuclei | 83 | 54 | |
| Seyferts & LINERs | 41 | 71 | |
| HII & NoEL | 42 | 42 | |
| Seyferts | 15 | 73 | |
| LINERs | 26 | 69 | |
| (pure | 15 | 73) | |
| (transition | 11 | 64) | |
| H II | 32 | 41 | |
| NoEL | 10 | 30 | |
| Broad Line AGN | 15 | 87 | |
| Narrow Line AGN | 26 | 62 |
For the overall sample the average X-ray luminosity is . However, a marked difference is seen between those nuclei probably hosting a low-luminosity AGN (the Seyfert and LINER nuclei) and those showing no evidence for high-ionization emission lines (the H II and NoEL galaxies). Essentially, we observe the former to be considerably more luminous than the latter. This manifests itself as both a higher X-ray luminosity (by a factor ) and a higher detection rate of nuclear sources. A formal comparison of the two distribution shown in Figure 3 (panels c & d) using the two-sample tests in the ASURV package confirms that the distributions are different at a significance level greater than 99.9%.
Within the putative AGN grouping, there is little to distinguish Seyfert from LINER nuclei in terms of either their average luminosity, detection rate or the luminosity spread. When the LINERs are divided into “pure” and “transition” types, the former are seen to bear a slightly closer resemblance to the Seyferts, in terms of their X-ray characteristics, than the latter (although the differences are at a marginal significance level). The galaxies with broad emission lines (the “type 1” AGN), discussed by Ho, Filippenko & Sargent (1997b), are clearly the most luminous group of objects in the XHFS sample having an X-ray luminosity at least an order of magnitude larger than the narrow-emission line (“type 2”) sources and a higher detection rate. Nevertheless the average luminosity of the type 2 objects is still well in excess of that of the H II and NoEL galaxies (formally the log LXdistributions are different at a significance level of 98%). We conclude that X-ray emission associated with an underlying low-luminosity AGN is seen in almost all of the nearby galactic nuclei classified as type 1 Seyferts or LINERs and in a reasonable fraction () of those nuclei classified as type 2 objects. Since obscuration in the line of sight to the nucleus in type 2 objects will strongly suppress the 0.1–2.4 keV flux if the column density is in excess of , it may be that in many of the type 2 nuclei we actually observe scattered X-ray flux (or some other nuclear related extended component) rather than the direct continuum emission of the nucleus.
The observed distribution of nuclear luminosity in the galaxies categorised as H II or NoEL objects overlaps substantially with that measured for non-nuclear sources in the XHFS sample (Figure 3(a) & (d)). Thus it is quite plausible that in many of the H II and NoEL galaxies with nuclear detections we are, in fact, observing a component of the discrete X-ray source population of the galaxy rather than the presence of an underlying, optically faint, AGN.

The properties of the putative AGN in the XHFS sample may be further investigated by comparing the observed X-ray luminosity with other indicators of nuclear activity. We examine the relationship between the X-ray and H luminosity (both narrow and broad components) for the Seyferts and LINERs in Figure 5. The H luminosities (including lower limits on the narrow component, LHα,n, from measurements made in non-photometric conditions) were taken from Ho, Filippenko & Sargent (1997a,b); where no measurement of the broad component, LHα,b, is available we use the lower limit on LHα,n and the fractional contribution of broad H to the total H emission to derive a lower limit on LHα,b.
A correlation between the total H luminosity and soft X-ray luminosity of high luminosity QSOs and Seyfert I galaxies is well established, and has recently been shown to extend down to LX by Koratkar et al. (1995). They find that type 1 AGN have a typical LX/LHα ratio in the range 1 - 100, with a mean of . These results broadly agree with Figure 5, where an apparently similar range of ratios is seen to extend down to . Koratkar et al. (1995) show their correlation is present in flux as well in luminosity space. When Figure 5 is replotted in this regime, there is little evidence of a correlation, but this is probably due to the restricted flux range, the degree of scatter being similar to that seen by Koratkar et al. The factors which may induce scatter in the X-ray luminosity at a given H output include soft X-ray absorption, nuclear flux variability and contamination by the non-AGN X-ray source population of the galaxies (which is clearly a particular problem in the low-luminosity range). The present work demonstrates that the LX/LHα relationship may extend from LX down to LX , two magnitudes lower than previously seen and implies a significant commonality in the physical processes that drive low- and high-luminosity AGN.
Dynamical studies of the centres of nearby galaxies have revealed the presence of Massive Dark Objects (MDOs) in the nuclei of number of galaxies (Kormendy & Richstone 1995). The demographics of this population show that a reasonably tight relationship exists between the masses of the MDOs and the mass of the galactic bulge hosting them ( decades standard deviation in the ratio; Magorrian et al. 1998). Since the mass-to-light relationship of these bulges is also known then a mass of the MDO may be inferred from the optical blue bulge luminosity, Lbulge, of a galaxy. In the following analysis we make the assumption that these MDOs are most likely supermassive black holes resident in the nucleus of the galaxies; this assumption, and caveats relating to the observations of MDOs, are discussed by Lawrence (1999, and references therein).
Applying the Magorrian et al. (1998) relation to the XHFS sample, we can obtain an estimate of the underlying black hole mass, MBH, and hence the fraction of Eddington luminosity at which any particular XHFS nucleus is radiating. Ho, Filippenko & Sargent (1997a) provide an estimate of the bulge magnitude of each galaxy in their sample, formulated from an average, type-dependent relation of the form discussed by Whittle (1992). By definition all light from ellipticals is assumed to come from the bulge (since they have no disk); the correction to bulge luminosity from that of the full galaxy then ranges, for example, from 1.02 mag for Sa galaxies to 2.54 mag for Sc galaxies. Figure 6 shows a plot of the nuclear LX versus Lbulge for the Seyferts and LINERs in the XHFS sample. The diagonal lines calibrate the measurements in terms of the fraction of the Eddington luminosity, based on the MBH to Lbulge relation from Magorrian et al. Here we assume that the X-ray emission in the ROSAT 0.1–2.4 keV band amounts to 15% of the bolometric luminosity of the AGN, which we estimate from the spectral energy distributions of low-luminosity AGN (specifically those in spirals) presented by Ho (1999). The AGN in the XHFS sample would all appear to be radiating at severely sub-Eddington luminosities, the highest rate being of the Eddington value, but with a more typical figure.
There are, of course, several factors that could induce a bias in these measurements. Firstly, considerable absorption in the ROSAT band could easily suppress the observed luminosity by a factor ; for example, in classical type 2 sources in which the direct line of sight to the nucleus is completely blocked, a scattered nuclear flux amounting to of the direct nuclear continuum is often observed (e.g. Turner et al. 1997). However, many of the sources with extremely low rates are type 1 nuclei, which in general do not exhibit substantial soft X-ray absorption due to cold gas intrinsic to the source (e.g. George et al. 1998). Another potential problem is that the mass estimates (in the range ) for the underlying supermassive black holes powering these relatively low-luminosity Seyfert and LINERs may be unrealistic. The Magorrian et al. (1998) sample is comprised predominantly of giant elliptical and lenticular galaxies (a population which is specifically excluded from the current work, see §2). Wandel (1999) has pointed out the potential bias in the dynamical measurement towards galaxies harbouring particularly massive black holes. In fact, Wandel (1999) presents results showing that black hole masses in Seyfert nuclei (inferred via a reverberation mapping/virial mass technique) are generally smaller by a factor than those obtained using the Magorrian et al. relation. Plausibly this downward scaling could be even greater for galaxies with low-luminosity nuclei. This is supported by Salucci et al. (1999), who use kinematic observations of the innermost regions of spiral galaxies to demonstrate that late-type spirals (types Sb - Im) may contain under-massive MDOs, for a given bulge mass, when compared to ellipticals and early-type spirals.
However, even if we apply a rather arbitrary upward scaling to our derived Eddington fractions of, say, to account for the above uncertainties, we are still left with the bulk of the XHFS AGN sample operating in a substantially sub-Eddington regime, implying accretion rates firmly in the range theorised for advection-dominated accretion flows (ADAFs; Narayan & Yi 1995; Fabian & Rees 1995). Colbert & Mushotzky (1999) discuss the ADAF scenario and an alternative approach, namely that low-luminosity AGN found in nearby galaxies might be powered by a new class of intermediate mass black holes (), accreting in their soft state. It should be noted, though, that this latter hypothesis does not hold in the case of nearby galaxies where an MDO mass is known, for example NGC 4594 (Fabbiano & Juda 1997). Yet a further variation, suggested by Siemiginowska et al. (1996), is that ionisation instability in the accretion disks around super-massive black holes leads to long periods of quiescence, during which accretion occurs at a severely sub-Eddington rate; in this scenario LLAGNs might correspond to systems exhibiting an extended “low state”.

5 Properties of the non-nuclear sample

Non-nuclear X-ray sources have been detected in 34 out of the 83 galaxies in the XHFS sample. These sources range in luminosity from to in the 0.1–2.4 keV band as illustrated in Figure 3(a). Here we investigate the true form of the high luminosity end of the X-ray luminosity distribution for discrete sources in galaxies (excluding low-luminosity AGN). Specifically we focus on discrete X-ray sources detected in spiral galaxies of type SOa to Scd (), which provide the bulk of the non-nuclear sources in our sample (120 out of 142 sources).
Since the effective sensitivity in terms of LX varies from galaxy to galaxy, it is necessary to apply a correction for the varying survey coverage. For each ROSAT HRI field we transposed the threshold flux for point source detection (as calculated in §3.2) to luminosity using the distance of the XHFS target galaxy and then constructed a cumulative coverage curve as a function of increasing (threshold) X-ray luminosity. To allow for the considerable spread in absolute magnitude across the 49 galaxies which comprise the XHFS spiral sample (this includes the spirals with no non-nuclear source detections), each galaxy was given a weight proportional to its optical B-band luminosity; specifically we use a weight factor equal to LB in units of . The resulting coverage curve is shown in Figure 7(a). The “true” distribution in luminosity was calculated by binning the observed source sample in terms of LX (in half-decade logarithmic steps) and then correcting the number of sources in each bin, , for the effective coverage. The result was the differential luminosity distribution shown in Figure 7(b) which, in effect, represents an average per of optical blue luminosity. The error bars are simply estimates scaled by the coverage correction.
The XHFS measurements best constrain the discrete X-ray source population of spiral galaxies in the X-ray luminosity range . However, information is available for X-ray sources at least two orders of magnitude less luminous, from the extensive surveys of the local group galaxies carried out by ROSAT . Here we have used the results on M31 from the ROSAT PSPC survey reported by Supper et al. (1997) to extend the measurements in Figure 7(b) down to . For this purpose we have used the log N- log S curves for X-ray sources detected in disk areas II, III and IV of M31 (see Figure 14, Supper et al. 1997). We also use the conversion 1 PSPC count s (0.1–2.4 keV) and scale the M31 source numbers to an optical luminosity L. Note that the M31 measurements in the lowest bin are shown as a lower-limit since the correction for varying sensitivity across the field of view in the PSPC observations is a significant (and somewhat uncertain) correction at this level of X-ray luminosity.
The measurements in Figure 7(b) indicate a steep, near power-law form for the X-ray luminosity distribution of discrete sources in spiral galaxies. Taking just the XHFS data points and using a simple minimum fitting technique, we find that the best fitting straight line in log N(LX) - log LX space has a power-law slope of . However, when the XHFS data are combined with the M31 measurements a somewhat flatter slope of is obtained. These two best-fitting power-law forms are illustrated in Figure 7(b). The flatter relation appears to be broadly consistent, within the errors, with all the available data although, in this case, there is the hint of a turn down above LX . Unfortunately the data quality are such that we cannot rule out the possibility that a break in the power-law occurs at even lower luminosity (e.g. at ).
The above analysis is based on the X-ray sources detected within the confines of the optical disc of the sample of spiral galaxies but excludes the sources located within the nominal nuclear error circle, some of which may well correspond to components of the galactic source population other than low-luminosity AGN. Thus our luminosity distribution strictly represents a lower-limit estimate; fortunately the comparison with M31 is on a similar basis in that the M31 measurements exclude the bulge region, i.e. a region within radius kpc) of the nucleus of M31. If we include both the nuclear X-ray sources associated with H II and NoEL galaxies (9 sources) and also those associated with Seyfert and LINER nuclei (a further 20 sources), the effect, as expected, is a flattening of the power-law fit to the XHFS data to a slope of , a value which changes only marginally when the M31 data are also included. A further potential bias arises, of course, due to the limited angular resolution of the HRI. In this case the effect of closely-spaced discrete sources blending into a single detection, is to induce a flattening of the measured luminosity function. It is quite possible that this latter effect partly compensates for the fact that the nuclear sources are excluded in our primary analysis.
The best-fit straight line to the combined XHFS and M31 datasets in Figure 7(b) corresponds to a differential luminosity distribution of the form sources per unit per , where is the X-ray luminosity in units of . This form for the luminosity distribution is in excellent agreement with that recently reported for the X-ray source population in M101 by Wang, Immler & Pietsch (1999) except that their normalisation (per ) is a factor higher than our sample-averaged value555We detect a total of 27 sources in M101 (= NGC 5457) - see Appendix A; Wang et al. (1999) exploit an ultra-deep co-addition of all the available HRI data and a detection threshold set at in deriving a list of 51 X-ray sources, about half of which are probably associated with M101.. Almost certainly this represents a real over-density of bright X-ray sources in M101 with respect to the norm for spiral galaxies and may be related to a number of factors such as the relatively low metallicity in the outer disk of M101 and the presence across the galaxy of numerous giant HII clouds and vigorous star-forming regions (Trinchieri, Fabbiano & Romaine 1990; Wang et al. 1999).
Integration of the luminosity distribution derived above for LX in the range , leads to an LX/LB ratio for the discrete X-ray source population in spiral galaxies of . In a recent paper Brown & Bregman (1998) have used ROSAT data to study the LX versus LB relation for a complete sample of early type galaxies. These authors estimate the contribution to the soft X-ray emission from stellar X-ray sources on the basis of X-ray spectral measurements for Cen A (the nearest non-dwarf elliptical galaxy). Specifically they use the results of Turner et al. (1997) who identify a hard spectral component in Cen A with stellar sources but attribute a soft component ( keV) to emission from diffuse hot gas. The hard spectral component implies an LX/LB ratio for Cen A of , in excellent agreement with the value we derived above for spiral galaxies. (Note we have scaled up the hard X-ray luminosity for Cen A quoted by Brown & Bregman (1998) for the 0.5–2 keV band by a factor of 2.3 to account for our wider 0.1–2.4 keV bandpass).
The luminosity function defined above may also be integrated to give an estimate of the frequency of occurrence in spiral galaxies of “super-luminous” galactic X-ray sources. Here we define a super-luminous source (SLS) to be one with a luminosity above LX , which is the Eddington limit for accretion onto a neutron star. We find that, on average, there are such sources per . The source catalogue in Appendix A actually lists 85 non-nuclear SLS, 28 of which have LX in excess of .
The nature of the SLS population in nearby galaxies has been the subject of considerable debate following the discovery of many such objects in EINSTEIN and, more recently, ROSAT images (e.g. Fabbiano 1989; 1995; Read et al. 1997). Populations of galactic X-ray source which may generate X-ray luminosities in excess of include XRBs powered by accretion onto a stellar mass () black hole and very young SNRs in which the supernova ejecta interact strongly with the circumstellar medium (e.g. Fabbiano, 1996 and references therein). Recently it has also been suggested that very luminous remnants observed in M101 may be the relics of “hypernovae”, that is to say local manifestations of gamma-ray burst activity (Wang 1999).
An important step when dealing with a point-like source which is apparently super-luminous is to consider whether it represents one discrete object or a complex of sources (for example, a dense grouping of high and/or low mass XRBs which individually would not be categorised as a SLS population). In this respect large amplitude variability provides a pointer towards the presence of either a single compact source or a grouping of no more than a few such objects. We have used the multiple HRI observations, where available, to identify those sources exhibiting significant (i.e. factor ) variability (see Appendix A). It turns out that only 1 out 19 of the non-nuclear SLS sources is flagged as variable, but unfortunately due to the limited temporal sampling it is difficult to draw any firm conclusions from this result.
In conclusion it seems likely that the non-nuclear SLS sources in the XHFS sample represent a heterogeneous mix of luminous stellar mass black hole XRBs, complexes of near-Eddington limited (or perhaps super-Eddington) high- and low-mass XRBs and a number of examples of recent supernovae and young SNRs. However, the detailed follow-up of individual sources is beyond the scope of the present paper.
6 Summary
This paper utilises the substantial resources of both the ROSAT HRI public archive and the HFS sample to study the statistical properties of discrete X-ray sources in bright nearby galaxies. Our main findings may be summarised as follows:
- (i)
-
Our XHFS catalogue lists 187 discrete X-ray sources detected within the optical extent of 83 nearby galaxies. The 45 sources which lie within of the optical nucleus of the host galaxy are designated as “nuclear” X-ray sources with the remainder comprising our “non-nuclear” source sample.
- (ii)
-
Contamination of the XHFS sample by background and/or foreground objects is low. It amounts to less than 1 in 8 of the non-nuclear sample and is totally neglible in the nuclear sample.
- (iii)
-
The detection rate of nuclear X-ray sources and the average X-ray luminosity is substantially higher for those galaxies potentially hosting a low-luminosity AGN (Seyferts and LINERs) compared to the galaxies exhibiting only low-excitation emission spectra (the H II galaxies) or no emission lines.
- (iv)
-
The LX/LHα ratio of the putative AGN in the XHFS sample is in the same range as that observed for higher luminosity objects, such as QSOs, but extends two magnitudes fainter in luminosity than previously reported. Using the MBH to Lbulge relation from Magorrian et al. (1998), we find that the low-luminosity AGN in the XHFS sample are radiating at severely sub-Eddington rates (i.e. – 10-3 of the Eddington luminosity).
- (v)
-
The luminosity distribution of the non-nuclear sources in spiral galaxies of type SOa - Scd is sources per unit per in the range. This integrates to give a LX/LB ratio of .
- (vi)
-
The median luminosity of the non-nuclear sources is times lower than that of nuclear sources. However, it is still in excess of the Eddington luminosity for a 1.4 solar mass neutron star (), implying a substantial population of super-luminous X-ray sources in nearby galaxies. Our estimate of the incidence such sources is per .
Although we discuss the possible nature of the super-luminous X-ray sources revealed in the XHFS survey in large numbers, we have not pursued the identification of individual sources, and indeed such a programme is greatly hampered by the limitations of the current X-ray data. This should change with the advent of the new generation of X-ray observatories, most particularly XMM and CHANDRA, whose combination of excellent spatial resolution, wide bandpass medium resolution spectroscopy and high throughput are ideally suited to detailed studies of the bright X-ray source populations in nearby galaxies.
ACKNOWLEDGMENTS
TPR gratefully acknowledges financial support from PPARC. The X-ray data used in this work were all obtained from the Leicester Database and Archive Service (LEDAS) at the Department of Physics & Astronomy, University of Leicester. The Digitised Sky Survey was produced at the Space Telescope Science Institute, under US government grant NAG W-2166 from the original National Geographic–Palomar Sky Survey plates. We are grateful to the anonymous referee for suggesting a number of improvements to this paper.
References
- [] Allan D.J., 1995, Asterix user note 004, CCLRC/Rutherford Appleton Laboratories
- [] Brown B.A., Bregman J.N., 1998, ApJL, 495, 75
- [] Burstein D., Jones C., Forman W., Marston A.P., Marzke R.O., 1997, ApJS, 111, 163
- [] Colbert E.J.M., Mushotzky R.F., 1999, ApJ, 519, 89
- [] Dahlem M., Heckman T.M., Fabbiano, G., 1995, ApJ, 442, L49
- [] de Vaucouleurs G., de Vaucouleurs A., Corwin H.G., Jr., Buta R.J., Paturel G., Fouque R., 1991, Third Reference Catalogue of Bright Galaxies, Springer, New York
- [] Fabbiano G., 1989, ARA&A, 27, 87
- [] Fabbiano G., Kim D.-W., Trinchieri G., 1992, ApJS, 80, 645
- [] Fabbiano G., 1995, In ‘X-ray Binaries’, W.H.G. Lewin et al. eds., Cambridge University Press, Cambridge, 390
- [] Fabbiano G., 1996, In ‘Roentgenstrahlung from the Universe’, MPE report No. 263, H.U. Zimmermann, J.E. Tremper & H. Yorke eds., 347
- [] Fabbiano G., Juda J.Z., 1997, ApJ, 476, 666
- [] Fabian A.C., Rees M.J., 1995, MNRAS, 277, 55
- [] Feigelson E.D., Nelson P.I., 1985, ApJ, 293, 192
- [] George I.M., Turner T.J., Netzer H., Nandra K., Mushotzky R.F., Yaqoob T., 1998, ApJS, 114, 73
- [] Harris D.E., Silverman J.D., Hasinger G., Lehmann I., 1998, A&AS, 133, 431
- [] Hasinger G., Burg R., Giaconni R., Schmidt M., Trümper J., Zamorani G., 1993, A&A, 273, 1
- [] Ho L.C., 1999, ApJ, 516, 672
- [] Ho L.C., Filippenko A.V., Sargent W.L.W., 1995, ApJS, 98, 477
- [] Ho L.C., Filippenko A.V., Sargent W.L.W., 1997a, ApJS, 112, 315
- [] Ho L.C., Filippenko A.V., Sargent W.L.W., 1997b, ApJS, 112, 391
- [] Ho L.C., Filippenko A.V., Sargent W.L.W., 1997c, ApJ, 487, 568
- [] Ishisaki Y., Makashima K., Iyomoto N., Hayashida K., Inoue H., Mitsuda K., Tanaka Y., Ueno S., Kohmura Y., Mushotzky R.F., Petre R., Serlemitsos P.J., Terashima Y., 1996, PASJ, 48, 237
- [] Koratkar A., Deustra S.E., Heckman T., Filippenko A.V., Ho L.C., Rao M., 1995, ApJ, 440, 132
- [] Kormendy J., Richstone D., 1995, ARA&A, 33, 581
- [] Lawrence A., 1999, in Schmitt H.R., Kinney A.L., Ho L.C., eds, Adv. in Sp. Res., Vol. 23, No. 5/6, ‘The AGN/normal galaxy connection’, pg. 1167, Oxford:Elsevier
- [] Lira P., Lawrence A., O’Brien P., Johnson R.A., Terlevich R., Bannister N., 1999, MNRAS, 305, 109
- [] Loewenstein M., Hayashida K., Toneri T., Davis D.S., 1998, ApJ, 497, 681
- [] Magorrian J., Tremaine S., Richstone D., Bender R., Bower G., Dressler A., Faber S.M., Gebhardt K., Green R., Grillmair C., Kormendy J., Lauer T., 1998, AJ, 115, 2285
- [] Narayan R., Yi I., 1995, ApJ, 452, 710
- [] Primini F.A., Forman W., Jones C., 1993, ApJ, 410, 615
- [] Ptak A., Yaqoob T., Serlemitsos P.J., Kuneida H., Terashima Y., 1996, ApJ, 459, 542
- [] Read A.M., Ponman T.J., Strickland D.K., 1997, MNRAS, 286, 626
- [] Roberts T.P., Warwick R.S., Ohashi T., 1999, MNRAS, 304, 52
- [] Salucci P., Ratnam C., Monaco P., Danese L., 1999, MNRAS, in press
- [] Siemiginowska A., Czerny B., Kostyunin V., 1996, ApJ, 458, 491
- [] Stark A., Gammie C.F., Wilson R.W., Bally J., Linke R.A., Heiles C., Hurwitz M., 1992, ApJS, 79,77
- [] Supper R., Hasinger G., Pietsch W., Trümper J., Jain A., Magnier E.A., Lewin W.H.G., Van Paradijs J., 1997, A&A, 317, 328
- [] Trinchieri G., Fabbiano G., Romaine S. 1990, ApJ, 356, 110
- [] Turner T.J., George I.M., Nandra K., Mushotzky R.F., 1997, ApJ, 488, 164
- [] Wandel A., 1999, ApJL, 519, 39
- [] Wang Q.D., ApJL, 517, 27
- [] Wang Q.D., Immler S., Pietsch W., 1999, ApJ, 523, 121
- [] Whittle M., 1992, ApJS, 79, 49
Appendix A CATALOGUE OF DETECTED X-RAY SOURCES
The complete, compressed catalogue of individual X-ray sources observed within the D25 ellipse of the XHFS galaxies is presented in Table 4. All position and count rate data are determined by the PSS algorithm, and the nuclear separation is the observed distance between the HFS nuclear position and the X-ray source. Where there is more than one detection of a source, the data are combined with a weighting commensurate with the observation durations. The time-averaged count rates have been converted to flux as described in §2. Finally, the notes column shows an “N” if the source is a nuclear X-ray source, and a “v” if it is designated a variable source on the basis of its count rate varying by a factor between detections in two separate observation epochs.
| Source designation | Observations | RA(2000) | dec(2000) | Count rate | Nuclear offset | log LX | Notes |
|---|---|---|---|---|---|---|---|
| () | (′′) | () | |||||
| IC 10 X-1 | AB | 00h20m29.7s | 59∘16′48 | 8.7 0.4 | 57.5 | 38.41 | |
| NGC 185 X-1 | 00h39m02.7s | 48∘24′09 | 1.7 0.4 | 243.5 | 36.87 | ||
| NGC 205 X-1 | 00h39m52.5s | 41∘45′17 | 1.1 0.3 | 405.4 | 36.59 | ||
| NGC 205 X-2 | 00h40m08.4s | 41∘40′12 | 1.2 0.3 | 167.5 | 36.64 | ||
| NGC 221 X-1 | 00h42m35.6s | 40∘48′32 | 2.7 0.6 | 224.7 | 36.99 | ||
| NGC 221 X-2 | 00h42m43.2s | 40∘51′47 | 13.4 1.1 | 12.2 | 37.69 | N | |
| NGC 404 X-1 | 01h09m26.9s | 35∘43′01 | 1.2 0.3 | 4.0 | 37.68 | N | |
| NGC 891 X-1 | 02h22m26.6s | 42∘18′27 | 0.6 0.1 | 167.2 | 38.63 | ||
| NGC 891 X-2 | 02h22m30.8s | 42∘19′07 | 0.6 0.1 | 110.6 | 38.60 | ||
| NGC 891 X-3 | 02h22m31.5s | 42∘19′54 | 4.8 0.3 | 64.4 | 39.53 | ||
| NGC 891 X-4 | 02h22m31.6s | 42∘20′19 | 1.9 0.2 | 43.6 | 39.12 | ||
| NGC 891 X-5 | 02h22m45.7s | 42∘25′53 | 1.6 0.2 | 327.7 | 39.06 | ||
| IC 342 X-1 | 03h45m56.0s | 68∘04′55 | 8.2 0.7 | 303.6 | 39.00 | ||
| IC 342 X-2 | 03h46m07.3s | 68∘07′06 | 1.9 0.4 | 250.2 | 38.36 | ||
| IC 342 X-3 | 03h46m16.6s | 68∘11′14 | 2.7 0.4 | 378.9 | 38.52 | ||
| IC 342 X-4 | 03h46m46.4s | 68∘09′47 | 4.9 0.6 | 245.0 | 38.78 | ||
| IC 342 X-5 | 03h46m49.6s | 68∘05′47 | 7.4 0.7 | 3.9 | 38.96 | N | |
| IC 342 X-6 | 03h46m58.5s | 68∘06′18 | 3.8 0.5 | 61.5 | 38.67 | ||
| IC 342 X-7 | 03h48m07.6s | 68∘04′54 | 1.3 0.3 | 439.6 | 38.19 | ||
| NGC 1569 X-1 | 04h30m48.7s | 64∘50′47 | 5.3 0.8 | 10.3 | 38.22 | N | |
| NGC 1961 X-1 | 05h42m04.4s | 69∘22′43 | 1.6 0.2 | 7.4 | 40.56 | N | |
| NGC 2276 X-1 | AB | 07h26m49.5s | 85∘45′49 | 1.5 0.2 | 47.9 | 40.16 | |
| NGC 2403 X-1 | 07h36m26.5s | 65∘35′37 | 13.1 0.8 | 161.2 | 39.19 | ||
| NGC 2403 X-2 | 07h36m52.9s | 65∘34′54 | 1.0 0.3 | 68.0 | 38.09 | ||
| NGC 2403 X-3 | 07h36m56.8s | 65∘35′38 | 4.0 0.5 | 37.2 | 38.67 | ||
| NGC 2403 X-4 | 07h37m03.4s | 65∘39′33 | 3.6 0.4 | 222.2 | 38.63 | ||
| NGC 2782 X-1 | 09h14m04.4s | 40∘07′38 | 1.7 0.4 | 49.4 | 40.11 | ||
| NGC 2782 X-2 | 09h14m05.4s | 40∘06′46 | 7.3 0.7 | 12.4 | 40.75 | N | |
| NGC 2903 X-1 | 09h32m05.6s | 21∘32′32 | 1.0 0.3 | 169.4 | 38.39 | ||
| NGC 2903 X-2 | 09h32m09.9s | 21∘31′01 | 1.6 0.4 | 65.1 | 38.60 | ||
| NGC 2903 X-3 | 09h32m10.4s | 21∘30′05 | 9.6 1.0 | 9.1 | 39.38 | N | |
| NGC 2976 X-1 | ABC | 09h47m14.5s | 67∘55′42 | 2.3 0.2 | 41.4 | 37.84 | v |
| NGC 3031 X-1 | F | 09h54m51.9s | 69∘02′48 | 3.7 0.5 | 251.6 | 37.69 | |
| NGC 3031 X-2 | ACDEFG | 09h55m01.0s | 69∘07′41 | 1.3 0.1 | 287.4 | 37.25 | |
| NGC 3031 X-3 | ABCDFG | 09h55m03.0s | 68∘56′15 | 1.2 0.1 | 504.0 | 37.21 | v |
| NGC 3031 X-4 | A | 09h55m10.8s | 69∘04′03 | 4.5 0.5 | 137.4 | 37.78 | |
| NGC 3031 X-5 | ABCDEFG | 09h55m11.3s | 69∘04′58 | 1.8 0.1 | 144.8 | 37.38 | v |
| NGC 3031 X-6 | F | 09h55m13.2s | 69∘08′25 | 1.8 0.4 | 287.3 | 37.37 | |
| NGC 3031 X-7 | ABCDEFG | 09h55m23.1s | 69∘05′07 | 1.4 0.1 | 94.4 | 37.26 | |
| NGC 3031 X-8 | ABCDEFG | 09h55m25.3s | 69∘09′56 | 4.5 0.2 | 355.0 | 37.77 | |
| NGC 3031 X-9 | BCDEFG | 09h55m25.7s | 69∘01′08 | 12.5 0.4 | 186.4 | 38.22 | v |
| NGC 3031 X-10 | F | 09h55m27.2s | 69∘02′50 | 1.3 0.4 | 90.2 | 37.24 | |
| NGC 3031 X-11 | ABCDEFG | 09h55m34.0s | 69∘00′28 | 25.7 0.5 | 217.9 | 38.53 | |
| NGC 3031 X-12 | C | 09h55m34.1s | 69∘02′42 | 1.3 0.4 | 84.9 | 37.24 | |
| NGC 3031 X-13 | ABCDEFG | 09h55m34.2s | 69∘03′50 | 334.0 1.6 | 19.6 | 39.64 | N,v |
| NGC 3031 X-14 | CF | 09h55m38.5s | 69∘02′40 | 1.9 0.3 | 86.6 | 37.41 | |
| NGC 3031 X-15 | BF | 09h55m50.2s | 68∘58′33 | 1.1 0.2 | 340.4 | 37.16 | |
| NGC 3031 X-16 | ABCDEFG | 09h55m51.0s | 69∘05′28 | 2.8 0.2 | 113.8 | 37.56 | |
| NGC 3031 X-17 | ABC | 09h56m10.3s | 69∘01′01 | 1.4 0.2 | 258.7 | 37.25 | v |
| NGC 3031 X-18 | ABCDG | 09h56m15.4s | 68∘57′18 | 1.5 0.1 | 458.3 | 37.29 | v |
| NGC 3031 X-19 | BD | 09h56m37.7s | 69∘00′25 | 1.1 0.2 | 396.0 | 37.18 | |
| NGC 3031 X-20 | BC | 09h57m02.5s | 68∘54′53 | 1.2 0.2 | 721.1 | 37.20 | |
| NGC 3079 X-1 | ABCDE | 10h01m59.0s | 55∘40′45 | 2.6 0.2 | 14.0 | 39.73 | N,v |
| NGC 3147 X-1 | ABC | 10h16m54.4s | 73∘24′00 | 53.2 0.9 | 3.7 | 41.74 | N |
| NGC 3190 X-1 | 10h18m05.8s | 21∘49′59 | 2.1 0.3 | 21.1 | 39.79 | N | |
| NGC 3226 X-1 | 10h23m27.3s | 19∘53′54 | 3.7 0.4 | 8.0 | 40.07 | N | |
| NGC 3227 X-1 | 10h23m30.8s | 19∘51′51 | 84.6 1.8 | 4.8 | 41.32 | N | |
| NGC 3310 X-1 | 10h38m46.1s | 53∘30′11 | 23.5 0.9 | 47.9 | 40.62 | ||
| NGC 3310 X-2 | 10h38m49.8s | 53∘29′33 | 1.0 0.2 | 40.6 | 39.25 | ||
| NGC 3377 X-1 | 10h47m41.7s | 13∘58′26 | 0.8 0.2 | 47.5 | 38.53 | ||
| NGC 3377 X-2 | 10h47m42.7s | 13∘59′07 | 1.2 0.3 | 3.9 | 38.68 | N |
| Source designation | Observations | RA(2000) | dec(2000) | Count rate | Nuclear offset | log LX | Notes |
|---|---|---|---|---|---|---|---|
| () | (′′) | () | |||||
| NGC 3379 X-1 | 10h47m50.2s | 12∘34′55 | 5.0 0.5 | 5.4 | 39.30 | N | |
| NGC 3395 X-1 | 10h49m50.3s | 32∘59′07 | 1.4 0.3 | 26.6 | 39.75 | ||
| NGC 3628 X-1 | 11h20m15.7s | 13∘35′23 | 12.3 1.0 | 31.9 | 39.62 | ||
| NGC 3628 X-2 | 11h20m37.3s | 13∘34′38 | 3.3 0.6 | 296.1 | 39.04 | ||
| NGC 3998 X-1 | 11h57m50.4s | 55∘28′31 | 1.8 0.5 | 78.3 | 39.63 | ||
| NGC 3998 X-2 | 11h57m56.4s | 55∘27′10 | 161.7 3.6 | 17.4 | 41.59 | N | |
| NGC 4051 X-1 | 12h03m09.8s | 44∘31′54 | 1168.9 10.9 | 12.9 | 42.25 | N | |
| NGC 4088 X-1 | 12h05m32.8s | 50∘32′43 | 2.5 0.6 | 23.2 | 39.62 | N | |
| NGC 4150 X-1 | 12h10m35.0s | 30∘23′56 | 25.3 1.7 | 24.1 | 40.11 | N | |
| NGC 4151 X-1 | A | 12h10m22.4s | 39∘21′46 | 0.5 0.1 | 185.6 | 39.03 | |
| NGC 4151 X-2 | AB | 12h10m22.8s | 39∘23′12 | 0.6 0.1 | 124.7 | 39.15 | |
| NGC 4151 X-3 | AB | 12h10m33.0s | 39∘24′18 | 293.0 1.2 | 10.7 | 41.84 | N |
| NGC 4203 X-1 | 12h15m05.3s | 33∘11′49 | 59.0 1.6 | 15.7 | 40.46 | N | |
| NGC 4214 X-1 | 12h15m38.3s | 36∘19′17 | 2.7 0.3 | 37.7 | 38.26 | ||
| NGC 4235 X-1 | 12h17m10.3s | 07∘11′25 | 122.1 2.6 | 7.6 | 41.91 | N | |
| NGC 4258 X-1 | B | 12h18m44.6s | 47∘17′21 | 1.0 0.3 | 147.9 | 38.40 | |
| NGC 4258 X-2 | AB | 12h18m45.9s | 47∘18′26 | 1.3 0.2 | 121.1 | 38.49 | |
| NGC 4258 X-3 | AB | 12h18m45.8s | 47∘24′18 | 1.2 0.2 | 376.7 | 38.46 | |
| NGC 4258 X-4 | AB | 12h18m55.2s | 47∘16′45 | 1.4 0.2 | 100.4 | 38.52 | |
| NGC 4258 X-5 | B | 12h18m57.1s | 47∘21′20 | 1.2 0.3 | 178.7 | 38.46 | |
| NGC 4258 X-6 | AB | 12h18m58.1s | 47∘18′03 | 9.1 0.5 | 18.7 | 39.35 | N |
| NGC 4258 X-7 | AB | 12h18m58.3s | 47∘16′01 | 1.5 0.2 | 140.1 | 38.57 | |
| NGC 4258 X-8 | AB | 12h19m04.6s | 47∘18′27 | 2.4 0.3 | 69.4 | 38.76 | |
| NGC 4291 X-1 | AB | 12h20m18.2s | 75∘22′09 | 3.0 0.3 | 6.8 | 40.22 | N |
| NGC 4321 X-1 | 12h22m51.1s | 15∘49′33 | 0.9 0.2 | 59.2 | 39.17 | ||
| NGC 4321 X-2 | 12h22m55.0s | 15∘49′16 | 8.2 0.5 | 8.2 | 40.13 | N | |
| NGC 4321 X-3 | 12h22m58.6s | 15∘49′07 | 0.7 0.2 | 52.6 | 39.09 | ||
| NGC 4321 X-4 | 12h22m58.9s | 15∘47′49 | 0.8 0.2 | 109.0 | 39.14 | ||
| NGC 4388 X-1 | 12h25m47.3s | 12∘39′38 | 6.3 0.9 | 5.1 | 40.03 | N | |
| NGC 4395 X-1 | 12h26m01.9s | 33∘31′31 | 16.8 1.3 | 177.9 | 39.06 | ||
| NGC 4435 X-1 | 12h27m40.9s | 13∘04′44 | 1.9 0.4 | 8.2 | 39.51 | N | |
| NGC 4438 X-1 | 12h27m46.0s | 13∘00′26 | 8.2 0.7 | 9.4 | 40.15 | N | |
| NGC 4449 X-1 | ABC | 12h28m09.7s | 44∘05′04 | 6.4 0.4 | 61.9 | 38.48 | |
| NGC 4449 X-2 | BC | 12h28m10.5s | 44∘05′51 | 2.0 0.3 | 40.0 | 37.97 | |
| NGC 4449 X-3 | ABC | 12h28m11.3s | 44∘03′33 | 2.9 0.3 | 134.8 | 38.14 | v |
| NGC 4449 X-4 | ABC | 12h28m11.6s | 44∘06′41 | 5.5 0.4 | 63.7 | 38.41 | |
| NGC 4449 X-5 | B | 12h28m13.3s | 44∘06′22 | 5.3 0.6 | 39.3 | 38.40 | |
| NGC 4449 X-6 | AB | 12h28m15.0s | 44∘05′42 | 1.4 0.3 | 10.0 | 37.80 | N |
| NGC 4449 X-7 | ABC | 12h28m18.4s | 44∘06′29 | 3.3 0.3 | 64.8 | 38.19 | v |
| NGC 4485 X-1 | AB | 12h30m30.9s | 41∘41′39 | 2.8 0.3 | 18.9 | 39.12 | N |
| NGC 4490 X-1 | AB | 12h30m32.4s | 41∘39′12 | 3.4 0.3 | 67.2 | 39.06 | |
| NGC 4490 X-2 | AB | 12h30m36.7s | 41∘38′34 | 6.1 0.4 | 13.9 | 39.31 | N |
| NGC 4490 X-3 | A | 12h30m38.8s | 41∘37′43 | 1.4 0.3 | 47.0 | 38.66 | |
| NGC 4490 X-4 | AB | 12h30m43.6s | 41∘38′14 | 2.4 0.3 | 81.9 | 38.91 | |
| NGC 4559 X-1 | 12h35m52.0s | 27∘56′01 | 17.5 0.6 | 123.7 | 39.94 | ||
| NGC 4559 X-2 | 12h35m56.5s | 27∘55′26 | 0.8 0.2 | 131.7 | 38.62 | ||
| NGC 4559 X-3 | 12h35m56.7s | 27∘59′23 | 0.8 0.2 | 108.1 | 38.61 | ||
| NGC 4559 X-4 | 12h35m58.9s | 27∘57′40 | 11.3 0.5 | 13.1 | 39.75 | N | |
| NGC 4559 X-5 | 12h36m03.5s | 27∘57′55 | 0.9 0.2 | 75.9 | 38.67 | ||
| NGC 4569 X-1 | 12h36m50.1s | 13∘09′43 | 5.1 0.6 | 21.5 | 39.93 | N | |
| NGC 4631 X-1 | AB | 12h41m55.7s | 32∘32′12 | 5.2 0.5 | 147.7 | 39.11 | |
| NGC 4631 X-2 | A | 12h41m57.5s | 32∘31′59 | 2.0 0.5 | 127.1 | 38.69 | |
| NGC 4651 X-1 | 12h43m42.8s | 16∘23′34 | 1.3 0.3 | 15.1 | 39.31 | N | |
| NGC 4656 X-1 | 12h43m41.4s | 32∘04′55 | 3.0 0.4 | 379.5 | 38.91 | ||
| NGC 4736 X-1 | A | 12h50m44.5s | 41∘04′49 | 0.6 0.1 | 183.4 | 37.73 | |
| NGC 4736 X-2 | A | 12h50m47.8s | 41∘05′03 | 0.6 0.1 | 152.0 | 37.77 | |
| NGC 4736 X-3 | A | 12h50m52.8s | 41∘02′47 | 0.4 0.1 | 272.1 | 37.62 | |
| NGC 4736 X-4 | AB | 12h50m53.3s | 41∘07′08 | 50.5 0.7 | 12.7 | 39.69 | N |
| NGC 4736 X-5 | B | 12h51m00.0s | 41∘11′00 | 1.7 0.3 | 231.4 | 38.23 | |
| NGC 4826 X-1 | 12h56m44.0s | 21∘40′59 | 6.5 1.0 | 9.6 | 38.81 | N | |
| NGC 5005 X-1 | 13h10m56.6s | 37∘03′24 | 13.0 0.8 | 6.9 | 40.47 | N |
| Source designation | Observations | RA(2000) | dec(2000) | Count rate | Nuclear offset | log LX | Notes |
|---|---|---|---|---|---|---|---|
| () | (′′) | () | |||||
| NGC 5055 X-1 | 13h15m18.3s | 42∘03′57 | 1.4 0.4 | 373.6 | 38.59 | ||
| NGC 5055 X-2 | 13h15m19.8s | 42∘02′55 | 16.5 1.3 | 340.8 | 39.65 | ||
| NGC 5055 X-3 | 13h15m30.5s | 42∘03′07 | 2.2 0.5 | 229.4 | 38.78 | ||
| NGC 5055 X-4 | 13h15m41.0s | 42∘01′42 | 2.8 0.6 | 98.1 | 38.88 | ||
| NGC 5055 X-5 | 13h15m47.0s | 42∘01′52 | 3.7 0.7 | 31.3 | 39.01 | ||
| NGC 5055 X-6 | 13h15m47.1s | 42∘00′16 | 1.8 0.5 | 96.8 | 38.70 | ||
| NGC 5055 X-7 | 13h15m49.9s | 42∘01′38 | 3.2 0.7 | 9.9 | 38.94 | N | |
| NGC 5055 X-8 | 13h15m51.7s | 42∘01′34 | 2.1 0.5 | 25.3 | 38.76 | ||
| NGC 5055 X-9 | 13h16m02.6s | 42∘01′48 | 1.6 0.4 | 142.9 | 38.65 | ||
| NGC 5194 X-1 | 13h29m40.1s | 47∘12′35 | 2.6 0.3 | 140.5 | 38.91 | ||
| NGC 5194 X-2 | 13h29m43.9s | 47∘11′30 | 1.4 0.3 | 96.5 | 38.64 | ||
| NGC 5194 X-3 | 13h29m46.5s | 47∘10′38 | 1.4 0.3 | 100.3 | 38.65 | ||
| NGC 5194 X-4 | 13h29m53.2s | 47∘11′40 | 28.4 1.0 | 11.5 | 39.95 | N | |
| NGC 5194 X-5 | 13h29m54.4s | 47∘14′33 | 1.2 0.2 | 161.7 | 38.57 | ||
| NGC 5194 X-6 | 13h29m59.6s | 47∘15′48 | 2.5 0.4 | 245.6 | 38.91 | ||
| NGC 5194 X-7 | 13h30m01.6s | 47∘13′40 | 5.8 0.5 | 138.2 | 39.27 | ||
| NGC 5194 X-8 | 13h30m06.9s | 47∘08′30 | 0.7 0.2 | 245.6 | 38.33 | ||
| NGC 5194 X-9 | 13h30m08.1s | 47∘11′01 | 7.2 0.5 | 160.5 | 39.36 | ||
| NGC 5195 X-1 | 13h30m06.8s | 47∘15′39 | 1.3 0.2 | 80.7 | 38.77 | ||
| NGC 5204 X-1 | AB | 13h29m39.2s | 58∘25′01 | 30.3 1.1 | 19.6 | 39.57 | N |
| NGC 5273 X-1 | 13h42m08.3s | 35∘39′09 | 2.3 0.5 | 16.7 | 39.70 | N | |
| NGC 5457 X-1 | CD | 14h02m03.9s | 54∘18′26 | 0.6 0.1 | 642.2 | 37.93 | |
| NGC 5457 X-2 | ABCD | 14h02m22.5s | 54∘17′52 | 0.8 0.1 | 500.0 | 38.06 | v |
| NGC 5457 X-3 | ABCD | 14h02m28.6s | 54∘16′21 | 1.8 0.1 | 499.4 | 38.44 | |
| NGC 5457 X-4 | BCD | 14h02m28.6s | 54∘12′37 | 1.3 0.1 | 656.8 | 38.30 | |
| NGC 5457 X-5 | C | 14h02m29.0s | 54∘26′29 | 0.6 0.1 | 508.4 | 37.95 | |
| NGC 5457 X-6 | ABCD | 14h02m30.3s | 54∘21′15 | 3.7 0.1 | 389.1 | 38.74 | |
| NGC 5457 X-7 | C | 14h02m34.8s | 54∘21′11 | 0.3 0.1 | 349.0 | 37.61 | |
| NGC 5457 X-8 | B | 14h02m47.2s | 54∘26′53 | 1.0 0.2 | 415.7 | 38.17 | |
| NGC 5457 X-9 | CD | 14h02m53.3s | 54∘21′08 | 0.6 0.1 | 187.7 | 37.93 | |
| NGC 5457 X-10 | ABCD | 14h03m04.4s | 54∘27′32 | 3.2 0.1 | 388.8 | 38.68 | v |
| NGC 5457 X-11 | ACD | 14h03m13.3s | 54∘20′51 | 0.9 0.1 | 27.2 | 38.15 | |
| NGC 5457 X-12 | D | 14h03m13.6s | 54∘20′02 | 0.5 0.1 | 72.8 | 37.89 | |
| NGC 5457 X-13 | B | 14h03m16.0s | 54∘27′30 | 0.7 0.2 | 375.6 | 38.03 | |
| NGC 5457 X-14 | AB | 14h03m20.4s | 54∘17′15 | 1.7 0.2 | 244.3 | 38.41 | |
| NGC 5457 X-15 | CD | 14h03m22.4s | 54∘19′41 | 0.8 0.1 | 115.0 | 38.06 | |
| NGC 5457 X-16 | BC | 14h03m24.0s | 54∘19′41 | 0.6 0.1 | 123.7 | 37.99 | |
| NGC 5457 X-17 | B | 14h03m31.4s | 54∘21′55 | 0.9 0.2 | 151.1 | 38.14 | |
| NGC 5457 X-18 | D | 14h03m32.9s | 54∘20′58 | 1.1 0.2 | 159.5 | 38.23 | |
| NGC 5457 X-19 | BCD | 14h03m36.5s | 54∘19′21 | 0.6 0.1 | 221.3 | 37.95 | |
| NGC 5457 X-20 | D | 14h03m41.8s | 54∘19′02 | 0.5 0.1 | 271.2 | 37.91 | |
| NGC 5457 X-21 | D | 14h03m51.2s | 54∘24′09 | 0.6 0.1 | 362.9 | 37.93 | |
| NGC 5457 X-22 | BCD | 14h03m54.6s | 54∘21′55 | 0.9 0.1 | 350.3 | 38.12 | |
| NGC 5457 X-23 | D | 14h04m00.4s | 54∘09′09 | 0.4 0.1 | 828.4 | 37.75 | |
| NGC 5457 X-24 | ABCD | 14h04m15.0s | 54∘26′02 | 4.7 0.1 | 599.9 | 38.84 | |
| NGC 5457 X-25 | CD | 14h04m17.5s | 54∘16′10 | 0.6 0.1 | 627.7 | 37.92 | |
| NGC 5457 X-26 | ABCD | 14h04m22.5s | 54∘19′20 | 1.1 0.1 | 603.2 | 38.21 | v |
| NGC 5457 X-27 | CD | 14h04m29.7s | 54∘23′51 | 0.7 0.1 | 673.3 | 38.00 | |
| NGC 5905 X-1 | 15h15m23.7s | 55∘30′57 | 1.0 0.2 | 8.4 | 40.01 | N | |
| NGC 6217 X-1 | ABCDE | 16h32m40.6s | 78∘11′49 | 2.8 0.2 | 4.2 | 40.02 | N |
| NGC 6503 X-1 | 17h49m12.8s | 70∘09′24 | 1.5 0.4 | 82.8 | 38.57 | ||
| NGC 6946 X-1 | AB | 20h34m26.5s | 60∘09′06 | 1.3 0.2 | 189.4 | 38.63 | |
| NGC 6946 X-2 | A | 20h34m35.0s | 60∘10′29 | 0.5 0.1 | 141.1 | 38.22 | |
| NGC 6946 X-3 | AB | 20h34m37.0s | 60∘09′26 | 2.7 0.2 | 110.4 | 38.96 | |
| NGC 6946 X-4 | A | 20h34m49.4s | 60∘05′48 | 0.7 0.2 | 218.3 | 38.38 | |
| NGC 6946 X-5 | A | 20h34m50.1s | 60∘12′15 | 0.6 0.1 | 170.6 | 38.28 | |
| NGC 6946 X-6 | AB | 20h34m53.1s | 60∘09′07 | 2.6 0.2 | 20.9 | 38.95 | N |
| NGC 6946 X-7 | A | 20h34m57.4s | 60∘08′25 | 0.7 0.2 | 72.3 | 38.39 | |
| NGC 6946 X-8 | A | 20h34m58.5s | 60∘09′37 | 0.6 0.2 | 50.9 | 38.33 | |
| NGC 6946 X-9 | AB | 20h35m00.9s | 60∘09′03 | 3.5 0.2 | 71.2 | 39.07 | |
| NGC 6946 X-10 | AB | 20h35m01.2s | 60∘10′06 | 0.8 0.1 | 80.9 | 38.44 | |
| NGC 6946 X-11 | AB | 20h35m01.4s | 60∘11′27 | 16.4 0.5 | 141.4 | 39.75 | |
| NGC 6946 X-12 | A | 20h35m12.9s | 60∘07′26 | 0.6 0.1 | 223.7 | 38.31 | |
| NGC 6946 X-13 | A | 20h35m19.4s | 60∘10′53 | 0.6 0.1 | 378.3 | 38.29 | |
| NGC 7331 X-1 | 22h37m04.4s | 34∘24′51 | 2.8 0.4 | 18.0 | 39.65 | N |
Appendix B UPPER LIMITS ON NUCLEAR X-RAY LUMINOSITY
95% upper limits on the nuclear X-ray luminosities were derived for those nuclei without a detected nuclear X-ray source. The results are listed in Table 5. Where there are two or more observations of a source, the observation with the longest exposure was employed.
| Galaxy | Count rate | log LX |
|---|---|---|
| () | () | |
| IC 10 | 0.38 | 37.05 |
| NGC 147 | 0.63 | 36.43 |
| NGC 185 | 0.74 | 36.51 |
| NGC 205 | 1.24 | 36.66 |
| NGC 520 | 1.44 | 39.84 |
| NGC 891 | 1.04 | 38.86 |
| NGC 1058 | 0.36 | 38.33 |
| NGC 1560 | 0.86 | 37.84 |
| NGC 2276 | 1.72 | 40.23 |
| NGC 2366 | 0.68 | 37.57 |
| NGC 2403 | 0.30 | 37.55 |
| NGC 2775 | 1.55 | 39.48 |
| NGC 2976 | 0.70 | 37.32 |
| NGC 3073 | 0.77 | 39.14 |
| NGC 3185 | 0.68 | 39.25 |
| NGC 3193 | 1.47 | 39.66 |
| NGC 3294 | 1.76 | 39.83 |
| NGC 3310 | 1.25 | 39.34 |
| NGC 3384 | 1.45 | 38.76 |
| NGC 3389 | 1.08 | 39.52 |
| NGC 3395 | 0.74 | 39.49 |
| NGC 3628 | 1.15 | 38.58 |
| NGC 4214 | 1.15 | 37.89 |
| NGC 4395 | 2.46 | 38.22 |
| NGC 4470 | 1.17 | 39.80 |
| NGC 4527 | 2.53 | 39.41 |
| NGC 4631 | 1.30 | 38.51 |
| NGC 4638 | 1.40 | 39.36 |
| NGC 4647 | 1.60 | 39.42 |
| NGC 4656 | 1.35 | 38.56 |
| NGC 4772 | 2.24 | 39.52 |
| NGC 5195 | 2.11 | 38.99 |
| NGC 5354 | 1.43 | 39.89 |
| NGC 5457 | 0.48 | 37.85 |
| NGC 5775 | 0.66 | 39.47 |
| NGC 5850 | 1.15 | 39.79 |
| NGC 6503 | 2.96 | 38.86 |
| NGC 6654 | 1.05 | 39.81 |