MILLISECOND OSCILLATIONS IN X-RAY BINARIES
Abstract
The first millisecond X-ray variability phenomena from accreting compact objects have recently been discovered with the Rossi X-ray Timing Explorer. Three new phenomena are observed from low-mass X-ray binaries containing low-magnetic-field neutron stars: millisecond pulsations, burst oscillations and kiloHertz quasi-periodic oscillations. Models for these new phenomena involve the neutron star spin, and orbital motion closely around the neutron star and rely explicitly on our understanding of strong gravity and dense matter. I review the observations of these new neutron-star phenomena and possibly related ones in black-hole candidates, and describe the attempts to use them to perform measurements of fundamental physical interest in these systems.
1 Introduction
Submitted to the Annual Review of Astronomy and Astrophysics; to appear September 2000
The principal motivation for studying accreting neutron stars and black holes is that these objects provide a unique window on the physics of strong gravity and dense matter. One of the most basic expressions of the compactness of these compact objects is the short (0.1–1 msec) dynamical time scale characterizing the motion of matter under the influence of gravity near them. Millisecond variability will naturally occur in the process of accretion of matter onto a stellar-mass compact object, an insight that dates back to at least Shvartsman (1971). For example, hot clumps orbiting in an accretion disk around black holes and neutron stars will cause quasi-periodic variability on time scales of about a millisecond (Sunyaev 1973). Accreting low-magnetic field neutron stars will reach millisecond spin periods, which can be detected when asymmetric emission patterns form on the star’s surface during X-ray bursts (Radhakrishnan & Srinivasan 1984, Alpar et al. 1982; Shara 1982, Livio & Bath 1982, see also Joss 1978). These early expectations have finally been verified in a series of discoveries with NASA’s Rossi X-Ray Timing Explorer (RXTE; Bradt et al. 1993) within 2.5 years after launch on 30 December 1995.
In this review, I discuss these newly discovered phenomena and the attempts to use them to perform measurements of fundamental physical interest. I concentrate on millisecond oscillations, periodic and quasi-periodic variations in X-ray flux with frequencies exceeding 102.5 Hz, but I also discuss their relations to slower variability and X-ray spectral properties. Millisecond oscillations have so far been seen nearly exclusively from low-magnetic-field neutron stars, so these will be the focus of this review, although I shall compare their phenomenology to that of the black-hole-candidates (§6-7).
Accreting neutron stars and black holes occur in X-ray binaries (e.g., Lewin et al. 1995a). In these systems matter is transferred from a normal (’donor’) star to a compact object. Thermal X-rays powered by the gravitational potential energy released are emitted by the inner regions of the accretion flow and, if present, the neutron star surface. For a compact object with a size of order 101 km, 90% of the energy is released in the inner 102 km. It is with this inner emitting region that we shall be mostly concerned here. Because accreting low-magnetic-field neutron stars are mostly found in low-mass X-ray binaries (in which the donor star has a mass of 1M⊙) these systems will be the ones we focus on.
The mass transfer usually occurs by way of an accretion disk around the compact object. In the disk the matter moves in near-Keplerian orbits, i.e., with an azimuthal velocity that is approximately Keplerian and a radial velocity much smaller than this. The disk has a radius of 105-7 km, depending on the binary separation. The geometry of the flow in the inner emitting regions is uncertain. In most models for accretion onto low-magnetic-field neutron stars (e.g., Miller et al. 1998a) at least part of the flow extends down into the emitting region in the form of a Keplerian disk. It is terminated either at the radius of the star itself, or at a radius somewhat larger than , by for example the interaction with a weak neutron-star magnetic field, radiation drag, or relativistic effects. Within the flow is no longer Keplerian and may or may not be disk-like. Both inside and outside matter may leave the disk and either flow in more radially or be expelled. Particularly for black holes advective flow solutions are discussed where the disk terminates and the flow becomes more spherical at a much larger radius (e.g., Narayan 1997).
Whatever the geometry, it is clear that as the characteristic velocities near the compact object are of order , the dynamical time scale, the time scale for the motion of matter through the emitting region, is short; 0.1 ms for =10 km, and 2 ms for =100 km near a 1.4M⊙ neutron star, and 1 ms at 100 km from a 10M⊙ black hole. So, the significance of millisecond X-ray variability from X-ray binaries is clear: milliseconds is the natural time scale of the accretion process in the X-ray emitting regions, and hence strong X-ray variability on such time scales is nearly certainly caused by the motion of matter in these regions. Orbital motion, neutron-star spin, disk- and neutron-star oscillations are all expected to happen on these time scales.
The inner flow is located in regions of spacetime where strong-field general-relativity is required to describe the motion of matter. For that reason one expects to detect strong-field general-relativistic effects in these flows, such as for example the existence of a region where no stable orbits are possible. The precise interactions between the elementary particles in the interior of a neutron star which determine the equation of state (EOS) of supra-nuclear-density matter are not known. Therefore we can not confidently predict the radius of a neutron star of given mass, or the maximum spin rate or mass of neutron stars (e.g., Cook et al. 1994). So, by measuring these macroscopic quantities one constrains the EOS and tests basic ideas about the properties of elementary particles. In summary, the main motivation for studying millisecond variations in X-ray binaries is that their properties depend on untested, or even unknown, properties of spacetime and matter.
Three different millisecond phenomena have now been observed in X-ray binaries. Historically, the first to be discovered were the twin kilohertz quasi-periodic oscillations (kHz QPOs), widely interpreted now as due to orbital motion in the inner accretion flow. Then came the burst oscillations, probably due to the spin of a layer in the neutron star’s atmosphere in near-corotation with the neutron star itself. Finally RXTE detected the first true spin frequency of an accreting low-magnetic field neutron star, the long-anticipated accreting millisecond pulsar.
In this review, I first examine the millisecond pulsar (§3), then the burst oscillations (§4) and finally the kHz QPOs (§5). We will thus be venturing from the (relatively) well-understood accreting pulsars via the less secure regions of what happens in detail on a neutron star’s surface during the thermonuclear runaway that is an X-ray burst, into the mostly uncharted territory of the innermost accretion flows around neutron stars and black holes, which obviously is “where the monsters are”, but also where the greatest rewards wait. The possibly related phenomena found in black-hole candidates (§6.1) and at lower frequencies (§6.3) are discussed next, and in §7 the kHz QPO models are summarized.
2 Techniques
Most of the variability measurements discussed here rely on Fourier analysis of X-ray count-rate time series with sub-millisecond time resolution (van der Klis 1989b). A quasi-periodic oscillation (QPO) in the time series stands out in the power spectrum (the square of the Fourier transform) as a broad, usually Lorentzian peak (in Fig. 5 several of such peaks can be seen), characterized by its frequency (“centroid frequency”), width (inversely proportional to the coherence time of the oscillation) and strength (the peak’s area is proportional to the variance of the QPO signal). The variance is nearly always reported in terms of the root-mean-square of the signal expressed as a fraction of the count rate, the “fractional rms amplitude” ; the coherence often in terms of a quality factor . Conventionally, to call a local maximum in a power spectrum a QPO peak one requires . Time delays between signals simultaneously detected in different energy bands are usually measured using cross-spectra (the frequency-domain equivalent of the cross-correlation function; van der Klis et al. 1987, Vaughan et al. 1994a, Nowak et al. 1998) and often expressed in terms of a phase lag (time lag multiplied by frequency).
The signal-to-noise of a broad power-spectral feature is (van der Klis 1989b, see van der Klis 1998 for more details), where is the count rate and the observing time (assumed ). Note that is proportional to the count rate and to the signal amplitude squared, so that it is sufficient for the amplitude to drop by 50% for the signal-to-noise to go from, e.g., a whopping 6 to an undetectable 1.5 – i.e., if a power-spectral feature “suddenly disappears” it may have only decreased in amplitude by a factor of two.
3 Millisecond pulsations
An accreting millisecond pulsar in a low-mass X-ray binary has sometimes been called the “Holy Grail” of X-ray astronomy. Its discovery was anticipated for nearly 20 years, because magnetospheric disk accretion theory as well as evolutionary ideas concerning the genesis of millisecond radio pulsars strongly suggested that such rapid spin frequencies must occur in accreting low-magnetic field neutron stars (see Bhattacharya & van den Heuvel 1991). However, in numerous searches of X-ray binary time series (e.g., Leahy et al. 1983, Mereghetti & Grindlay 1987, Wood et al. 1991, Vaughan et al. 1994b) such rapid pulsars did not turn up.
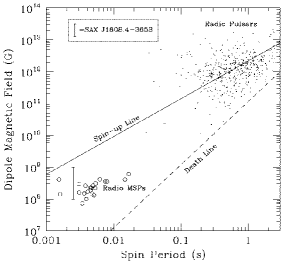
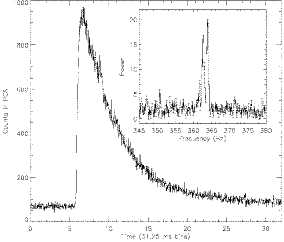
More than two years after RXTE’s launch, the first, and as of this writing only accreting millisecond pulsar was finally discovered on April 13, 1998 in the soft X-ray transient SAX J1808.43658 (Fig. 1; Wijnands & van der Klis 1998a,b). The pulse frequency is 401 Hz, so this is a 2.5 millisecond pulsar. The object is nearly certainly the same as the transient that burst out at the same position in September 1996 and gave the object its name (in ’t Zand et al. 1998). As this transient showed two type 1 X-ray bursts, SAX J1808.43658 is also the first genuine bursting pulsar, breaking the long-standing rule (e.g., Lewin & Joss 1981) rule that pulsations and type 1 X-ray bursts are mutually exclusive.
The orbital period of this pulsar is 2 hrs (Fig. 2; Chakrabarty & Morgan 1998a,b). With a projected orbital radius of only 63 light milliseconds and a mass function of 3.8 10-5M⊙, the companion star is either very low mass, or we are seeing the orbit nearly pole-on. The amplitude of the pulsations varied between 4 and 7% and showed little dependence on photon energy (Cui et al. 1998b). However, the pulsations as measured at higher photon energies preceded those measured in the 2-3 keV band by a gradually increasing time interval from 20 sec (near 3.5 keV) up to 200 sec (between 10 and 25 keV) (Cui et al. 1998b). These lags could be caused by Doppler shifting of emission from the pulsar hot spots, higher-energy photons being emitted earlier in the spin cycle as the spot approaches the observer (Ford 1999).
|
An accreting magnetized neutron star spinning this fast must have a weak magnetic field. If not, the radius of the magnetosphere would exceed the corotation radius, and matter corotating in the magnetosphere would not be able to overcome the centrifugal barrier. A simple estimate leads to upper limits on of 31 km, and on the surface field strength of 2–6 108 Gauss (Wijnands & van der Klis 1998b). A similarly simple estimate, involving in addition the requirement that for pulsations to occur must be larger than the radius of the neutron star, would set a strong constraint on the star’s mass-radius relation (Burderi & King 1998) and hence on the EOS (see also Li et al. 1999a). However, the process of accretion onto a neutron star with such a low is not identical to that in classical, 1012-Gauss accreting pulsars. In particular, the disk model (used in calculating ) is different this close to the neutron star, the disk-star boundary layer may be different, and multipole components in the magnetic field become important. Conceivably a classical magnetosphere does not even form and the 4–7%-amplitude pulsation occurs due to milder effects of the magnetic field on either the flow or the emission. Psaltis & Chakrabarty (1999) discuss these issues and conclude that is (1–10) 108 Gauss, which puts the source right among the other, rotation-powered, millisecond pulsars (the msec radio pulsars; Fig. 2). When the accretion shuts off sufficiently for the radio pulsar mechanism to operate, the system will likely show up as a radio pulsar. This should happen at the end of the system’s life as an X-ray binary, i.e., SAX J1808.43658 is indeed the long-sought millisecond radio-pulsar progenitor, but might also occur in between the transient outbursts (Wijnands & van der Klis 1998b). So far, radio observations have not detected the source in X-ray quiescence (Gaensler et al. 1999).
It is not clear what makes the neutron star spin detectable in SAX J1808.43658 and not (so far) in other low-mass X-ray binaries of similar and often much higher flux. Perhaps a peculiar viewing geometry (e.g., a very low inclination of the binary orbit) allows us to see the pulsations only in this system, although possible X-ray and optical modulations with binary phase make an inclination of zero unlikely (Chakrabarty & Morgan 1998b, Giles et al. 1999).
With a neutron star spin frequency that is certain and good estimates of and , SAX J1808.43658 can serve as a touchstone in studies of low-mass X-ray binaries. Although no burst oscillations (§4) or kHz QPOs (§5) have been detected from the source, their absence is consistent with what would be expected from a standard LMXB in the same situation (Wijnands & van der Klis 1998c), and in more intensive observations during a next transient outburst such phenomena could be detected. This would strongly test the main assumptions underlying the models for these phenomena. The X-ray spectral properties (Heindl & Smith 1998, Gilfanov et al. 1998) and the slower types of variability (Wijnands & van der Klis 1998c) of the source are very similar to those of other LMXBs at low accretion rate suggesting that either the neutron stars in those systems have similar , or the presence of a small magnetosphere does not affect spectral and slow-variability characteristics.
4 Burst oscillations
Type 1 X-ray bursts are thermonuclear runaways in the accreted matter on a neutron-star surface (Lewin et al. 1995b for a review). When density and temperature in the accumulated nuclear fuel approach the ignition point, the matter ignites at one particular spot, from which a nuclear burning front then propagates around the star (Bildsten 1998b for a review). This leads to a burst of X-ray emission with a rise time of typically 1 s, and a 101–102 s exponential decay due to cooling of the neutron-star atmosphere. The total amount of energy emitted is 1039-40 erg. In some bursts the Eddington critical luminosity is exceeded and atmospheric layers are lifted off the star’s surface, leading to an increase in photospheric radius of 101–102 km, followed by a gradual recontraction. These bursts are called “radius expansion bursts”.
In the initial phase, when the burning front is spreading, the energy generation is inherently very anisotropic. The occasional occurrence of multiple bursts closely spaced in time indicates that not all available fuel is burned up in each burst, suggesting that in some bursts only part of the surface participates. Magnetic fields and patchy burning (Bildsten 1995) could also lead to anisotropic emission during X-ray bursts. Anisotropic emission from a spinning neutron star leads to periodic or quasi-periodic observable phenomena, because due to the stellar rotation the viewing geometry of the brighter regions periodically varies (unless the pattern is symmetric around the rotation axis). Searches for such periodic phenomena during X-ray bursts were performed by various groups (Mason et al. 1980, Skinner et al. 1982, Sadeh et al. 1982, Sadeh & Livio 1982a,b, Murakami et al. 1987, Schoelkopf & Kelley 1991, Jongert & van der Klis 1996), but claims of detections remained unconfirmed.
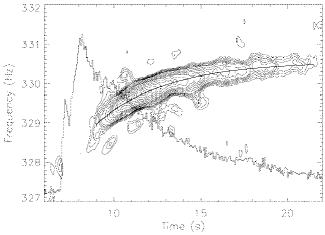
The first incontestable type 1 burst oscillation was discovered with RXTE in a burst that occurred on 1996 February 16 in the reliable burst source 4U 172834. An oscillation with a slightly drifting frequency near 363 Hz was evident in a power spectrum of 32 s of data starting just before the onset of the burst (Strohmayer et al. 1996a,b,c; Fig. 3). The oscilation frequency increased from 362.5 to 363.9 Hz in the course of 10 s.
|
Burst oscillations have now been detected in six (perhaps seven) different sources (Table 1). They do not occur in each burst, and some burst sources have not so far shown them at all. Sometimes the oscillations are strong for less than a second during the burst rise, then become weak or undetectable, and finally occur for 10 s in the burst cooling tail. This can happen even in radius expansion bursts, where after the photosphere has recontracted the oscillations (re)appear (Smith et al. 1997, Strohmayer et al. 1997a, 1998a). Some oscillations are seen only in the burst tail and not in the rise (Smith et al. 1997).
| Source | Minimum | Asymptotic | References | |
|---|---|---|---|---|
| observed | frequency | |||
| frequency | range | |||
| (Hz) | (Hz) | |||
| 4U 163653 | 579.3 a | 581.470.01 | 581.750.13 | 1,2,3,4,5,15 |
| 4U 170243 | 329.0 | 329.80.1 | 330.550.02 | 6,14 |
| 4U 172834 | 362.1 | 363.940.05 | 364.230.05 | 2,6,7,8 |
| KS 1731260 | 523.9 | 523.920.05 | 9,16 | |
| MXB 174329b | 588.9 | 589.800.07 | 10,17 | |
| Aql X-1 | 547.8 | 548.9 | 11,12,18 | |
| Rapid Burster | 154.9; 306.6c | 13 | ||
a A weak subharmonic exists near 290 Hz (Miller 1999a). b Source identification uncertain. c Marginal detections. References: [1] Strohmayer et al. 1998a [2] Strohmayer et al. 1998b [3] Strohmayer 1999 [4] Miller 1999a [5] Miller 1999b [6] Strohmayer & Markwardt 1999 [7] Strohmayer et al. 1996b,c [8] Strohmayer et al. 1997b [9] Smith et al. 1997 [10] Strohmayer et al. 1997a [11] Zhang et al. 1998c [12] Ford 1999 [13] Fox et al. 1999 [14] Markwardt et al. 1999a [15] Zhang et al. 1997a [16] Morgan and Smith 1996 [17] Strohmayer et al. 1996d [18] Yu et al. 1999
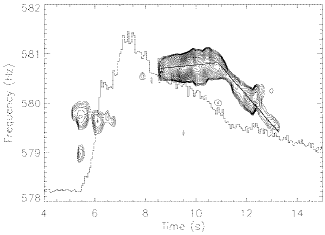
Usually, the frequency increases by 1–2 Hz during the burst tail, converging to an “asymptotic frequency” which in a given source tends to be stable ((Strohmayer et al. 1998c; Fig. 3), with differences from burst to burst of 0.1% (Table 1). This is of the order of what would be expected from binary orbital Doppler shifts and strengthens an interpretation in terms of the neutron star spin. Perhaps the orbital radial velocity curve can be detected in the asymptotic frequencies, but it remains to be seen if the asymptotic frequencies are intrinsically stable enough for this. Exceptions from the usual frequency evolution pattern do occur. Oscillations with no evidence for frequency evolution were observed in KS 173126 (Smith et al. 1997) and 4U 174329 (Strohmayer et al. 1997a), and in 4U 163653 a decrease in frequency was seen in a burst tail (Miller 1999b, Strohmayer 1999; Fig. 4).
In a widely (but not universally; §7.2) accepted scenario, the burst oscillations arise due to a hot spot or spots in an atmospheric layer of the neutron star rotating slightly slower than the star itself because it expanded by 5–50 m in the X-ray burst but conserved its angular momentum (Strohmayer et al. 1997a and references therein, Bildsten 1998b, Strohmayer 1999, Strohmayer & Markwardt 1999, Miller 1999b). The frequency drifts are caused by spin-up of the atmosphere as it recontracts in the burst decay. The asymptotic frequency corresponds to a fully recontracted atmosphere and is closest to the true neutron star spin frequency. From this scenario one expects a frequency drop during the burst rise, but no good evidence has been found for this as yet (Strohmayer 1999). The case of a frequency drop in the burst tail (Fig. 4) is explained by invoking additional thermonuclear energy input late in the burst, which also affects the burst profile (Strohmayer 1999).
|
If the oscillations are due to a stable pattern in the spinning layer, then it should be possible to describe them as a frequency-modulated, strictly coherent signal. By applying a simple exponential model to the frequency drifts, it is possible to establish coherences of up to Q4000 (Strohmayer & Markwardt 1999, see also Zhang et al. 1998c, Smith et al. 1997, Miller 1999a,b). However, this is still 20% less than a fully coherent signal of this frequency and duration, i.e., it has not yet been possible to count the exact number of cycles in the way this can be done in a pulsar. Possibly, exact coherence recovery is feasible for these signals, but current signal-to-noise limits prevent to accomplish this as the exact frequency drift ephemeris can not be found.
The harmonic content of the oscillations is low. In 4U 163653 it is just possible, by combining data from the early stages of several bursts, to detect a frequency near 290 Hz, half the dominant one (Miller 1999a,b), suggesting that 290 Hz, not 580 Hz is the true spin frequency and that two antipodal hot spots produce the burst oscillation in this source (whose kHz peak separation is 250 Hz, §5). No harmonics or “subharmonics” have been seen in other sources, or in the burst tails of any source (Strohmayer & Markwardt 1999), with the possible exception of the marginal detections in the Rapid Burster (Fox et al. 1999).
The oscillation amplitudes range from 50% (rms) of the burst flux early in some bursts to between 2 and 20% (rms) in the tail (references see Table 1). (Note, that sometimes sinusoidal amplitudes are reported, which are a factor larger than rms amplitudes, and that amplitudes are expressed as a fraction of burst flux, total flux minus the persistent flux before the burst. Early in the rise, when burst flux is low compared to total flux, the measured amplitude is multiplied by a large factor to convert it to burst flux fraction.) In KS 1731260 (Smith et al. 1997) and 4U 174329 (Strohmayer et al. 1997a) the photon energy dependence of the oscillations was measured. Above 7 or 8 keV the amplitude was 9–18% while below that energy it was undetectable at 2–4%. 4U 163653 shows a slight variation in spectral hardness as a function of oscillation phase (Strohmayer et al. 1998). In Aql X-1 photons below 5.7 keV lag those at higher energies by roughly 0.3 msec, which may be caused by Doppler shifts (Ford 1999).
If the burst oscillations are due to hot spots on the surface, then their amplitude constrains the “compactness” of the neutron star, defined as where is the star’s radius and its gravitational radius (Strohmayer et al. 1997b, 1998a, Miller & Lamb 1998). The more compact the star, the lower the oscillation amplitude, as gravitational light bending increasingly blurs the beam. In particular when the oscillations are caused by two antipodal hot spots (cf. 4U 163653, above, and possibly other sources, §5.5), and the amplitudes are high, the constraints are strong. The exact bounds on the compactness depend on the emission characteristics of the spots, and no final conclusions have been reached yet.
Modeling of the spectral and amplitude evolution of the oscillations through the burst in terms of an expanding, cooling hot spot has been succesful (Strohmayer 1997b). However, several issues with respect to this attractively simple interpretation have yet to be resolved. The presence of two burning sites as required by the description in terms of two antipodal hot spots could be related to fuel accumulation at the magnetic poles (Miller 1999a), but their simultaneous ignition seems not easy to accomplish, and obviously, in view of the frequency drifts, these sites must decouple from the magnetic field after ignition. The hot spots must survive the strong shear in layers that, from the observed phase drifts, must revolve around the star several times during the lifetime of the spots, and they must even survive through photospheric radius expansion by factors of at least several during radius-expansion bursts (which probably implies the roots of the hot spots are below the photospheric layers).
The resolution of these issues ties in with questions such as why only some burst sources show the oscillations, and why only some bursts exhibit them. This is hard to explain in a magnetic-pole accumulation scheme as the viewing geometry of the poles remains the same from burst to burst. Studies of the relation between the characteristics of the bursts and the surrounding persistent emission and the presence and character of the burst oscillations could help to shed light on these various questions.
5 Kilohertz quasi-periodic oscillations
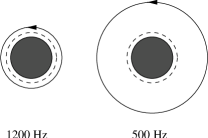
The kilohertz quasi-periodic oscillations (kHz QPOs) were discovered at NASA’s Goddard Space Flight Center in February 1996, just two months after RXTE was launched (in Sco X-1: van der Klis et al. 1996a,b,c, and 4U 172834: Strohmayer et al. 1996a,b,c; see van der Klis 1998 for a historical account). Two simultaneous quasi-periodic oscillation peaks (“twin peaks”) in the 300–1300 Hz range and roughly 300 Hz apart (Fig. 5) occur in the power spectra of low-mass X-ray binaries containing low-magnetic-field neutron stars of widely different X-ray luminosity Lx. The frequency of both peaks usually increases with X-ray flux (§5.4). In 4U 172834 the separation frequency of the two kHz peaks is close to (§4; Strohmayer et al. 1996b,c). This commensurability of frequencies provides a powerful argument for a beat-frequency interpretation (§5.1, 5.5, 7.1).
 
|
5.1 Orbital and beat frequencies
Orbital motion around a neutron star occurs at a frequency of
and the corresponding orbital radius is
where the star’s mass in units of 1.4M⊙ (Fig. 6). In general relativity, no stable orbital motion is possible within the innermost stable circular orbit (ISCO), . The frequency of orbital motion at the ISCO, the highest possible stable orbital frequency, is .
 |
These expressions are valid for a Schwarzschild geometry, i.e., outside a non-rotating spherically symmetric neutron star (or black hole). Corrections to first order in , where is the neutron-star angular momentum have been given by, e.g., Miller et al. (1998a) and can be several 10%. For more precise calculations see Morsink & Stella (1999).
In spin-orbit beat-frequency models some mechanism produces an interaction of at some preferred radius in the accretion disk with the neutron star spin frequency , so that a beat signal is seen at the frequency . As is the frequency at which a given particle orbiting in the disk overtakes a given point on the spinning star, it is the natural disk/star interaction frequency. In such a rotational interaction (with spin and orbital motion in the same sense) no signal is produced at the sum frequency (it is a “single-sideband” interaction).
5.2 Early interpretations
It was immediately realized that the observed high frequencies of kHz QPOs could arise in orbital motion of accreting matter very closely around the neutron star, or in a beat between such orbital motion and the neutron-star spin (van der Klis et al. 1996a, Strohmayer et al. 1996a; some of the proposals to look for such rapid QPOs with RXTE had in fact anticipated this). A magnetospheric spin-orbit beat-frequency model (Alpar & Shaham 1985, Lamb et al. 1985) was already in use in LMXBs for slower QPO phenomena (§6.3) so when three commensurable frequencies were found in 4U 172834, a beat-frequency interpretation was immediately proposed (Strohmayer et al. 1996c). Let us call the frequency of the higher-frequency (the “upper”) peak and that of the lower-frequency kHz peak (the “lower peak”). Then the beat-frequency interpretation asserts that is at some preferred radius in the disk, and is the beat frequency between and , so , where the approximate equality follows from (§4). That only a single sideband is observed is a strong argument for a rotational interaction (§5.1). Later this was worked out in detail in the form of the “sonic point beat-frequency model” by Miller et al. (1996, 1998a; §7.1), where the preferred radius is the sonic radius (essentially, the inner edge of the Keplerian disk).
The beat-frequency interpretation implies that the observed kHz QPO peak separation should be equal to the neutron star spin frequency , and should therefore be constant and nearly equal to . As we shall see in §5.5, it turned out that is not actually exactly constant nor precisely equal to (in §7 we examine how a beat-frequency interpretation could deal with this), and this triggered the development of other models for the kHz QPOs. Stella & Vietri (1998) noted that the frequency of low-frequency QPOs (§6.3) in the 15–60 Hz range that had been known in the Z sources since the 1980’s (cf. van der Klis 1995), and that were being discovered with RXTE in the atoll sources as well is approximately proportional to . This triggered a series of papers (Stella & Vietri 1998, 1999, Stella et al. 1999b) together describing what is now called the “relativistic precession model”, where is the orbital frequency at some radius in the disk and and are frequencies of general-relativistic precession modes of a free particle orbit at that radius (§7.2). For a further discussion of kHz QPO models see §7. With the exception of the photon bubble model (Klein et al. 1996b; §7.3), all models are based on the interpretation that one of the kHz QPO frequencies is an orbital frequency in the disk.
5.3 Dependence on source state and type
Twenty sources have now1111999 October 15 shown kHz QPOs. Sometimes only one peak is detectable, but 18 of these sources have shown two simultaneous kHz peaks; the exceptions with only a single peak are the little-studied XTE J1723376 and EXO 0748676. Tables 2 and 3 summarize the results. There is a remarkable similarity in QPO frequencies and peak separations across a great variety of sources.
| Source | References | ||||
| (Hz) | (Hz) | (Hz) | (Hz) | ||
| Sco X-1 | 565 | 870 | 3075 | Van der Klis et al. 1996a,b,c,1997b | |
| 845 | 1080 | 2375 | |||
| 1130 | |||||
| GX 51 | 215 | 505 | Van der Klis et al. 1996e | ||
| 660 | 890 | 29811 | Wijnands et al. 1998c | ||
| 700 | |||||
| GX 17+2 | 645 | Van der Klis et al. 1997a | |||
| 480 | 785 | Wijnands et al. 1997b | |||
| 780 | 1080 | 2948 | |||
| Cyg X-2 | 730 | Wijnands et al. 1998a | |||
| 530 | 855 | ||||
| 660 | 1005 | 34629 | |||
| GX 340+0 | 200 | 535 | Jonker et al. 1998, 1999c | ||
| 565 | 840 | 3398 | |||
| 625 | |||||
| GX 349+2 | 710 | 980 | 26613 | Zhang et al. 1998a | |
| 1020a | Kuulkers & van der Klis 1998 | ||||
Values for and were rounded to the nearest 5, for to the nearest 1 Hz. Entries in one column not separated by a horizontal line indicate ranges over which the frequency was observed or inferred to vary; ranges from different observations were combined assuming the , relation in each source is reproducible (no evidence to the contrary exists). Entries in one uninterrupted row refer to simultaneous data (except for values). Values of straddling two rows, or adjacent to a vertical line refer to measurements made over the range of frequencies indicated. Note: a Marginal detection.
| Source | References | ||||
| (Hz) | (Hz) | (Hz) | (Hz)d | ||
| 4U 0614+09 | 450 | Ford et al. 1996, 1997a,b; Van der Klis et al. 1996d; Méndez et al. 1997; Vaughan et al. 1997,1998; Kaaret et al. 1998; van Straaten et al. 1999 | |||
| 418 | 765 | ||||
| 825 | 1160 | 3122 | |||
| 1215 | |||||
| 1330 | |||||
| EXO 0748676 | 695 | J. Homan 1999, in prep. | |||
| 4U 160852 | 415 | Van Paradijs et al. 1996; Berger et al. 1996; Yu et al. 1997; Kaaret et al. 1998; Vaughan et al. 1997,1998; Méndez et al. 1998a,b, 1999; Méndez 1999; Markwardt et al. 1999b | |||
| 440 | 765 | 3257 | |||
| 475 | 800 | 3263 | |||
| 865 | 1090b | 22512b | |||
| 895 | |||||
| 4U 163653 | 830 | Zhang et al. 1996a,b,1997a; Van der Klis et al. 1996d; Vaughan et al. 1997,1998; Zhang 1997; Wijnands et al. 1997a; Méndez et al. 1998c; Méndez 1999; Markwardt et al. 1999b; Kaaret et al. 1999a | |||
| 900 | 1150 | ||||
| 950 | 1190 | 2514b | 291,582 | ||
| 1230 | |||||
| 1070 | |||||
| 4U 170243 | 625 | Markwardt et al. 1999a,b | |||
| 655 | 1000b | 3447b | |||
| 700 | 1040b | 3377b | 330 | ||
| 770 | 1085b | 31511b | |||
| 902 | |||||
| 4U 170544 | 775 | 1075a | 29811 | Ford et al. 1998a | |
| 870 | |||||
| XTE J1723376 | 815 | Marshall & Markwardt 1999 | |||
| 4U 172834 | 325 | Strohmayer et al. 1996a,b,c; Ford & van der Klis 1998; Méndez & van der Klis 1999; Méndez 1999; Markwardt et al. 1999b; di Salvo et al. 1999 | |||
| 510 | 845 | ||||
| 875 | 1160 | 3492c | 364 | ||
| 920 | 27912c | ||||
| KS 1731260 | 900 | 1160 | 26010 | 524 | Wijnands & van der Klis 1997 |
| 1205 | |||||
| 4U 173544 | 630 | 980 | 3417 | Wijnands et al. 1996a, 1998b; Ford et al. 1998b | |
| 730 | 1025 | 29612 | |||
| 900a | 1150 | 24915 | |||
| 1160 | |||||
| 4U 182030 | 655 | Smale et al. 1996, 1997; Zhang et al. 1998b; Kaaret et al. 1999b; Bloser et al. 1999 | |||
| 500 | 860 | 35842 | |||
| 795 | 1075 | 27811 | |||
| 1100 | |||||
| Aql X-1 | 670 | Zhang et al. 1998c; Cui et al. 1998a; Yu et al. 1999; Reig et al. 1999; M. Méndez et al. 1999 in prep. | |||
| 930 | 1040a | 2419a | 549 | ||
| 4U 1915-05 | 820 | Barret et al. 1997,1998; Boirin et al. 1999 | |||
| 515 | |||||
| 560 | 925 | ||||
| 655 | 1005 | 34811 | |||
| 705a | 1055 | ||||
| 880 | |||||
| 1265a | |||||
| XTE J2123058 | 845 | 1100 | 25514 | Homan et al. 1998b,1999a; Tomsick et al. 1999 | |
| 855 | 1130 | 2769 | |||
| 870a | 1140 | 2705a | |||
However, at a more detailed level there turn out to be differences between the different source types. The two main types are the Z sources and the atoll sources (Hasinger & van der Klis 1989, see van der Klis 1989a, 1995a,b for reviews). Z sources are named after the roughly Z-shaped tracks they trace out in X-ray color-color and hardness-intensity diagrams on a time scale of hours to days (Fig. 7). They are the most luminous LMXBs, with X-ray luminosity Lx near the Eddington luminosity LEdd. Atoll sources produce tracks roughly like a wide U or C (e.g., Fig. 7) which are somewhat reminiscent of a geographical map of an atoll because in the left limb of the U the motion through the diagram becomes slow, so that the track is usually broken up by observational windowing into “islands”. The bottom and right-hand parts of the U are traced out in the form of a curved “banana” branch on a time scale of hours to a day. In a given source, the islands correspond to lower flux levels than the banana branch. Most atoll sources are in the 0.01–0.2 LEdd range; a group of four bright ones (GX 3+1, GX 9+1, GX 13+1 and GX 9+9) that is nearly always in the banana branch is more luminous than this, perhaps 0.2–0.5 LEdd (the distances are uncertain). Most timing and spectral characteristics of these sources depend in a simple way on position along the Z or atoll track. So, the phenomenology is essentially one-dimensional. A single quantity, usually referred to as “inferred accretion rate”, varying on time scales of hours to days on the Z track and the banana branch, and more slowly in the island state must govern most of the phenomenology (but see §5.4).
 
|
In all Z sources and in 4U 172834 the kHz QPOs are seen down to the lowest inferred levels these sources reach. The QPOs always become undetectable at the highest levels. In the atoll sources, where the count rates are higher at higher inferred , this can not be a sensitivity effect. In most atoll sources, the QPOs are seen in the part of the banana branch closest to the islands, i.e., near the lower left corner of the U (Fig. 7); that they are often not detected in the island state may be related to low sensitivity at the low count rates there, but in one island in 4U 0614+09 the undetected lower kHz peak is really much weaker than at higher inferred (Méndez et al. 1997). No kHz QPOs have been seen in the four bright atoll sources (Wijnands et al. 1998d, Strohmayer 1998, Homan et al. 1998a), perhaps because they do not usually reach this low part of the banana branch, and in several faint LMXBs, probably also atoll sources in the island state (SAX J1808.43658; Wijnands & van der Klis 1998c and §3, XTE J1806246; Wijnands & van der Klis 1999b, SLX 1735269; Wijnands & van der Klis 1999c, 4U 174637; Jonker et al. 1999a, 4U 132362; Jonker et al. 1999b, 1E 17243045, SLX 1735269 and GS 1826238; Barret et al. 1999).
The QPO frequencies increase when the sources move along the tracks in the sense of increasing inferred (this has been seen in more than a dozen sources, and no counterexamples are known). On time scales of hours to a day increasing inferred usually corresponds to increasing X-ray flux, so on these time scales kHz QPO frequency usually increases with flux. When flux systematically decreases with inferred , as is the case in some parts of these tracks, the frequency is expected to maintain its positive correlation with inferred and hence become anticorrelated to flux, and indeed this has been observed in the Z source GX 17+2 (Wijnands et al. 1997b).
So, the kHz QPOs fit well within the pre-existing Z/atoll description of LMXB phenomenology in terms of source types and states, including the fact that position on the tracks in X-ray color-color or hardness-intensity diagrams (“inferred ”, see §5.4) and not X-ray flux drives the phenomenology.
5.4 Dependence of QPO frequency on luminosity and spectrum
Kilohertz QPOs occur at similar frequency in sources that differ in X-ray luminosity by more than 2 orders of magnitud, and the kHz QPO frequency seems to be determined more by the difference between average and instantaneous of a source than by itself (van der Klis 1997, 1998). In a plot of vs. Lx (defined as with the X-ray flux and the distance; Ford et al. 1999; Fig. 8) a series of roughly parallel lines is seen, to first order one line per source (but see below). In each source there is a definite relation between Lx and , but the same relation does not apply in another source with a different average Lx. Instead, that source covers the same -range around its particular average Lx. This is unexplained, and must mean that in addition to instantaneous Lx, another parameter, related to average Lx, affects the QPO frequency (van der Klis 1997, 1998). Perhaps this parameter is the neutron star magnetic field strength, which previously, on other grounds, was hypothesized to correlate to average Lx (Hasinger & van der Klis 1989, Psaltis & Lamb 1998, Konar & Bhattacharya 1999, see also Lai 1998), but other possibilities exist (van der Klis 1998, Ford et al. 1999).
 
|
A similar pattern of parallel lines, but on a much smaller scale, occurs in some individual sources. When observed at different epochs, a source produces different frequency vs. flux tracks that are approximately parallel (GX 51: Wijnands et al. 1998c; GX 340+0: Jonker et al. 1998; 4U 0614+09: Ford et al. 1997a,b, Méndez et al. 1997, van Straaten et al. 1999; 4U 160852: Yu et al. 1997, Méndez et al. 1998a, 1999; 4U 163653: Méndez 1999; 4U 172834: Méndez & van der Klis 1999; 4U 182030: Kaaret et al. 1999b; Aql X-1: Zhang et al. 1998c, Reig et al. 1999; Figs. 8 and 9). This is most likely another aspect of the well-known fact (e.g., van der Klis et al. 1990, Hasinger et al. 1990, Kuulkers et al. 1994, 1996, van der Klis 1994, 1995a) that while the properties of timing phenomena such as QPOs are well correlated with one another and with X-ray spectral shape as diagnosed by X-ray colors (and hence with position in tracks in color-color diagrams) the flux correlates well to these diagnostics only on short (hours to days) time scales and much less well on longer time scales. This is why color-color diagrams, independent of flux, are popular for parametrizing spectral variability in these sources. Similarly to other timing parameters, kHz QPO frequency correlates much better with position on the track in the color-color diagram (Fig. 9) than with flux. Correlations of frequency with parameters describing spectral shape such as blackbody flux (Ford et al. 1997b) or power-law slope (Kaaret et al. 1998) in a two-component spectral model are also much better than with flux.
 
|
Usually, all this has been interpreted by saying that apparently inferred accretion rate (§5.3) governs both the timing and the spectral properties, but not flux (e.g., van der Klis 1995a). Of course, energy conservation suggests total and flux should be well correlated. Perhaps, inferred is not the total but only one component of it, i.e., that through the disk, while there is also a radial inflow (e.g. Fortner et al. 1989, Kuulkers & van der Klis 1995, Wijnands et al. 1996b, Kaaret et al. 1998), maybe there are large and variable anisotropies or bolometric corrections in the emission, so that the flux we measure is not representative for the true luminosity (e.g., van der Klis 1995a), or possibly mass outflows destroy the expected correlation by providing sinks of both mass and (kinetic) energy (e.g., Ford et al. 1999). The true explanation is unknown. We do not even know if the two different parallel-lines phenomena (across sources and within individual sources; Fig. 8) have the same origin. It is possible that the quantity that everything depends on is not , but some other parameter such as inner disk radius .
5.5 Peak separation and burst oscillation frequencies
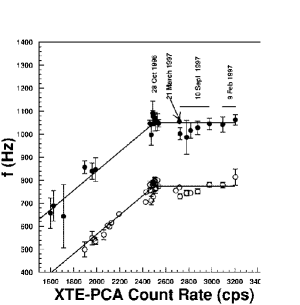
In interpretations (§5.1, 7.1) where the kHz peak separation is the neutron star spin frequency one expects to be approximately constant. This is not the case (Fig. 10). In Sco X-1 (van der Klis 1996c, 1997b), 4U 160852 (Méndez et al. 1998a,b), 4U 173544 (Ford et al. 1998b), 4U 172834 (Méndez & van der Klis 1999) and marginally also 4U 170243 (Markwardt et al. 1999a) the separation decreases considerably when the kHz QPO frequencies increase. Other sources may show similar variations (see also Psaltis et al. 1998). In a given source the , relation seems to be reproducible.
 
|
That , by interpretation close to (§4), is close to (or ) is the most direct evidence for a beat frequency interpretation of the kHz QPOs (§5.1). The evidence for this is summarized in Table 4, where the highest asymptotic burst frequency (likely to be closest to the spin frequency; §4) is compared to the largest well-measured in the five sources where both have been measured. The frequency ratio may cluster at 1 and 2, but a few more examples are clearly needed; in two sources discrepancies of 15% occur between and . Of these five sources, 4U 172834 also has a measured variation (Fig. 10). When the QPO frequency drops, increases, to saturate 4% below the burst oscillation frequency (Méndez & van der Klis 1999). It certainly seems here as if the kHz QPO separation “knows” the value of the burst oscillation frequency.
| Source | Highest | Highest | Ratio | Discrepancy | References |
| () | |||||
| (Hz) | (Hz) | (%) | |||
| 4U 170243 | 330.550.02 | 3447 | 0.960.02 | 42 | 1 |
| 4U 172834 | 364.230.05 | 349.31.7 | 1.0430.005 | +4.30.5 | 2 |
| KS 1731260 | 523.920.05 | 26010 | 2.0150.077 | +0.73.8 | 3 |
| Aql X-1 | 548.9 | 2419a | 2.280.09a | +145a | 4 |
| 4U 163653 | 581.750.13 | 2545 | 2.290.04 | +152 | 5 |
a Based on a marginal detection (see Table 3). References: [1] Markwardt et al. 1999a [2] Méndez & van der Klis 1999 [3] Wijnands & van der Klis 1997 [4] M. Méndez et al. 1999 in prep. [5] Méndez et al. 1998c
5.6 Strong gravity and dense matter
Potentially kHz QPOs can be used to constrain neutron-star masses and radii, and to test general relativity. Detection of the predcited innermost stable circular orbit (ISCO, §5.1) would constitute the first direct detection of a strong-field general-relativistic effect and prove that the neutron star is smaller than the ISCO. This possibility has fascinated since the beginning and was discussed well before the kHz QPOs were found (Kluźniak and Wagoner 1985, Paczynski 1987, Kluźniak et al. 1990, Kluźniak & Wilson 1991, Biehle & Blandford 1993). If a kHz QPO is due to orbital motion around the neutron star, its frequency can not be larger than the frequency at the ISCO. Kaaret et al. (1997) proposed that kHz QPO frequency variations that then seemed uncorrelated to X-ray flux in 4U 160852 and 4U 163653 were due to orbital motion near the ISCO and from this derived neutron star masses of 2M⊙. However, from more detailed studies (§5.4) it is clear now that on short time scales frequency does in fact correlate to flux in these sources.
The maximum kHz QPO frequencies observed in each source are constrained to a narrow range. The 12 atoll sources with twin peaks have maximum values in the range 1074–1329 Hz; among the Z sources there are two cases of much lower maximum values (900 Hz in GX 51 and GX 340+0), while the other four fit in. Zhang et al. (1997b) proposed that this narrow distribution is caused by the limit set by the ISCO frequency, which led them to neutron star masses near 2M⊙ as well. It is in principle possible that the maximum is set by some other limit on orbital radius (e.g., the neutron star surface), or that it is caused by the ISCO, but the frequency we observe is not orbital, in which cases no mass estimate can be made.
|
Miller et al. (1996, 1998a) suggested that when the inner edge of the accretion disk reaches the ISCO, the QPO frequency might level off and remain constant while continues rising. Later, an apparent leveling off at =106020 Hz with X-ray count rate was found in 4U 182030 (Zhang et al. 1998b; Fig. 11, left). If this is the orbital frequency at the ISCO, then the neutron star has a mass mass of 2.2M⊙ and is smaller than its ISCO, and many equations of state are rejected. The leveling off is also observed as a function of X-ray flux and color (Kaaret et al. 1999b) and position along the atoll track (Bloser et al. 1999). However, the frequency vs. flux relations are known in other sources (§5.4) to be variable, and in 4U 182030 the leveling off seems not to be reproduced in the same way in all data sets (M. Méndez et al. in prep.; Fig. 11, right). It may also be more gradual in nature than originally suggested. No evidence for a similar saturation in frequency was seen in other sources, and most reach higher frequencies. Possibly, the unique aspects of the 4U 182030 system are related to this (it is an 11-min binary in a globular cluster with probably a pure He companion star; Stella et al. 1987a).
If a kHz QPO peak at frequency corresponds to stable Keplerian motion around a neutron star, one can immediately set limits on neutron star mass and radius (Miller et al. 1998a). For a Schwarzschild geometry: (1) the radius of the star must be smaller than the radius of the Keplerian orbit: , and (2) the radius of the ISCO (§5.1) must also be smaller than , as no stable orbit is possible within this radius: or . Condition (1) is a mass-dependent upper limit on , and condition (2) an upper limit on ; neither limit requires detection of orbital motion at the ISCO. Fig. 12 (left) shows these limits in the neutron star mass-radius diagram for Hz, plus an indication of how the excluded area (hatched) shrinks for higher values of . The currently highest value of , identified in most models with the orbital frequency, is 13294 Hz (van Straaten et al. 1999), so the hardest equations of state are beginning to be imperiled by the method. Corrections for frame dragging (shown to first order in [§5.1, right] in Fig. 12) expand the allowed region. They depend on the neutron star spin rate , and somewhat on the neutron star model, which sets the relation between and angular momentum. For 1329 Hz the above equations imply M⊙ and km; with corrections for a 300 Hz spin these numbers become 1.9M⊙ and 15.2 km (van Straaten et al. 1999). Calculations exploring to what extent kHz QPOs constrain the EOS have further been performed by Miller et al. (1998b), Datta et al. (1998), Akmal et al. (1998), Kluźniak (1998), Bulik et al. (1999), Thampan et al. (1999), Li et al. (1999b), Schaab & Weigel (1999) and Heiselberg & Hjorth-Jensen (1999).
 
|
If is near then the 18 neutron stars where this quantity has been measured all spin at frequencies between 240 and 360 Hz, a surprisingly narrow range. If the stars spin at the magnetospheric equilibrium spin rates (e.g., Frank et al. 1992) corresponding to their current luminosities Lx, this would imply an unlikely, tight correlation between Lx and neutron-star magnetic-field strength (White & Zhang 1997; note that a similar possibility came up in the discussion about the uniformity of the QPO frequencies themselves, §5.4). White & Zhang (1997) propose that when is small, as is the case here, it depends only weakly on accretion rate (as it does in some inner disk models; cf. Ghosh & Lamb 1992, Psaltis & Chakrabarty 1999). Another possibility is that the spin frequency of accreting neutron stars is limited by gravitational radiation losses (Bildsten 1998a, Andersson et al. 1999, see also Levin 1999). If so, then gravitational radiation is transporting angular momentum out as fast as accretion is transporting it in, making these sources the brightest gravitational radiation sources in the sky. They would produce a periodic signature at the neutron star spin frequency, which would facilitate their detection.
5.7 Other kilohertz QPO properties
The amplitudes of kHz QPOs increase strongly with photon energy (Fig. 13). In similar X-ray photometric bands the QPOs tend to be weaker in the more luminous sources, with 2–60 keV amplitudes ranging from as high as 15% (rms) in 4U 0614+09, to typically a few % (rms) at their strongest in the Z sources. At high energy amplitudes are much higher (e.g., 40% rms above 16 keV in 4U 0614+09; Méndez et al. 1997). Fractional rms usually decreases with inferred (e.g., van der Klis et al. 1996b, 1997b, Berger et al. 1996) but more complex behavior is sometimes seen (e.g., di Salvo et al. 1999). The measured widths of QPO peaks are affected by variations in centroid frequency during the measurement, but typical values in the Z sources are 50–200 Hz. In the atoll sources, the upper peak usually has a width similar to this, although occasionally peaks as narrow as 10 or 20 Hz have been measured (eg. Wijnands & van der Klis 1997, Wijnands et al. 1998a,b) but the lower peak is clearly much narrower. It is rarely as wide as 100 Hz (Méndez et al. 1997) and sometimes as narrow as 5 Hz (e.g., Berger et al. 1996, Wijnands et al. 1998b). Various different peak width vs. inferred relations have been seen, but there seems to be a tendency for the upper peak to become narrower as its frequency increases.
 
|
A strong model constraint is provided by the time lags between kHz QPO signals in different energy bands (§2). Time-lag measurements require very high signal-to-noise ratios (Vaughan et al. 1997), and have mostly been made in the very significant lower peaks observed in some atoll sources. Finite lags of 10–60sec occur in these peaks (Vaugan et al. 1997, 1998, Kaaret et al. 1999a, Markwardt et al. 1999b; see Lee & Miller 1998 for a calculation of Comptonization lags relevant to kHz QPOs). Contrary to the initial report, the low-energy photons lag the high-energy ones (these are “soft lags”) by increasing amounts as the photon energy increases (Fig. 13). The lags are of opposite sign to those expected from the inverse Compton scattering thought to produce the hard spectral tails of these sources (e.g., Barret & Vedrenne 1994), and correspond to light travel distances of only 3–20 km. From this it seems more likely that the lags originate in the QPO production mechanism than in propagation delays. Markwardt et al. (1999b) reported a possible hard lag in an atoll-source upper peak.
6 Correlations with low-frequency timing phenomena and with other sources
6.1 Black hole candidates
The only oscillations with frequencies exceeding 102.5 Hz (§1) known in black hole candidates (BHCs) are, marginally, the 100–300 Hz oscillations in GRO J165540, and XTE J1550564, and those reported very recently in Cyg X-1 and 4U 163047. An oscillation near 67 Hz observed in GRS 1915+105 is usually discussed together with these QPOs, although it is not clear that it is related. Usually, the phenomenology accompanying these high-frequency QPOs (spectral variations, lower-frequency variations) is complex.
The 67 Hz QPO in GRS 1915+105 (Morgan et al. 1997, Remillard & Morgan 1998) varies by only a few percent in frequency when the X-ray flux varies by a factor of several. It is relatively coherent, with Q usually around 20 (but sometimes dropping to 6; Remillard et al. 1999a), has an rms amplitude of about 1%, and the signal at high photon energy lags that at lower energy by up to 2.3 radians (Cui 1999). The 300 Hz QPO in GRO J165540 (Remillard et al. 1999b) was seen only when the X-ray spectrum was dominated by a hard power law component. This feature was relatively broad (Q4) and weak (0.8% rms), and did not vary in frequency by more than 30 Hz. The 185–285 Hz QPO in XTE J1550564 (Remillard et al. 1999c) shows considerable variations in frequency (Homan et al. 1999b, Remillard et al. 1999c). It is seen in similar X-ray spectral conditions as the 300 Hz QPO in GRO J165540, has similarly low amplitudes and 3Q10. Recent reports indicate that QPOs in this frequency range also occur in Cyg X-1 and 4U 163047 (Remillard 1999a,b).
The fact that the 300 and 67 Hz oscillations were constant in frequency (different from anything then known to occur in neutron stars) triggered interpretations where these frequencies depend mostly on black-hole mass and angular momentum and only weakly on luminosity, such as orbital motion at the ISCO (Morgan et al. 1997), Lense-Thirring precession there (Cui et al. 1998c, see also Merloni et al. 1999) or trapped-mode disk oscillations (Nowak et al. 1997). However, the variations in frequency of the QPO in XTE J1550564 have cast some doubt on the applicability of such models.
As is well known, strong similarities exist with respect to many spectral and timing phenomena between low-magnetic-field neutron stars and BHCs (e.g., van der Klis 1994a,b; §6.3). While the 100–300 Hz oscillations may be related to the kHz QPOs observed in neutron stars (Psaltis et al. 1999a; see §6.3), there could also be a relation with the recently reported relatively stable QPO peaks near 100 Hz in 4U 0614+09 and 4U 172834 (van Straaten et al. 1999, di Salvo et al. 1999), which are clearly distinct from kHz QPOs. More work clearing up the exact phenomenology and more observations of black-hole transients leading to more examples of high frequency QPOs are clearly needed.
6.2 Cen X-3
The detection of QPO features near 330 and 760 Hz in the 4.8 s accreting pulsar Cen X-3 was recently reported by Jernigan et al. (1999). This is the first report of millisecond oscillations from a high-magnetic-field (1012 Gauss) neutron star. The QPO features are quite weak. Jernigan et al. (1999) carefully discuss the instrumental effects, which are a concern at these low power levels and interpret their results in terms of the photon bubble model (§7.3).
6.3 Low-frequency phenomena
Low-frequency (100 Hz) QPOs have been studied in accreting neutron stars and black hole candidates since the 1980’s, mostly with the EXOSAT and Ginga satellites (see van der Klis 1995a). Two different ones were known in the Z sources, the 6-20 Hz so-called normal and flaring-branch oscillation (NBO; Middleditch & Priedhorsky 1986) and the 15–60 Hz so-called horizontal branch oscillation (HBO; van der Klis et al. 1985). The frequency of the HBO turned out to correlate well to those of the kHz QPOs (Fig. 15; van der Klis et al. 1997b, Wijnands et al. 1997b,1998a,c, Jonker et al. 1998, 1999c), and the same is true for the NBO in Sco X-1 (van der Klis et al. 1996b). Broad power-spectral bumps and, rarely, low-frequency QPOs were know in atoll sources as well (Lewin et al. 1987, Stella et al. 1987b, Hasinger & van der Klis 1989, Dotani et al. 1989, Makishima et al. 1989, Yoshida et al. 1993). With RXTE, QPOs similar to HBO are often seen (Strohmayer et al. 1996b, Wijnands & van der Klis 1997, Wijnands et al. 1998b, Homan et al. 1998a) and their frequencies also correlate well to kHz QPO frequency (Fig. 15; Stella & Vietri 1998, Ford & van der Klis 1998, Markwardt et al. 1999a, van Straaten et al. 1999, di Salvo et al. 1999, Boirin et al. 1999). It is not sure yet wether these atoll QPOs are physically the same as HBO in Z sources but this seems likely.
 |
It is possible that these correlations arise just because all QPO phenomena depend on a common parameter (e.g. inferred , §5.4), but Stella & Vietri (1998) proposed that their origin is a physical dependence of the frequencies on one another (§7.2). In their relativistic precession model the HBO and the similar-frequency QPOs in the atoll sources are the same phenomenon, and their frequency is predicted to be proportional to . This is indeed approximately true in all Z sources except Sco X-1 (Psaltis et al. 1999b), as well as in the atoll sources (references above). Psaltis et al. (1999b) argue that a combination of the sonic-point and magnetospheric beat-frequency models can explain these correlations as well (§7.1).
 
|
Additional intriguing correlations exist between kHz QPOs and low-frequency phenomena which may link neutron stars and BHCs. It is useful to first examine a correlation between two low-frequency phenomena. At low , BHCs and atoll sources (van der Klis 1994a and references therein), the millisecond pulsar SAX J1808.4-3658 (§ 3; Wijnands & van der Klis 1998c), and perhaps even Z sources have very similar power spectra (Fig. 14; Wijnands & van der Klis 1999a), with a broad noise component that shows a break at low frequency and often a QPO-like feature above the break. Break and QPO frequency both vary in excellent correlation (Fig. 15, left), and similarly in neutron stars and BHCs. This suggests that (with the possible exception of the Z sources, which are slightly off the main relation) these two phenomena are the same in neutron stars and black holes. This would exclude spin-orbit beat-frequency models and any other models requiring a material surface, an event horizon, a magnetic field, or their absence, and would essentially imply the phenomena are generated in the accretion disk around any low-magnetic field compact object.
The good correlations between kHz QPOs and low-frequency phenomena in Z and atoll sources suggest that kHz QPOs might also fit in with schemes linking neutron stars and BHCs (§6.1). However, no twin kHz QPOs have been reported from BHCs. Psaltis et al. (1999a) pointed out that many Z and atoll sources, the peculiar source Cir X-1 and a few low luminosity neutron stars and BHCs sometimes show two QPO or broad noise phenomena whose centroid frequencies, when plotted vs. each other, seem to line up (Fig. 15, right). This suggests that perhaps “kHz QPOs” do occur in BHCs, but as features at frequencies below 50 Hz. These features have very low Q, and although the data are suggestive they are not conclusive. The implication would be that the lower kHz QPO peak (whose frequency is the one that lines up with those seen in the BHCs) is not unique to neutron stars, but a feature of disk accretion not related to neutron star spin. The coincidence of kHz QPO frequencies with burst oscillation frequencies (§4, §5.1) would then require some other explanation. Orbital motion in the disk would remain an attractive interpretation for some of the observed frequencies. Stella et al. (1999b) showed that for particular choices of neutron star and black hole angular momenta their relativistic precession model can fit these data. The phenomenology is quite complex; in particular, no way has been found yet to combine the Wijnands & van der Klis (1999a) work with the Psaltis et al. (1999a) results in a way that works across all source types. New low-frequency phenomena are still being discovered as well (di Salvo et al. 1999, Jonker et al. 1999c).
7 Kilohertz QPO models
The possibility to derive conclusions of a fundamental nature has led to a relatively large number of models for kHz QPOs. Most, but not all of these involve orbital motion around the neutron star. It is beyond the scope of the present work to provide an in-depth discussion of each model. Instead, I point out some of the main issues, and provide pointers to the literature.
In early works, the magnetospheric beat-frequency model was implied when beat-frequency models were mentioned (e.g., van der Klis et al. 1996b, Strohmayer et al. 1996c), but this model has not recently been applied much to kHz QPOs; see however Cui et al. (1998a). Most prominent recently have been the sonic point beat-frequency model of Miller et al. (1996, 1998a) and the relativistic precession model of Stella and Vietri (1998, 1999), but also the the photon bubble model (Klein et al. 1996b) and the disk transition layer models (Titarchuk et al. 1998, 1999) have been strongly argued for. Additional disk models have been proposed as well (§7.4). Neutron star oscillations have been considered (Strohmayer et al. 1996c, Bildsten et al. 1998, Bildsten & Cumming 1998), but probably can not produce the required combination of high frequencies and rapid changes in frequency.
Most models have evolved in response to new observational results. The sonic point model was modified to accommodate the observed deviations from a pure beat-frequency model (§5.5; Lamb & Miller 1999, Miller 1999c), the relativistic precession model initially explained the lower kHz peak as a spin/orbit beat frequency (Stella & Vietri 1998) and only later by apsidal motion (Stella & Vietri 1999), the photon bubble model is based on numerical simulations which in time have become more similar to what is observed (R Klein, priv. comm.), and also the disk transition layer models have experienced considerable evolution (e.g., Osherovich & Titarchuk 1999).
The relativistic precession model makes the strongest predictions with respect to observable quantities and hence allows the most direct tests, but the near-commensurability of kHz QPO and burst oscillation frequencies (§5.5) is unexplained in that model. The sonic-point model provides specific mechanisms to modulate the X-rays and to make the frequency vary with mass-accretion rate. Other models usually discuss at least one of these issues only generically (usually in terms of self-luminous and/or obscuring blobs, and arbitrary preferred radii in the accretion disk).
7.1 The sonic point beat-frequency model
Beat-frequency models involve orbital motion at some preferred radius in the disk (§5.1). A beat-frequency model which uses the magnetospheric radius was proposed by Alpar & Shaham (1985) to explain the HBO in Z sources (§6.3; see also Lamb et al. 1985). In the Z sources HBO and kHz QPOs have been seen simultaneously, so at least one additional model is required.
Miller et al. (1996, 1998a) suggest to continue to use the magnetospheric model for the HBO (see also Psaltis et al. 1999b), and for the kHz QPOs propose the sonic-point beat-frequency model. In this model the preferred radius is the sonic radius , where the radial inflow velocity becomes supersonic. This radius tends to be near (§5.1) but radiative stresses change its location, as required by the observation that the kHz QPO frequencies vary. Comparing the HBO and kHz QPO frequencies, clearly , so part of the accreting matter must remain in near-Keplerian orbits well within .
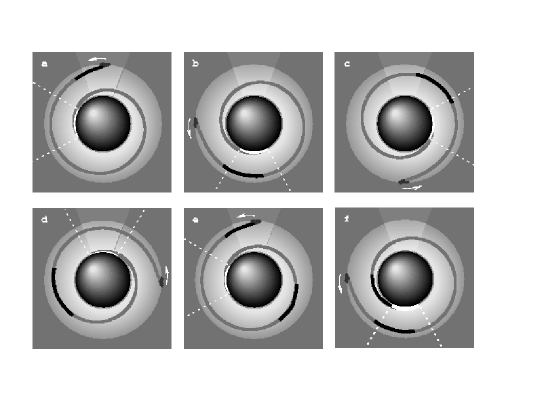 |
At orbiting clumps form whose matter gradually accretes onto the neutron star following a fixed spiral-shaped trajectory in the frame corotating with their orbital motion (Fig. 16). At the “footpoint”of a clump’s spiral flow the matter hits the surface and emission is enhanced. The footpoint travels around the neutron star at the clump’s orbital angular velocity, so the observer sees a hot spot move around the surface with the Keplerian frequency at . This produces the upper kHz peak at . The high Q of the QPO implies that all clumps are near one precise radius and live for several 0.01 to 0.1 s, and allows for relatively little fluctuations in the spiral flow. The beat frequency at occurs because a beam of X-rays generated by accretion onto the magnetic poles sweeps around at the neutron star spin frequency and hence irradiates the clumps at once per beat period, which modulates, at the beat frequency, the rate at which the clumps provide matter to their spiral flows and consequently the emission from the footpoints.
So, the model predicts to be constant at , contrary to observations (§5.5). However, if the clumps’ orbits gradually spiral down, then the observed beat frequency will be higher than the actual beat frequency at which beam and clumps interact, because then during the clumps’ lifetime the travel time of matter from clump to surface gradually diminishes. This puts the lower kHz peak closer to the upper one, and thus decrease , more so when at higher due to stronger radiation drag the spiralling-down is faster, as observed (Lamb & Miller 1999, Miller 1999). As the exact way in which this affects the relation between the frequencies is hard to predict, this makes testing the model more difficult. A remaining test is that a number of specific additional frequencies is predicted to arise from the beat-frequency interaction (Miller et al. 1998a), which are different from additional frequencies in, e.g., the relativistic precession model.
7.2 The relativistic precession model
Inclined eccentric free-particle orbits around a spinning neutron star show both nodal precession (a wobble of the orbital plane) due to relativistic frame dragging (Lense & Thirring 1918), and relativistic periastron precession similar to Mercury’s (Einstein 1915). The relativistic precession model (Stella & Vietri 1998, 1999) identifies with the frequency of an orbit in the disk and and the frequency of one of the observed low-frequency (10–100 Hz) QPO peaks (§6.3) with, respectively, periastron precession and nodal precession of this orbit.
To lowest order, the relativistic nodal precession is and the relativistic periastron precession causes the kHz peak separation to vary as , where is the star’s moment of inertia and the orbital radius (Stella et al. 1998, 1999; see also Marković & Lamb 1998). Stellar oblateness affects both precession rates and must be corrected for (Morsink & Stella 1999, Stella et al. 1999b). For acceptable neutron star parameters, there is an approximate match (e.g., Fig. 17) with the observed , and relations if is twice (or perhaps sometimes four times) the nodal precession frequency, which could in principle arise from a warped disk geometry (Morsink & Stella 1999). In this model the neutron star spin frequencies do not cluster in the 250–350 Hz range (§5.6) and and are not expected to be equal as in beat-frequency interpretations. A clear prediction is that should decrease not only when increases (as observed) but also when it sufficiently decreases (Fig. 17).
 
|
For a precise match between model and observations, additional free parameters are required. Stella & Vietri (1999) propose that the orbital eccentricity systematically varies with orbital frequency. A critical discussion of the degree to which the precession model and the beat-frequency model can each fit the data can be found in Psaltis et al. (1999b). Vietri & Stella (1998) and Armitage et al. (1999) have performed calculations relevant to the problem of sustaining the tilted orbits required for Lense-Thirring precession in a viscous disk, where the Bardeen-Petterson effect (1975) drives the matter to the orbital plane. Karas (1999a,b) calculated frequencies and light curves produced by clumps orbiting the neutron star in orbits similar to the ones discussed here. Miller (1999d) calculated the effects of radiation forces on Lense-Thirring precession. Kalogera & Psaltis (1999) explored how the Lense-Thirring precession interpretation constrains neutron star structure.
Relatively high neutron star masses (1.8–2M⊙), relatively stiff equations of state, and neutron star spin frequencies in the 300–900 Hz range follow from this model. Because it requires no neutron star, but only a relativistic accretion disk to work, the model can also be applied to black holes. Stella et al. (1999b) propose it explains the frequency correlations discussed in §6.3 (Fig. 17).
The idea that the three most prominent frequencies observed are in fact the three main general-relativistic frequencies characterizing a free-particle orbit is fascinating. However, questions remain. How precessing and eccentric orbits can survive in a disk is not a priori clear (see Psaltis & Norman 1999 for a possible way to obtain these frequencies from a disk). How the flux is modulated at the predicted frequencies, why the basic, orbital, frequency varies with luminosity, and how the burst oscillations fit in are all open questions. With respect to the burst oscillations the model requires other explanations than neutron star spin (§4) and these are being explored (Stella 1999, Kluźniak 1999, Psaltis & Norman 1999).
7.3 Photon bubble model
A model based on numerical radiation hydrodynamics was proposed by Klein et al. (1996b) for the kHz QPOs in Sco X-1. In this model accretion takes place by way of a magnetic funnel within which accretion is super-Eddington, so that photon bubbles form which rise up by buoyancy and burst at the top in quasi-periodic sequence. In some of the simulations one or two strong QPO peaks are found, whose frequencies increase with accretion rate, as observed (R. Klein, priv. comm.). The model stands out by not requiring rotational phenomena to explain the QPOs, and does not naturally produce beat frequencies. In recent work, attention with respect to this model has shifted to the classical accreting pulsars for which it was originally conceived (Klein et al. 1996a; §6.2).
7.4 Disk mode models
In several models the observed frequencies are identified with oscillation modes of an accretion disk. From an empirical point of view, these models fall into two classes. Some can be seen as “implementations” of a beat-frequency (e.g. Alpar et al 1997) or a precession (Psaltis & Norman 1999) model that they provide ways in accretion disk physics to produce signals at the frequencies occurring in those models. Others produce new frequencies. In all disk models one of the two kHz QPOs is a Keplerian orbital frequency at some radius in the disk.
The disk transition layer models (Titarchuk & Muslimov 1997, Titarchuk et al. 1998,1999, Osherovich & Titarchuk 1999a,b, Titarchuk & Osherovich 1999) have evolved into a description (the “two-oscillator model”) where is identified with the Keplerian frequency at the outer edge of a viscous transition layer between Keplerian disk and neutron-star surface. Oscillations in this layer occur at two low frequencies, producing the noise break and a low frequency QPO (§6.3). Additionally, blobs described as being thrown out of this layer into a magnetosphere oscillate both radially and perpendicular to the disk, producing two harmonics of another low-frequency QPO (in the Z sources this is the HBO) as well as the upper kHz peak. So, altogether this description provides six frequencies which can all fit observed frequencies. Further work on disk oscillations was performed by Lai (1998, 1999), Lai et al. (1999) and Ghosh (1998; see also Moderski & Czerny 1999).
8 Final remark
RXTE has opened up a window that allows us to see down to the very bottoms of the potential wells of some neutron stars and perhaps to near to the horizons of some black holes. Three millisecond phenomena have been found, whose interpretation relies explicitly on our description of strong-field gravity and neutron-star structure. In order to take full advantage of this, it will be necessary to observe the new phenomena with larger instruments (in the 10 m2 class). This will allow to follow the motion of clumps of matter orbiting in strong gravity and of hot spots corotating on neutron star surfaces and thereby to to map out curved spacetime near accreting compact objects and measure parameters such as the compactness of neutron stars and the spin of black holes.
Acknowledgements: It is a pleasure to acknowledge the help of many colleagues who either made data available before publication, sent originals of figures, read versions of the manuscript or provided insightful discussion: Didier Barret, Lars Bildsten, Deepto Chakrabarty, Wei Cui, Eric Ford, Peter Jonker, Richard Klein, Fred Lamb, Phil Kaaret, Craig Markwardt, Mariano Méndez, Cole Miller, Mike Nowak, Dimitrios Psaltis, Luigi Stella, Tod Strohmayer, Rudy Wijnands and Will Zhang. This work was supported in part by the Netherlands Organization for Scientific Research (NWO) and the Netherlands Research School for Astronomy (NOVA).
Literature cited
References
- [1] Akmal A, Pandharipande VR, Ravenhall DG. 1998. Phys. Rev. C 58:1804–28
- [2] Alpar MA, Cheng AF, Ruderman MA, Shaham J. 1982. Nature 300:728–30
- [3] Alpar MA, Shaham J. 1985. Nature 316:239–41
- [4] Alpar MA, Yılmaz A. 1997. New Astr. 2:225–38
- [5] Andersson N, Kokkotas KD, Stergioulas N. 1999. ApJ 516:307–14
- [6] Armitage PJ, Natarajan P. 1999, ApJ 525:909–14
- [7] Bardeen JM, Petterson JA. 1975. ApJ 195:L65–67
- [8] Barret D, Olive JF, Boirin L, Done C, Skinner GK, Grindlay JE. 1999. ApJ in press. astro-ph/9911042
- [9] Barret D, Olive JF, Boirin L, Grindlay JE, Bloser PF, et al. 1997. IAU Circ. No. 6793
- [10] Barret D, Vedrenne G. 1994. ApJS 92:505–10
- [11] Berger M, van der Klis M, van Paradijs J, Lewin WHG, Lamb F, et al. 1996. ApJ 469:L13-16
- [12] Bhattacharya D, van den Heuvel EPJ. 1991. Phys. Rep. 203:1–124
- [13] Biehle GT, Blandford RD. 1993. ApJ 411:302–312
- [14] Bildsten L. 1995. ApJ 438:852–75
- [15] Bildsten L. 1998a. ApJ 501:L89–93
- [16] Bildsten L. 1998b. The Many Faces of Neutron Stars, NATO ASI, Lipari, C515:419–49. Dordrecht: Kluwer
- [17] Bildsten L, Cumming A. 1998. ApJ 506:842–62
- [18] Bildsten L, Cumming A, Ushomirsky G, Cutler C. 1998. ASP Conf. Proc. 135:437–
- [19] Bloser PF, Grindlay JE, Kaaret P, Smale AP, Barret D. 1999. ApJ submitted
- [20] Boirin L, Barret D, Olive JF, Grindlay JE, Bloser PF. 1999. A&A submitted
- [21] Bradt HV, Rothschild RE, Swank JH. 1993. A&AS97:355
- [22] Bulik T, Godek-Rosińska D, Kluźniak W. 1999. A&A 344:L71-74
- [23] Burderi L, King AR. 1999. ApJ 505:L135–37
- [24] Cook GB, Shapiro SL, Teukolsky SA. 1994. ApJ 424:823–45
- [25] Cui W. 1999. ApJ 524:L59–62
- [26] Cui W, Barret D, Zhang SN, Chen W, Boirin L, Swank J. 1998a. ApJ 502:L49–53
- [27] Cui W, Morgan EH, Titarchuk LG. 1998b. ApJ 504:L27–30
- [28] Cui W, Zhang SN, Chen W. 1998c. ApJ 492:L53–57
- [29] Chakrabarty D, Morgan EH. 1998a. IAU Circ. No. 6877
- [30] Chakrabarty D, Morgan EH. 1998b. Nature 394:346–48
- [31] Datta B, Thampan AV, Bombaci I. 1998. A&A 334:943–52
- [32] Di Salvo T, Méndez M, van der Klis M, Ford E, Robba NR. 1999. ApJ submitted
- [33] Dotani T, Mitsuda K, Makishima K, Jones MH. 1989. PASJ 41:577–89
- [34] Einstein A. 1915. Preuss. Akad. Wiss. Berlin, Sitzber. 47:831–39
- [35] Ford EC. 1999. ApJ 519:L73–75
- [36] Ford EC, Kaaret P, Chen K, Tavani M, Barret D, et al. 1997b. ApJ 486:L47–50
- [37] Ford E, Kaaret P, Tavani M, Barret D, Bloser P, et al. 1997a. ApJ 475:L123–26
- [38] Ford E, Kaaret P, Tavani M, Harmon BA, Zhang SN, et al. 1996. IAU Circ. No. 6426
- [39] Ford EC, van der Klis M. 1998. ApJ 506:L39–42
- [40] Ford EC, van der Klis M, Kaaret P. 1998a. ApJ 498:L41–44
- [41] Ford EC, van der Klis M, Méndez M, Wijnands R, Homan J, et al. 1999. ApJ submitted
- [42] Ford EC, van der Klis M, van Paradijs J, Méndez M, Wijands R, Kaaret P. 1998b. ApJ 508:L155–58
- [43] Fortner B, Lamb FK, Miller GS. 1989. Nature 342:775–77
- [44] Fox DW, Lewin WHG, et al. 1999. IAU Circ. No. 7081
- [45] Frank J, King A, Raine D. 1992. Accretion Power in Astrophysics pp. 294, Cambridge:Cambridge Univ. Press.
- [46] Gaensler BM, Stappers BW, Getts TJ. 1999. ApJ 522:L117–19
- [47] Ghosh P. 1998. ApJ 506:L109–12
- [48] Ghosh P, Lamb FK. 1992. X-Ray Binaries and Recycled Pulsars, NATO ASI, Santa Barbara. C377:487–510. Dordrecht:Kluwer
- [49] Giles AB, Hill KM, Greenhill JG. 1999. MNRAS 304:47–51
- [50] Gilfanov M, Revnivtsev M, Sunyaev R, Churazov E. 1998. A&A 338:L83–86
- [51] Hasinger G, van der Klis M. 1989. A&A 225:79–96
- [52] Hasinger G, van der Klis M, Ebisawa K, Dotani T, Mitsuda K. 1990. A&A 235:131–46
- [53] Heindl WA, Smith DM. 1998. ApJ 506:L35–38
- [54] Heiselberg H, Hjorth-Jensen M. 1999. ApJ 525:L45–48
- [55] Homan J, Méndez M, Wijnands R, van der Klis M, van Paradijs J. 1999a. ApJ 513:L119–20
- [56] Homan J, van der Klis M, van Paradijs J, Méndez M. 1998b. IAU Circ. No. 6971
- [57] Homan J, van der Klis M, Wijnands R, Vaughan B, Kuulkers K. 1998a. ApJ 499:L41–44.
- [58] Homan J, Wijnands R, van der Klis M. 1999b. IAU Circ. No. 7121
- [59] in ’t Zand JJM, Heise J, Muller JM, Bazzano A, Cocchi M, et al. 1998. A&A 331:L25–28
- [60] Jernigan JG, Klein RI, Arons J. 1999. ApJ in press. astro-ph/9909133
- [61] Jongert HC, van der Klis M. 1996. A&A 310:474–76
- [62] Jonker PG, van der Klis M, Homan J, van Paradijs J, Méndez M, et al. 1999a. ApJ submitted; astro-ph/9910159
- [63] Jonker PG, van der Klis M, Wijnands R. 1999b. ApJ 511:L41–44
- [64] Jonker PG, van der Klis M, Wijnands R, Homan J, van Paradijs J, Méndez M, et al. 1999c. ApJ submitted
- [65] Jonker PG, Wijnands R, van der Klis M, Psaltis D, Kuulkers E, Lamb FK. 1998. ApJ 499:L191–94
- [66] Joss PC. 1978. ApJ 225:L123–27
- [67] Kaaret P, Ford E, Chen K. 1997. ApJ 480:L27–29
- [68] Kaaret P, Piraino S, Bloser PF, Ford EC, Grindlay JE, et al. 1999b. ApJ 520:L37–40
- [69] Kaaret P, Piraino S, Ford EC, Santangelo A. 1999a. ApJ 514:L31–33
- [70] Kaaret P, Yu W, Ford EC, Zhang SN. 1998. ApJ 497:L93–96
- [71] Kalogera V, Psaltis D. 1999. Phys. Rev. D submitted; astro-ph/9903415
- [72] Karas V. 1999a. PASJ submitted
- [73] Karas V. 1999b. ApJ submitted
- [74] Klein RI, Arons J, Jernigan JG, Hsu JJL. 1996a. ApJ 457:L85–89
- [75] Klein RI, Jernigan JG, Arons J, Morgan EH, Zhang W. 1996b. ApJ 469:L119–23
- [76] Kluźniak W. 1998. ApJ 509:L37–40
- [77] Kluźniak W. 1999. presented at X-Ray Probes of Relativistic Effects near Neutron Stars and Black Holes, Summer Workshop, Aspen
- [78] Kluźniak W, Michelson P, Wagoner RV. 1990. ApJ 358:538–44
- [79] Kluźniak W, Wagoner RV. 1985. ApJ 297:548–54
- [80] Kluźniak W, Wilson, JR. 1991. ApJ 372:L87–90
- [81] Konar S, Bhattacharya D. 1999. MNRAS 303:588–94
- [82] Kuulkers E, van der Klis M. 1995. A&A 303:801–06
- [83] Kuulkers E, van der Klis M. 1996. A&A 314:567–75
- [84] Kuulkers E, van der Klis M. 1998. A&A 332:845–48
- [85] Kuulkers E, van der Klis M, Oosterbroek T, Asai K, Dotani T. 1994. A&A 289:795–821
- [86] Kuulkers E, van der Klis M, Vaughan BA. 1996. A&A 311:197–210
- [87] Lai D. 1998. ApJ 502:721–29
- [88] Lai D. 1999. ApJ 524:1030–47
- [89] Lai D, Lovelace R, Wasserman I. 1999. ApJ submitted; astro-ph/9904111
- [90] Lamb FK, Miller MC. 1999. ApJ in prep.
- [91] Lamb FK, Shibazaki N, Alpar MA, Shaham J. 1985. Nature 317:681–87
- [92] Leahy DA, Elsner RF, Weisskopf MC. 1983. ApJ 272:256–58
- [93] Lee HC, Miller GS. 1998. MNRAS 299:479–87
- [94] Levin Y. 1999. ApJ 517:328–33
- [95] Lewin WHG, Joss PC. 1981. Space Sci. Rev. 28:3–87
- [96] Lewin WHG, van Paradijs J, Hasinger G, Penninx WH, Langmeier A, et al. 1987. MNRAS 226:383–94
- [97] Lewin WHG, van Paradijs J, Taam RE. 1995b. see Lewin et al. 1995a, pp. 175–232.
- [98] Lewin WHG, van Paradijs J, van den Heuvel EPJ. 1995a. X-Ray Binaries. pp. 662. Cambridge: Cambridge University Press
- [99] Li XD, Bombaci I, Dey M, Dey J, van den Heuvel EPJ. 1999a. astro-ph/9905356
- [100] Li XD, Ray S, Dey J, Dey M, Bombaci I. 1999b. astro-ph/9908274
- [101] Livio M, Bath GT. 1982. A&A 116:286–92
- [102] Makishima K, Ishida M, Ohashi T, Dotani T, Inoue H, et al. 1989. PASJ 41:531–55
- [103] Marković D, Lamb FK. 1998. ApJ 507:316–26
- [104] Markwardt CB, Lee HC, Swank JH. 1999b. AAS HEAD 31:15.01 (Abstr.)
- [105] Markwardt CB, Strohmayer TE, Swank JH. 1999a. ApJ 512:L125–29
- [106] Marshall FE, Markwardt CB. 1999. IAU Circ. No. 7103
- [107] Mason KO, Middleditch J, Nelson JE, White NE. 1980. Nature 287:516–18
- [108] Méndez M. 1999. Relativistic Astrophysics and Cosmology, Texas Symp., 19th, Paris. in press. astro-ph/9903469
- [109] Méndez M, van der Klis M. 1999. ApJ 517:L51–54
- [110] Méndez M, van der Klis M, Ford EC, Wijnands R, van Paradijs J. 1999. ApJ 511:L49–52
- [111] Méndez M, van der Klis M, van Paradijs J. 1998c. ApJ 506:L117–19
- [112] Méndez M, van der Klis M, van Paradijs J, Lewin WHG, Lamb FK, et al. 1997. ApJ 485:L37–40
- [113] Méndez M, van der Klis M, van Paradijs J, Lewin WHG, Vaughan BA, et al. 1998a. ApJ 494:L65–69
- [114] Méndez M, van der Klis M, Wijnands R, Ford EC, van Paradijs J, Vaughan BA. 1998b. ApJ 505:L23–26
- [115] Mereghetti S, Grindlay JE. 1987. ApJ 312:727–31
- [116] Merloni A, Vietri M, Stella L, Bini D. 1999. MNRAS 304:155–59
- [117] Middleditch J, Priedhorsky WC. 1996. ApJ 306:230–37
- [118] Miller MC. 1999a. ApJ 515:L77–80
- [119] Miller MC. 1999b. ApJ submitted; astro-ph/9904093 oscillations
- [120] Miller MC. 1999d. ApJ 520:256–61
- [121] Miller MC. 1999c. Stellar Endpoints, Bologna ’99 Conf.. in press
- [122] Miller MC, Lamb FK. 1998. ApJ 499:L37–40
- [123] Miller MC, Lamb FK, Cook GB. 1998b. ApJ 509:793–801
- [124] Miller MC, Lamb FK, Psaltis D. 1996. astro-ph/9609157v1
- [125] Miller MC, Lamb FK, Psaltis D. 1998a. ApJ 508:791–830
- [126] Moderski R, Czerny B. 1999. ApJ 513:L123–25
- [127] Morgan EH, Smith DA. 1996. IAU Circ. No. 6437
- [128] Morgan EH, Remillard RA, Greiner J. 1997. ApJ 482:993–1010
- [129] Morsink SM, Stella L. 1999. ApJ 513:827–44
- [130] Murakami T, Inoue H, Makishima K, Hoshi R. 1987. PASJ 39:879–86
- [131] Narayan R. 1997. Accretion Phenomena and Related Outflows, IAU Coll. 163, ASP Conf. Series 121:75–89
- [132] Nowak MA, Vaughan BA, Wilms J, Dove JB, Begelman MC. 1999. ApJ 510:874–91
- [133] Nowak MA, Wagoner RV, Begelman MC, Lehr DE. 1997. ApJ 477:L91–94
- [134] Osherovich V, Titarchuk L. 1999a. ApJ 522:L113–16
- [135] Osherovich V, Titarchuk L. 1999b. ApJ 523:L73–76
- [136] Paczyński B. 1987. Nature 327:303–04
- [137] Psaltis D, Belloni T, van der Klis M. 1999a. ApJ 520:262–70
- [138] Psaltis D, Chakrabarty D. 1999. ApJ 521:332–40
- [139] Psaltis D, Lamb FK. 1998. Joint European and National Astr. Meeting, 4th, Astroph. and Astr. Trans. in press
- [140] Psaltis D, Méndez M, Wijnands R, Homan J, Jonker PG, et al. 1998. ApJ 501:L95–99
- [141] Psaltis D, Norman C. 1999. ApJ in prep.
- [142] Psaltis D, Wijnands R, Homan J, Jonker PG, van der Klis M, et al. 1999b. ApJ 520:763–75
- [143] Radhakrishnan V, Srinivasan G. 1984. Asia-Pacific Regional Meeting of the IAU, 2nd, Jakarta, 1981. p. 423
- [144] Reig P, Méndez M, van der Klis M, Ford EC. 1999. ApJ submitted. astro-ph/9910139
- [145] Remillard R. 1999a. see Miller 1999c, in press
- [146] Remillard R. 1999b. presented at RXTE Users Group Meeting, Greenbelt
- [147] Remillard R, McClintock JE, Sobczak G, Bailyn C, Orosz JA, et al. 1999c. ApJ 517:L127–30
- [148] Remillard RA, Morgan EH. 1998. Nucl. Phys. B 69/1-3:316–23
- [149] Remillard R, Morgan E, Levine A, Muno M, McClintock J, et al. 1999a. AAS HEAD 31:28.08 (Abstr.)
- [150] Remillard R, Morgan EH, McClintock JE, Bailyn CD, Orosz JA. 1999b. ApJ 522:397–412
- [151] Sadeh D, Byram ET, Chubb TA, Friedman H, Hedler RL, et al. 1982. ApJ 257:214–22
- [152] Sadeh D, Livio M. 1982a. ApJ 258:770–75
- [153] Sadeh D, Livio M. 1982b. ApJ 263:823–27
- [154] Schaab C, Weigel MK. 1999. MNRAS 308:718–30
- [155] Schoelkopf RJ, Kelley RL. 1991. ApJ 375:696–700
- [156] Shara MM. 1982. ApJ 261:649–60
- [157] Shirey RE, Bradt HV, Levine AM, Morgan EH. 1996. ApJ 469:L21–24
- [158] Shvartsman VF. 1971. Soviet Ast. 15(3):377–84
- [159] Skinner GK, Bedford DK, Elsner RF, Leahy D, Weisskopf MC, Grindlay J. 1982. Nature 297:568–70
- [160] Smale AP, Zhang W, White NE. 1996. IAU Circ. No. 6507
- [161] Smale AP, Zhang W, White NE. 1997. ApJ 483:L119–22
- [162] Smith DA, Morgan EH, Bradt H. 1997. ApJ 479:L137–40
- [163] Stella L. 1999. see Kluźniak 1999
- [164] Stella L, Priedhorsky W, White NE. 1987a. ApJ 312:L17–21
- [165] Stella L, Vietri M. 1998. ApJ 492:L59–62
- [166] Stella L, Vietri M. 1999. Phys. Rev. Lett. 82:17–
- [167] Stella L, Vietri M, Morskink SM. 1999b. ApJ 524:L63–66
- [168] Stella L, White NE, Priedhorsky W. 1987b. ApJ 315:L49–53
- [169] Strohmayer T. 1998. Some Like It Hot, AIP Conf. Proc. 431:397–400.
- [170] Strohmayer TE. 1999. ApJ 523:L51–55
- [171] Strohmayer TE, Jahoda K, Giles AB, Lee U. 1997a. ApJ 486:355–62
- [172] Strohmayer TE, Lee U, Jahoda K. 1996d. IAU Circ. No. 6484
- [173] Strohmayer TE, Markwardt CB. 1999. ApJ 516:L81–85
- [174] Strohmayer T, Smale A, Day C, Swank J, Titarchuk L, Lee U. 1996b. IAU Circ. No. 6387
- [175] Strohmayer TE, Swank JH, Zhang W. 1998c. Nucl. Phys. B69/1-3:129–34
- [176] Strohmayer T, Zhang W, Swank J. 1996a. IAU Circ. No. 6320
- [177] Strohmayer T, Zhang W, Swank JH. 1997b. ApJ 487:L77–80
- [178] Strohmayer TE, Zhang W, Swank JH, Lapidus I. 1998b. ApJ 503:L147–50
- [179] Strohmayer TE, Zhang W, Swank JH, Smale A, Titarchuk L, Day C. 1996c. ApJ 469:L9–12
- [180] Strohmayer TE, Zhang W, Swank JH, White NE, Lapidus I. 1998a. ApJ 498:L135–39
- [181] Sunyaev RA. 1973. Soviet Ast. 16(6):941–44
- [182] Thampan AV, Bhattacharya D, Datta B. 1999. MNRAS 302:L69–73
- [183] Thirring H, Lense J. 1918. Phys. Z. 19:156–63
- [184] Titarchuk L, Lapidus I, Muslimov A. 1998. ApJ 499:315–28
- [185] Titarchuk L, Muslimov A. 1997. A&A 323:L5–8
- [186] Titarchuk L, Osherovich V. 1999. ApJ 518:L95–98
- [187] Titarchuk L, Osherovich V, Kuznetsov S. 1999. ApJ submitted; astro-ph/9909277
- [188] Tomsick JA, Halpern JP, Kemp J, Kaaret P. 1999. ApJ 521:341–350
- [189] Van der Klis M. 1989a. ARA&A 27:517–53
- [190] Van der Klis M. 1989b. Timing Neutron Stars, NATO ASI, Cesme. C262:27–69. Dordrecht: Kluwer
- [191] Van der Klis M. 1994a. ApJS 92:511–19
- [192] Van der Klis M. 1994b. A&A 283:469–74
- [193] Van der Klis M. 1995a. see Lewin et al. 1995a, pp. 252–307
- [194] Van der Klis M. 1995b. The Lives of the Neutron Stars, NATO ASI, Kemer C450:301–30. Dordrecht: Kluwer
- [195] Van der Klis M. 1997. Astronomical Time Series, Wise Obs. Anniv. Symp., 25th, Tel Aviv, Kluwer Astroph. and Space Science Library 218:121–32. Dordrecht: Kluwer
- [196] van der Klis M. 1998. see Bildsten 1998b, C515:337–68 Dordrecht: Kluwer
- [197] Van der Klis M, Hasinger G, Damen E, Penninx W, van Paradijs J, Lewin WHG. 1990. ApJ 360:L19–22
- [198] Van der Klis M, Hasinger G, Stella L, Langmeier A, van Paradijs J, Lewin WHG. 1987. ApJ 319:L13-18
- [199] Van der Klis M, Homan J, Wijnands R, Kuulkers E, Lamb FK, et al. 1997a. IAU Circ. No. 6565
- [200] Van der Klis M, Jansen F, van Paradijs J, Lewin WHG, van den Heuvel EPJ. 1985. Nature 316:225–30
- [201] Van der Klis M, Swank J, Zhang W, Jahoda K, Morgan E, et al. 1996a. IAU Circ. No. 6319
- [202] Van der Klis M, Swank JH, Zhang W, Jahoda K, Morgan EH, et al. 1996b. ApJ 469:L1–4
- [203] Van der Klis M, van Paradijs J, Lewin WHG, Lamb FK, Vaughan B, et al. 1996d. IAU Circ. No. 6428
- [204] Van der Klis M, Wijnands R, Chen W, Lamb FK, Psaltis D, et al. 1996c. IAU Circ. No. 6424
- [205] Van der Klis M, Wijnands RAD, Horne K, Chen W. 1997b. ApJ 481:L97–100
- [206] Van der Klis M, Wijnands R, Kuulkers E, Lamb FK, Psaltis D, et al. 1996e. IAU Circ. No. 6511
- [207] Van Paradijs J, Zhang W, Marshall F, Swank JH, Augusteijn T, et al. 1996. IAU Circ. No. 6336
- [208] Van Straaten S, Ford EC, van der Klis M, Méndez M, Kaaret P. 1999. ApJ submitted
- [209] Vaughan B, van der Klis M, Lewin WHG, Wijers RAMJ, van Paradijs J, et al. 1994a. ApJ 421:738–52
- [210] Vaughan BA, van der Klis M, Méndez M, van Paradijs J, Wijnands RAD, et al. 1997. ApJ 483:L115–18
- [211] Vaughan BA, van der Klis M, Méndez M, van Paradijs J, Wijnands RAD, et al. 1998. ApJ 509:L145–45
- [212] Vaughan BA, van der Klis M, Wood KS, Norris JP, Hertz P, et al. 1994b. ApJ 435:362–69
- [213] Vietri M, Stella L. 1998. ApJ 503:350–60
- [214] White NE, Zhang W. 1997. ApJ 490:L87–90
- [215] Wijnands R, Homan J, van der Klis M, Méndez M, Kuulkers E, et al. 1997b. ApJ 490:L157–60
- [216] Wijnands R, Méndez M, van der Klis M, Psaltis D, Kuulkers E, Lamb FK. 1998c. ApJ 504:L35–38
- [217] Wijnands RAD, van der Klis M, van Paradijs J, Lewin WHG, Lamb FK, et al. 1996a. IAU Circ. No. 6447
- [218] Wijnands RAD, van der Klis M, Psaltis D, Lamb FK, Kuulkers E, et al. 1996b. ApJ 469:L5–8
- [219] Wijnands RAD, van der Klis M, van Paradijs J, Lewin WHG, Lamb FK, et al. 1997a. ApJ 479:L141–44
- [220] Wijnands R, Homan J, van der Klis M, Kuulkers E, van Paradijs J, et al. 1998a. ApJ 493:L87–90
- [221] Wijnands RAD, van der Klis M. 1997. ApJ 482:L65–68
- [222] Wijnands R, van der Klis M. 1998a. IAU Circ. No.6876
- [223] Wijnands R, van der Klis M. 1998b. Nature 394:344–46
- [224] Wijnands R, van der Klis M. 1998c. ApJ 507:L63–66
- [225] Wijnands R, van der Klis M. 1999a. ApJ 514:939–44
- [226] Wijnands R, van der Klis M. 1999b. ApJ 522:965–72
- [227] Wijnands R, van der Klis M. 1999c. A&A 345:L35–38
- [228] Wijnands RAD, van der Klis M, Méndez M, van Paradijs J, Lewin WHG, et al. 1998b. ApJ 495:L39–42
- [229] Wijnands R, van der Klis M, van Paradijs J. 1998d. The Hot Universe, IAU Symp. 188, pp. 370–71
- [230] Wood KS, Hertz P, Norris JP, Vaughan BA, Michelson PF, et al. 1991. ApJ 379:295–309
- [231] Yoshida K, Mitsuda K, Ebisawa K, Ueda Y, Fujimoto R, et al. 1993. PASJ 45:605–16
- [232] Yu W, Li TP, Zhang W, Zhang SN. 1999. ApJ 512:L35–38
- [233] Yu W, Zhang SN, Harmon BA, Paciesas WS, Robinson CR, et al. 1997. ApJ 490:L153–56
- [234] Zhang, W. 1997, presented at AAS Meeting, 190th, Winston-Salem
- [235] Zhang W, Jahoda K, Kelley RL, Strohmayer TE, Swank JH, Zhang SN. 1998c. ApJ 495:L9–12
- [236] Zhang W, Lapidus I, Swank JH, White NE, Titarchuk L. 1997a. IAU Circ. No. 6541
- [237] Zhang W, Lapidus I, White NE, Titarchuk L. 1996a. ApJ 469:L17–19
- [238] Zhang W, Lapidus I, White NE, Titarchuk L. 1996b. ApJ 473:L135
- [239] Zhang W, Smale AP, Strohmayer TE, Swank JH. 1998b. ApJ 500:L171–74
- [240] Zhang W, Strohmayer TE, Swank JH. 1997b. ApJ 482:L167–70
- [241] Zhang W, Strohmayer TE, Swank JH. 1998a. ApJ 500:L167–69