A Definitive Optical Detection of a Supercluster at
Abstract
We present the results from a multi-band optical imaging program which has definitively confirmed the existence of a supercluster at . Two massive clusters of galaxies, CL1604+4304 at and CL1604+4321 at , were originally observed in the high-redshift cluster survey of Oke, Postman & Lubin (1998). They are separated by in radial velocity and 17 arcminutes on the plane of the sky. Their physical and redshift proximity suggested a promising supercluster candidate. Deep imaging of the region between the two clusters indicates a large population of red galaxies. This population forms a tight, red sequence in the color–magnitude diagram at . The characteristic color is identical to that of the spectroscopically-confirmed early-type galaxies in the two member clusters. The red galaxies are spread throughout the region between CL1604+4304 and CL1604+4321. Their spatial distribution delineates the entire large scale structure with high concentrations at the cluster centers. In addition, we detect a significant overdensity of red galaxies directly between CL1604+4304 and CL1604+4321 which is the signature of a third, rich cluster associated with this system. The strong sequence of red galaxies and their spatial distribution clearly indicate that we have discovered a supercluster at .
Accepted for publication in the Astrophysical Journal Letters
1 Introduction
Superclusters comprise the largest known systems of galaxies, containing 2 – 5 massive clusters and extending over 10 – 20 Mpc (e.g., Bahcall & Soneira 1984; Postman, Geller & Huchra 1988; Quintana et al. 1995; Small et al. 1998). Since the dynamical timescales of superclusters are comparable to the Hubble time, large scale structures observed today are cosmic fossils of conditions that existed in the early universe. As a result, studies of these systems can be used to measure the cosmological density parameter , to constrain the large-scale variation of the mass-to-light ratio, and to test theories of the formation and evolution of galaxies and clusters (e.g., Hoffman et al. 1982; Shaya 1984; Peebles 1986; Cen 1994). Large scale structures have been studied at low redshift via the local, Shapley, and Corona Borealis superclusters (e.g., Davis et al. 1980; Postman et al. 1988; Quintana et al. 1995; Small et al. 1998). At higher redshifts of , weak lensing studies of MS0302+16 (Kaiser et al. 2000) provide a direct measure of the projected mass distribution on 10 Mpc scales. These studies indicate that supercluster masses are , their mass-to-light ratios are , and the density parameter measured on supercluster scales is . This work can be extended to higher redshift, but until recently no such systems were known.
Such a high-redshift system has been discovered in a study of nine candidate clusters at by Oke, Postman & Lubin (1998). Two clusters, CL1604+4304 at and CL1604+4321 at , were observed as part of this survey. They are separated by in radial velocity and by 17 arcminutes on the sky. This implies a projected separation of only . We have already analyzed the spectra of a nearly complete sample of galaxies with in a field centered on each cluster. The top panel in Figure 1 shows the combined velocity histogram of the 63 confirmed members in the two clusters (21 in CL1604+4304 and 42 in CL1604+4321). CL1604+4304 and CL1604+4321 have velocity dispersions of and and masses of and , respectively (Postman, Lubin & Oke 1998, 2000). All of the observational data suggest that CL1604+4304 and CL1604+4321 are typical of Abell richness class 1 to 3 clusters (Lubin et al. 1998, 2000).
More interestingly, these two clusters may comprise an even larger system of galaxies. The lower panel of Figure 1 shows the north-south position of the confirmed cluster members versus redshift. There is a clear trend in which the redshift on the north side of CL1604+4304 approaches the redshift of CL1604+4321. The apparent alignment in redshift space and the physical proximity of the clusters indicate that this may be a high-redshift supercluster. The estimated mass of this structure is , and the spatial overdensity is . These numbers imply that the system is bound and has likely reached turnaround for reasonable cosmologies (Small et al. 1998).
In this Letter, we provide new evidence from multi-band optical imaging which strongly favors the supercluster hypothesis. Unless otherwise noted, we use and .
2 The Observations
All of the optical imaging was completed with the Carnegie Observatories Spectroscopic Multislit and Imaging Camera (COSMIC; Kells et al. 1998) at the 200-in Hale telescope at Palomar Observatories. We have used the instrument in direct imaging mode which provides a pixel scale of 0285 per pixel and a field-of-view of . Two individual pointings were made in order to cover the region between CL1604+4304 and CL1604+4321. Each pointing covered a portion of one cluster. The overlap between the pointings was . The photometric survey was conducted in three broadband filters , , and Gunn . The total integration times on each pointing were 2 hours in and 1 hour in and . The data were calibrated to the standard Cousins-Bessell-Landolt system through exposures of Landolt standard-star fields (Landolt 1992). Variations about the nightly photometric transformations are 0.03 mag or less.
Source detection and photometry were performed using SExtractor version 2.1.0 (Bertin & Arnouts 1996). SExtractor was chosen for its ability to detect objects in one image and analyze the corresponding pixels in a separate image. When applied uniformly to multi-band data, this technique generates a matched aperture dataset. Our detection image was constructed from the images using a process (Szalay, Connolly & Szokoly 1998). Briefly, this process involves convolving each input image with a Gaussian kernel matched to the seeing. The convolved images were squared and normalized so that the background had zero mean and unit variance. The three processed images (corresponding to the original images) were coadded, forming the detection image. A histogram of the pixel distribution in the image was created and compared to a function with three degrees of freedom (which corresponds to the sky pixel distribution). The difference between the actual pixel distribution and the function provides an optimal estimate for the actual object pixel distribution. The Bayesian detection threshold was set equivalent to the intersection of the “sky” and “object” distributions (i.e. where the object pixel flux becomes dominant). To convert this empirical threshold for use with SExtractor, we scale the threshold (which is a flux per pixel value) into a surface brightness threshold (which is in magnitudes per square arcsecond) by defining a detection zeropoint using the desired detection threshold and the pixel scale. Approximately 4800 galaxies were detected in the combined fields.
For the color analysis, we use the total magnitudes as calculated by SExtractor. These magnitudes are variable-diameter aperture magnitudes measured in an elliptical aperture of major axis radius , where is the Kron radius (see Bertin & Arnouts 1996). Because we have used a matched aperture analysis, the total magnitudes in the three bands are measured within the same physical radius for a given galaxy. The limiting magnitudes of our survey are , , and for a detection.
3 The Results
3.1 The Galaxy Colors
With the multi-band imaging, we have generated photometry on a complete sample of galaxies in a contiguous area of or at the supercluster redshift of . We show the resulting and color-magnitude (CM) diagrams in Figure 2. In both diagrams, we see a well-defined color-magnitude sequence which is redder than the vast majority of galaxies which comprise the field population. This red sequence of galaxies is considerably tighter in the ) CM diagram where it is observed at . In the CM diagram, the larger color scatter in this red sequence is a result of the fact that many of these galaxies lie at or beyond the completeness limits of this survey. Figure 3 shows a histogram of colors. In this figure, the red sequence of galaxies can be clearly distinguished from the field population where it is a red peak superimposed on the large distribution of bluer field galaxies. Fitting two Gaussian functions to this distribution, we find that the standard deviation of the red peak is 0.15 mag.
A tight, red color-magnitude relation is typical of the central regions of massive clusters both in the local universe and at intermediate and high redshift (e.g., Dressler 1980; Butcher & Oemler 1984; Stanford, Dickinson & Eisenhardt 1995, 1997). The galaxies contained in this “red locus” are the elliptical and S0 galaxies which comprise the majority of the cluster population. The early-type galaxies are characterized by their red color and their small color scatter, typically less than 0.2 mag. Studies of clusters from to the present epoch imply that the observed color trend in this red envelope of galaxies is consistent with passive evolution of an old stellar population formed in a relatively synchronized burst of star formation at (e.g., Ellis et al. 1997; Stanford et al. 1995, 1997; Bower, Kodama & Terlevich 1998).
We have confirmed that the red sequence observed in our supercluster field corresponds to a population of old, early-type galaxies. Within this field, there are 21 galaxies which have an absorption spectrum which is typical of an early-type galaxy and are spectroscopically-confirmed members of either CL1604+4304 at or CL1604+4321 at (Postman et al. 1998, 2000). In Figure 4, we indicate those galaxies on the CM diagram. All of these galaxies fall directly on the observed red locus, confirming that it is comprised mainly of early-type galaxies at the supercluster redshift of . As discussed in Postman et al. (1998, 2000), the color of these galaxies are consistent with the passive evolution of a stellar population which formed at redshifts of . While the presence of a red sequence of early-type galaxies is typical of the central in massive clusters, the fact that we observe such a well-defined red sequence over the entire scale of the supercluster strongly supports the existence of a large scale structure at .
3.2 The Spatial Distribution
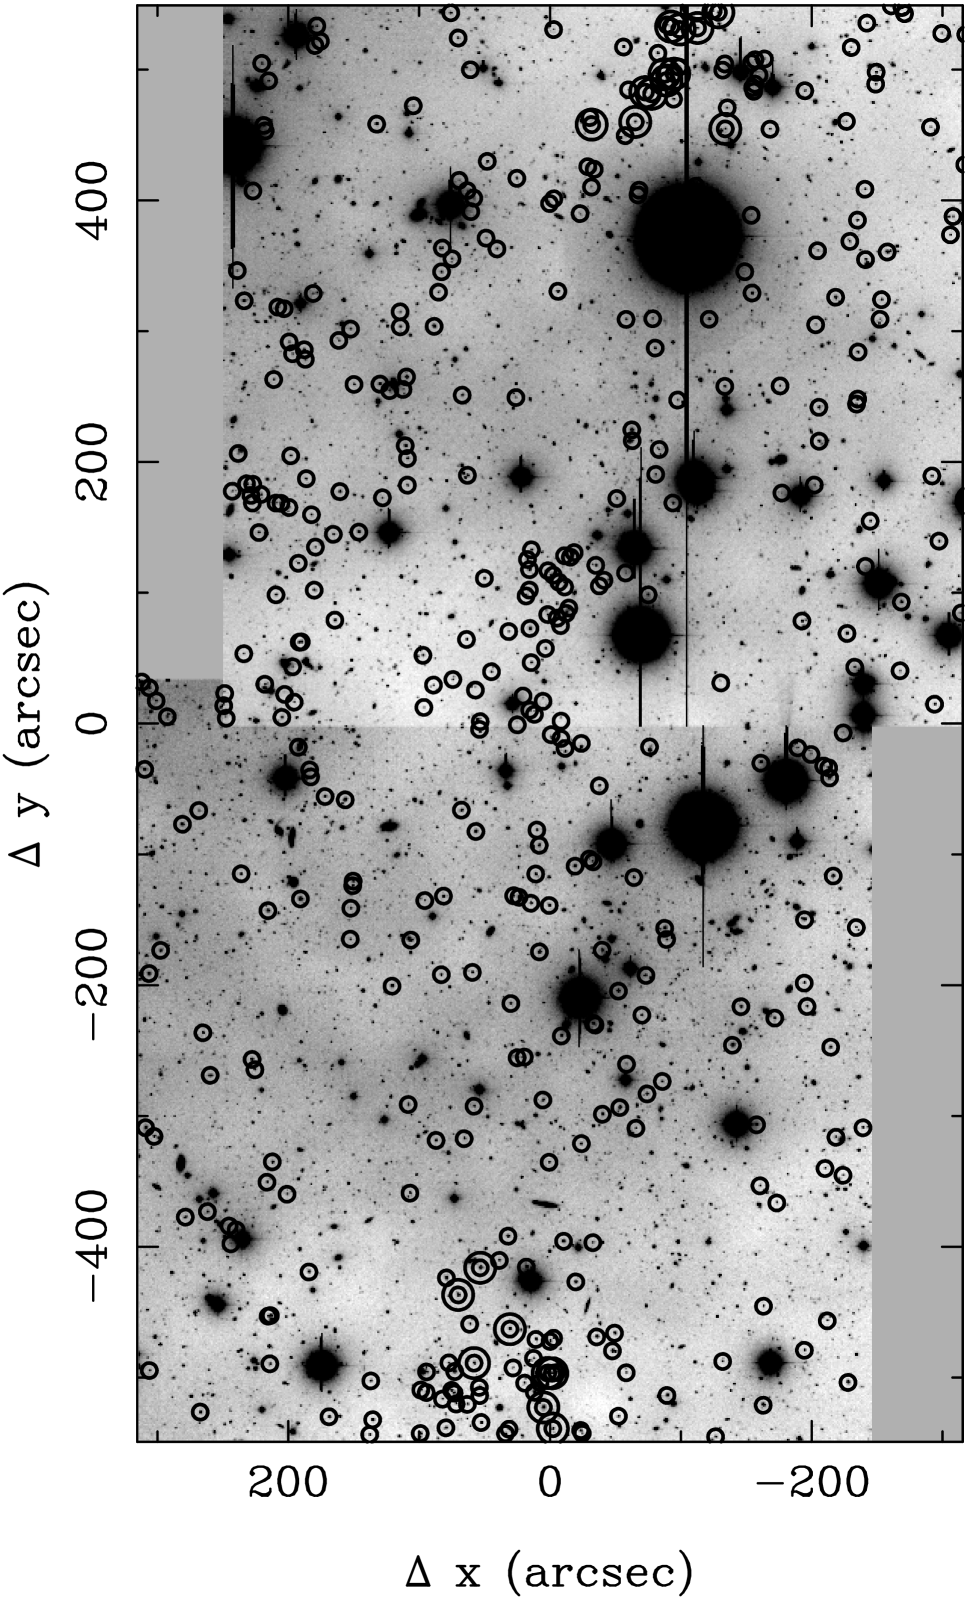
Based on the ) color-magnitude sequence, we can select galaxies which are likely supercluster members. We have chosen all galaxies which form the red locus () and can be spectroscopically observed in a reasonable time on a 10-m class telescope (). The resulting sample contains 418 galaxies which are shown on the composite band image in Figure 5. The clusters CL1604+4304 and CL1604+4321 are at the bottom and top, respectively, of this image. The spatial distribution of red galaxies clearly delineates the large scale system of galaxies which encompasses the two rich clusters. These galaxies are spread throughout the full field, being noticeably more concentrated near the cluster centers. In addition, we observe a strong concentration of red galaxies directly between CL1604+4304 and CL1604+4321 at . Based on a control field, we find the number density of red field galaxies, as defined by our color selection, is galaxies per arcmin2. Within a radius of , the new concentration is overdense in red galaxies by a factor of compared to this control field. This overdensity is equivalent to that observed in the two original clusters; CL1604+4304 and CL1604+4321 are overdense by a factor of 20 and 13, respectively. At half an Abell radius, the overdensity of red galaxies in the three clusters is a factor of . These data clearly indicate that we have detected a third, massive cluster associated with this large scale structure. We also observe at least one other, although more marginal, overdensity in this field, suggesting that this supercluster may contain additional clusters beyond the three discussed here. The spatial distribution of red galaxies provides further confirmation of a large scale structure spanning at least Mpc.
4 Conclusions
We have confirmed the existence of a supercluster at with deep, multiband imaging taken at the Palomar 200-in telescope. In the resulting color–magnitude diagrams, we find a relatively tight, color–magnitude sequence of red galaxies. The characteristic color of this sequence corresponds directly to the colors of the confirmed early-type galaxies in the two member clusters, CL1604+4304 and CL1604+4321. Therefore, we have identified a large population of early-type galaxies within the redshift range of . These red galaxies cover the entire region which separates the two member clusters. They delineate the full extent of the large scale structure, while clearly encompassing the two clusters. Based on the distribution of red galaxies over this field, we have identified another rich cluster associated with this system. It lies directly between CL1604+4304 and CL1604+4321, and its overdensity of red galaxies is approximately equal to that of the two originally identified clusters. The strong red sequence of galaxies and their distribution on the sky leave no doubt that there exists a large scale structure at . This supercluster is the first massive structure confirmed at such a high redshift. At higher redshift, there is a two cluster system at (Rosati et al. 1999). The nature of large scale structure surrounding this pair has not yet been explored.
In order to study this structure even further, we are planning to perform two additional observational studies. Firstly, we will complete an extensive spectroscopic survey using the multislit capability of the Low Resolution Imaging Spectrograph (LRIS; Oke et al. 1995) on the Keck 10-m telescope. Based on our accurate color selection, we expect to measure redshifts for over 400 supercluster members. This sample is comparable in size to the largest spectroscopic studies of the Shapley and Corona Borealis superclusters (Quintana et al. 1995; Small et al. 1998). Secondly, we will perform multi-band imaging of the entire supercluster region, including two flanking fields, using the Large Field Camera (LFC; Metzger et al. 2000) on the Palomar 200-in telescope. This survey will provide photometry for over 10,000 galaxies which will be used to calculate photometric redshifts accurate to (Brunner, Connolly & Szalay 1999). These data will allow us to study galaxy properties as a function of position and local density within the supercluster; to measure the mass distribution on intermediate scales and estimate ; and to examine the early stages of cluster formation through the accretion of matter in the cluster infall regions. As a result, this high-redshift structure will be one of the most well-studied superclusters.
We thank the anonymous referee for useful comments. LML is supported by NASA through Hubble Fellowship grant HF-01095.01-97A from the Space Telescope Science Institute, which is operated by the Association of Universities for Research in Astronomy, Inc., under NASA contract NAS 5-26555.
References
- (1) Bahcall. N.A. & Soneira, R.M. 1984, ApJ, 277, 27
- (2) Bertin, E. & Arnouts, S. 1996, A&A, 117, 393
- (3) Bower, R.G., Kodama, T., & Terlevich, A. 1998, MNRAS, 299, 1193
- (4) Butcher, H. & Oemler, A. 1978, ApJ, 226, 559
- (5) Brunner, R.J, Connolly, A.J., & Szalay, A.S. 1999, ApJ, 516, 563
- (6) Cen, R. 1994, ApJ, 424, 22
- (7) Davis, M., Tonry, J., Huchra, J., & Latham, D.W. 1980, ApJ, 238, 11
- (8) Dressler, A. 1980, ApJS, 42, 565
- (9) Ellis, R.S., Smail, I., Dressler, A., Couch, W.J., Omeler, A., Butcher, H., & Sharples, R. 1997, ApJ, 483, 582
- (10) Hoffman, Y., Shaham, J., & Shaviv, G. 1982, ApJ, 262, 413
- (11) Kaiser, N., Wilson, G., Luppino, G., Kofman, L., Gioia, I., Metzger, M., & Dahle, H. 2000, ApJ, in press
- (12) Kells, W., Dressler, A., Sivaramakrishnan, A., Carr, D., Koch, E., Epps, H., Hilyard, D., & Pardeilhan, G. 1998, PASP, 110, 1487
- (13) Landolt, A. U. 1992, AJ, 104, 340
- (14) Lubin, L.M., Postman, M., Oke, J.B., Ratnatunga, K.U., Gunn, J.E., Hoessel, J.G., & Schneider, D.P. 1998, AJ, 116, 584
- (15) Lubin, L.M., Postman, M., Oke, J.B., Brunner, R., Gunn, J.E., & Schneider, D.P. 2000, AJ, in preparation
- (16) Metzger, M.R. et al. 2000, PASP, in preparation
- (17) Oke, J.B. et al. 1995, PASP, 107, 375
- (18) Oke, J.B., Postman, M., & Lubin, L.M. 1998, AJ, 116, 549
- (19) Peebles, P.J.E. 1986, Nature, 321, 27
- (20) Postman, M., Lubin, L.M., & Oke, J.B. 1998, AJ, 116, 560
- (21) Postman, M., Lubin, L.M., & Oke, J.B. 2000, AJ, in preparation
- (22) Postman, M., Geller, M.J., & Huchra, J.P. 1988, ApJ, 95, 267
- (23) Quintana, H., Ramirez, A., Melnick, J., Raychaudhury, S., & Slezak, E. 1995, AJ, 110, 463
- (24) Rosati, P., Stanford, S.A, Eisenhardt, P.R., Elston, R., Spinrad, H., Stern, D., & Dey, A. 1999, AJ, 118, 76
- (25) Shaya, E.J. 1984, ApJ, 280, 470
- (26) Small, T.A., Chung-Pei, M., Sargent, W.L.W., & Hamilton, D. 1998, ApJ, 492, 45
- (27) Stanford, S.A., Eisenhardt, P.R.M., & Dickinson, M. 1995, ApJ, 450, 512
- (28) Stanford, S.A., Eisenhardt, P.R.M., & Dickinson, M. 1997, ApJ, 492, 461
- (29) Szalay, A.S., Connolly, A.J., & Szokoly, G.P. 1998, AJ, 117, 68