The first galaxies: clues from element abundances
Abstract
It has recently become possible to measure directly the abundances of several chemical elements in a variety of environments at redshifts up to . In this review I summarise the latest observations of Lyman break galaxies, damped Lyman alpha systems and the Lyman alpha forest with a view to uncovering any clues which these data may offer to the first episodes of star formation. The picture which is emerging is one where the universe at already included many of the components of today’s galaxies—even at these early times we see evidence for Populations I and II stars, while the ‘smoking gun’ for Population III objects may be hidden in the chemical composition of the lowest density regions of the IGM, yet to be deciphered.
1 Introduction
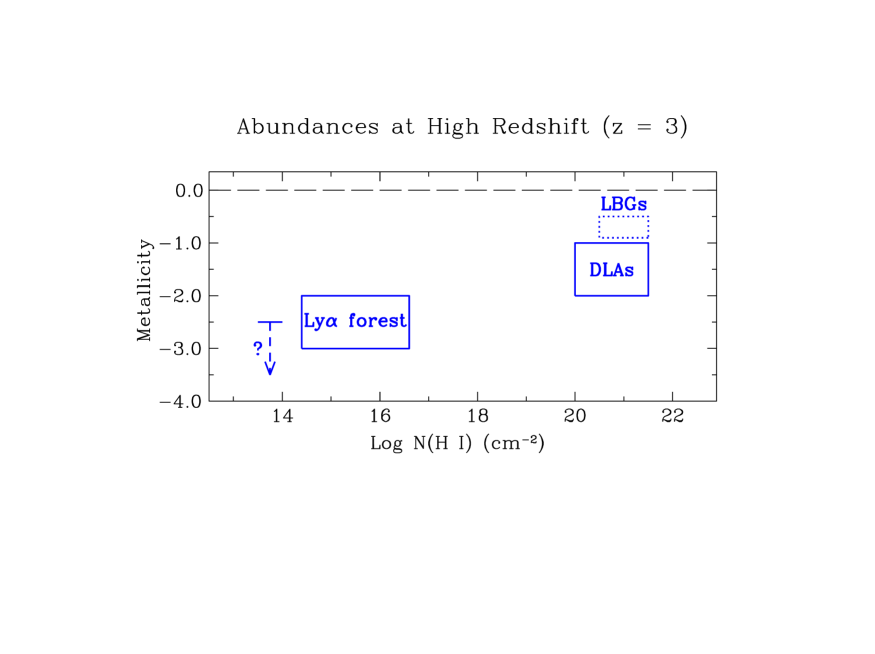
The aim of this talk is to consider the information on the first episodes of star formation in the universe provided by studies of element abundances at high redshift. This is very much a growth area at present. Thanks largely to the new opportunities offered by the Keck telescopes and their VLT counterparts in the southern hemisphere, we find ourselves in the exciting position of being able, for the first time, to measure the abundances of a wide range of chemical elements directly in stars, H II regions, cool interstellar gas and hot intergalactic medium, all observed when the universe was only of its present age. Our simple-minded hope is that, by moving back to a time when the universe was young, clues to the nature, location, and epoch of the first generations of stars may be easier to interpret than in the relics left today, some 11 Gyrs later. Furthermore, as we shall see, the metallicities of different structures in the universe and their evolution with redshift are key factors to be considered in our attempts to track the progress of galaxy formation through the cosmic ages. As can be readily appreciated from inspection of Figure 1, our knowledge in this field is still very sketchy. Given the limitations of space, this review focuses primarily on results obtained in the last year on the three components of the high universe shown in Figure 1.
2 Lyman Break Galaxies
Undoubtedly, one of the turning points in extragalactic astronomy in the 1990s has been the realisation that high redshift galaxies can be found in large numbers using a highly efficient photometric selection technique based on the passage of the Lyman edge—at the rest wavelength of 912 Å—through the -band. After many years of fruitless searches (targeted mainly to Ly emission which turned out to be a less reliable marker than anticipated), we have witnessed a veritable explosion of data from the Hubble Deep Fields and ground-based surveys. Galaxies with measured redshifts in excess of now number in the many hundreds (the 1000 mark is just around the corner); such large samples have made it possible to trace the star formation history of the universe over most of the Hubble time and to measure large-scale properties of the population, most notably their clustering and luminosity functions (Madau et al. 1996; Steidel et al. 1998, 1999 and references therein).
However, for a quantitative study of many of the physical properties of Lyman break galaxies, even the light-gathering power of the world’s largest telescopes is not enough and we have to rely on gravitational lensing to boost the flux to levels where their spectra can be recorded with sufficiently high resolution and signal-to-noise ratio. This is the case for the galaxy MS 1512-cB58, an Lyman break galaxy fortuitously magnified by a factor of by the foreground cluster MS 1512+36 at (Yee et al. 1996; Seitz et al. 1998). Somewhat ironically, our Keck spectrum of cB58 (Pettini et al. 2000b) is one of the best examples of the ultraviolet spectrum of a starburst galaxy at any redshift, thanks to the combined effects of gravitational lensing, redshift, and collecting area of the Keck telescopes.
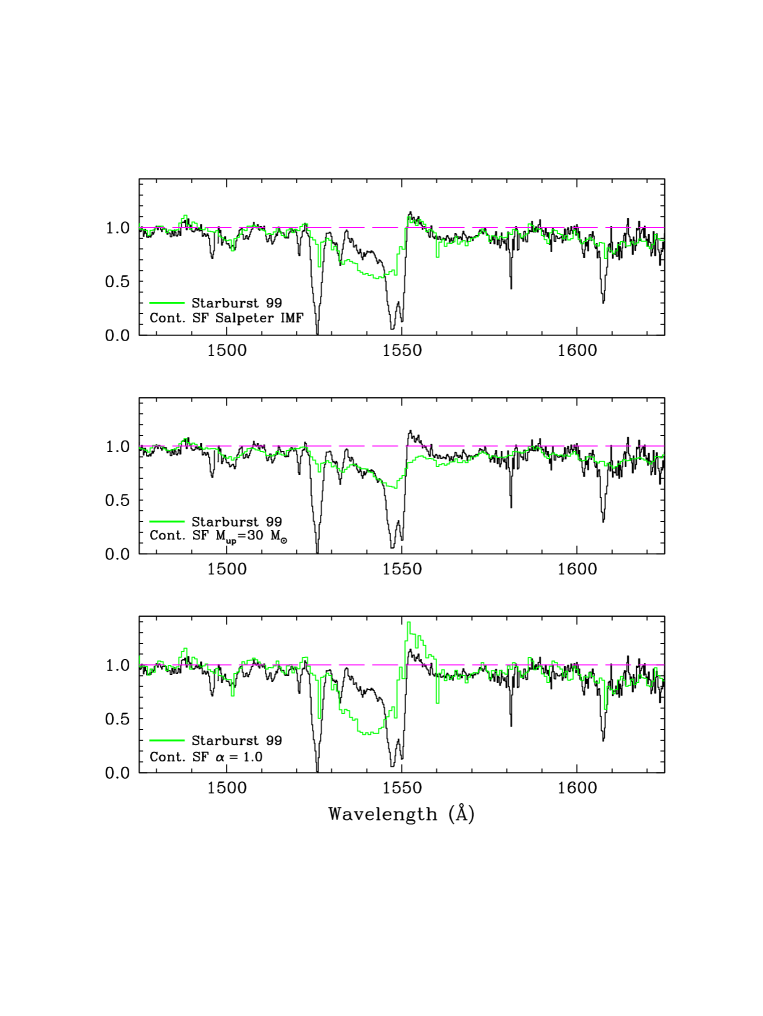
At optical wavelengths correspond to the rest-frame far-UV, where we see the integrated light of short-lived O and early B stars. Such spectra are most effectively analysed with population synthesis models, the most sophisticated of which is Starburst99 developed by the Baltimore group (Leitherer et al. 1999). In Figure 2 we compare Starburst99 model predictions for different IMFs with our data in the region of the C IV doublet. It is important to realise that the comparison only refers to stellar spectral features and does not include the interstellar lines, readily recognisable by their narrower widths (these IS lines are much stronger in cB58, where we sample the whole ISM of the galaxy, than in the models which are based on libraries of nearby Galactic O and B stars). With this clarification, it is evident from Figure 2 that the spectral properties of at least this Lyman break galaxy are remarkably similar to those of present-day starbursts—a continuous star formation model with a Salpeter IMF provides a very good fit to the observations. In particular, the P-Cygni profiles of C IV, Si IV and N V are sensitive to the slope and upper mass limit of the IMF; the best fit in cB58 is obtained with a standard Salpeter IMF with slope and (top panel of Figure 2). IMFs either lacking in the most massive stars or, conversely, top-heavy seem to be excluded by the data (middle and bottom panels of Figure 2 respectively).
The only significant difference between the observed and synthesised spectrum is in the optical depth of the P-Cygni absorption trough which is lower than predicted (top panel of Figure 2). This is likely to be an abundance effect, since an analogous weakening of the absorption is seen in OB stars with mass loss in the Magellanic Clouds (e.g. Lennon 1999) and is also predicted by stellar wind theory (e.g. Kudritzki 1998). In future, when the libraries of stellar spectra in Starburst99 are expanded to include Magellanic Cloud stars (a project which is already underway), it may be possible to calibrate the optical depth of C IV absorption with Carbon abundance and use this feature to deduce the metallicity of high redshift star-forming galaxies. For the moment, we conclude on the basis of a qualitative comparison that the metallicity of the young stellar population in cB58 is similar to that in the LMC, where [C/H] . Weak interstellar lines of Sulphur, Silicon, and Nickel are consistent with this abundance estimate.
2.1 Moving to the Infrared
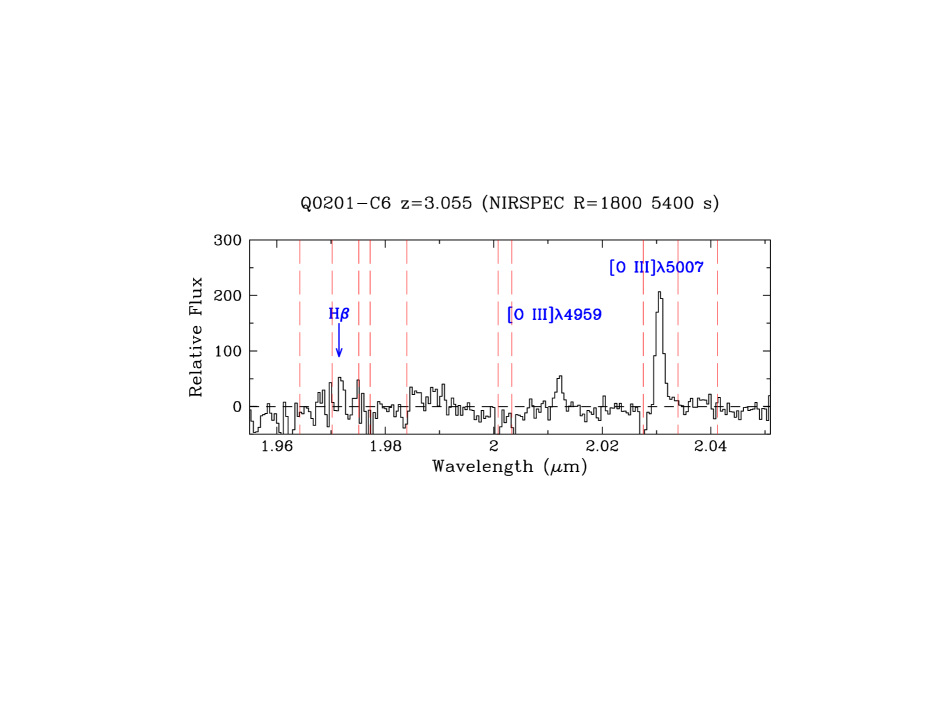
Very recently, the successful commissioning of NIRSPEC on Keck II and ISAAC on VLT1 have made it possible to extend spectroscopic studies of Lyman break galaxies to the near infrared which, at , includes the familiar optical emission lines from H II regions on which much of our knowledge of local star-forming galaxies is based. As indicated by exploratory observations with UKIRT (Pettini et al. 1998), detecting these lines is a challenging task even with large telescopes, so that we may be restricted to studying the brightest examples of Lyman break galaxies, with . Figure 3 shows an example of such data. The relative strengths of [O III] and H in Q0201–C6 are typical of the dozen or so objects observed so far; we find that generally and , where is the familiar strong line ratio index of Pagel et al. (1979). This in turn implies abundances of solar; as shown by Teplitz et al. (2000), cB58 conforms to this pattern with [O/H] , in good agreement with the UV analysis discussed above.
2.2 Kinematics
The combination of (rest-frame) optical and UV observations gives insights into several other properties of LBGs, apart from chemical abundances. The widths of the emission lines are likely to be better indicators of the underlying masses than the interstellar absorption lines which, being sensitive to very low column densities, can be broadened by gas accelerated to high velocities by supernovae and stellar winds associated with the star-formation activity. A preliminary analysis of the dozen objects in our sample indicates velocity dispersions km s-1; km s-1 seems to be typical.
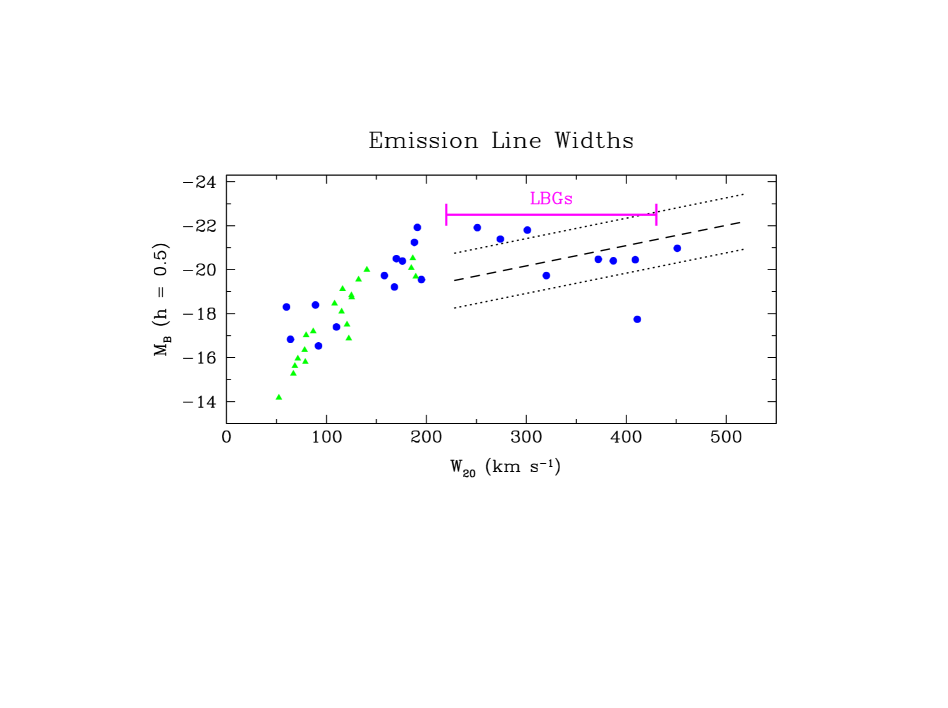
In Figure 4 we compare these values with analogous data for nearby galaxies. is full width at 20% of the peak intensity ( for a Gaussian profile) which in the Lyman break galaxies we measure most accurately from [O III] , and is the absolute magnitude in the rest-frame -band which at can be deduced directly from the observed -band magnitude without the need for a substantial -correction. The horizontal bar in Figure 4 shows the range of values of for the LBGs observed so far, which are mostly at the bright end of the luminosity function, with to (as indicated by the vertical bars). The most appropriate comparison is probably with the compilation of [O II] widths in local star-forming galaxies (filled dots) by Kobulnicky & Gebhardt (2000) who mimicked the conditions under which these measurements are conducted at high redshift, by obtaining global values of which refer to a whole galaxy, and did not correct for inclination and internal extinction. As can be seen from Figure 4, the widths of the emission lines in the brighter Lyman break galaxies are at the upper end of the range of values observed locally, and are significantly larger than those of H II galaxies (triangles). Thus the typical km s-1 of LBGs is the value which one may expect from a disk galaxy (viewed at a random inclination) rotating at km s-1. Indeed there are hints in two of the objects observed that we may be seeing the rotation curve directly in spatially resolved [O III] emission lines. Kinematical masses in excess of a few times are indicated.
Also shown in Figure 4 is the Tully-Fisher relation for local spirals. This comparison is less straightforward, because the Tully-Fisher relation is derived from spatially resolved rotation curves corrected for inclination and internal extinction—we have tried to take these factors into account in a statistical sense when reproducing the mean relation by Pierce & Tully (1992) in Figure 4. Vogt et al. (1997) found a mild brightening, by mag, of the relation in a sample of 16 galaxies at and interpreted it as being due to luminosity evolution in the field galaxy population (the Vogt et al. data are, like ours, based on observations of [O II] and [O III] emission lines from H II regions). Taken at face value, the very preliminary comparison in Figure 4 suggests a much more significant luminosity evolution when we look back to , perhaps amounting to as much as 2 magnitudes in the -band.
Finally, we find that there are systematic velocity offsets between nebular emission lines, interstellar absorption lines, and Ly in most Lyman break galaxies observed; these offsets can be explained as resulting from large scale outflows with velocities of up to several hundred km s-1. In cB58 Pettini et al. (2000b) deduced a mass outflow rate , comparable to the rate at which gas is being turned into stars. Such galactic ‘superwinds’ seem to be a common feature of starburst galaxies at all redshifts (see Tim Heckman’s article in this volume), and may well be the mechanism which self-regulates star formation, distributes metals over large volumes and allows the escape of ionizing photons into the intergalactic medium.
In summary, all the available information is consistent with the notion that Lyman break galaxies are already well developed systems at , with stellar populations, chemical abundances and kinematics very much in line with those of the more massive star-forming galaxies in the local universe. As explained above, the best studied examples so far are all at the bright end of the luminosity function; thus, perhaps we should not be surprised to find that their properties are relatively uniform. What is interesting is that galaxies at such an advanced stage of evolution were already in place at the relatively early epochs corresponding to ; it therefore seems most natural to associate these objects with the progenitors of today’s elliptical galaxies and bulges of spirals, as proposed by Steidel et al. (1996).
3 Damped Lyman alpha Systems
These are the absorption systems with the highest column density of neutral hydrogen, (H I) cm-2, seen in the spectra of QSOs and they provide us with the best opportunity to measure accurately the abundances of a wide range of elements at high redshift. The reason is simple: QSOs can be several hundred times brighter than Lyman break galaxies at the same redshift. Surveys with HIRES on Keck I have produced data of exquisite quality—a 10% accuracy in the determination of interstellar gas-phase abundances is achievable with only modest efforts (Lu et al. 1996; Prochaska & Wolfe 1999).
This makes it all the more frustrating that a clear connection between DLAs and galaxies has yet to be established. In principle, selecting galaxies by their H I absorption cross-section should provide a more representative sampling of the field population at a given redshift than conventional magnitude limited surveys, either in the continuum or emission lines. Thus one may conjecture that DLAs pick out galaxies from the whole luminosity function, particularly if H I cross section has only a mild dependence on galaxy luminosity (Steidel, Dickinson, & Persson 1994), and that Lyman break galaxies may just be the most luminous DLAs at (Pettini et al. 2000b; Steidel, Pettini, & Hamilton 1995; Djorgovski et al. 1996). While this interpretation is attractive in its simplicity, we must face up to the fact that it cannot readily account for the most recent observations of DLAs (reproduced in Figure 5) which find no significant evolution of either the gas mass or the metallicity (Rao & Turnshek 2000; Pettini et al. 1999; Prochaska & Wolfe 2000) over a redshift interval () during which most of today’s stars were apparently formed (see Figure 7 of Pettini 1999). Possibly, existing samples of damped Ly systems are subject to subtle selection effects of their own and may preferentially trace a particular stage in the evolution of galaxies, when the gas has an extended distribution and only moderate surface density, and the metal—and therefore dust—content is low. There is both theoretical (Mo, Mao, & White 1999) and observational (Le Brun et al. 1997; Rao & Turnshek 1998) evidence in support of this picture.

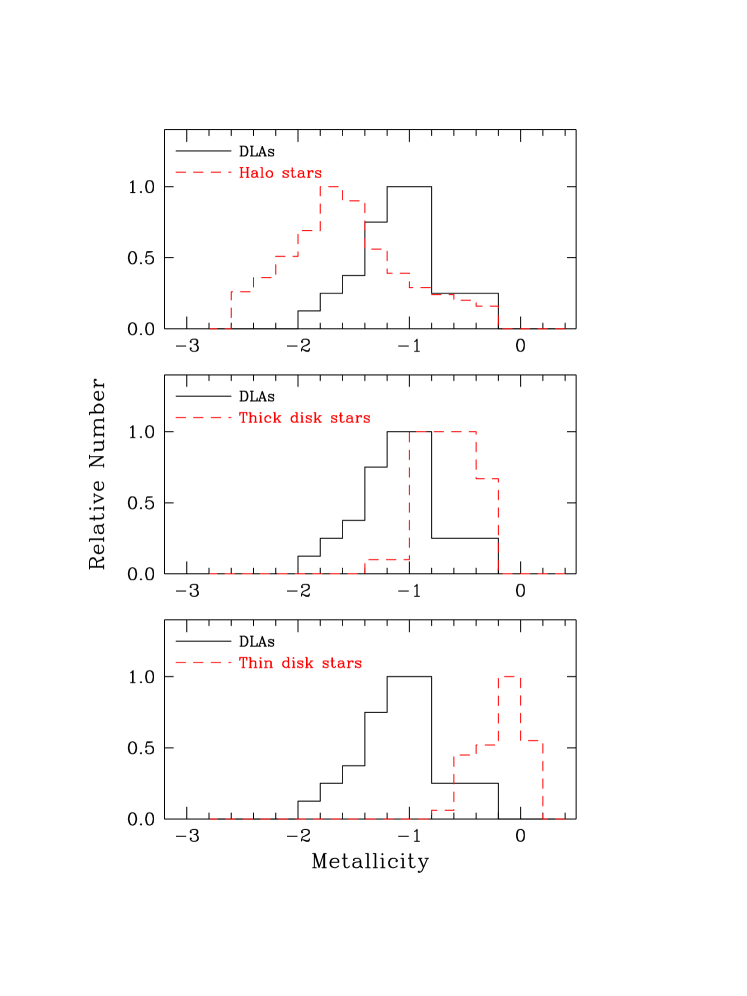
These latest developments do not detract from our interest in damped Ly systems. First, as emphasised repeatedly by Fall and collaborators (Fall 1996), the column density-weighted mean metallicity of DLAs is the closest measure we have of the degree of metal enrichment reached by the gaseous component of galaxies at a given epoch, irrespectively of the precise nature of the absorbers. Thus, values of [Z] at different redshifts (so far most effectively deduced from the abundance of Zn—Pettini et al. 1999) are essential reference points for models of global chemical evolution (Prantzos & Silk 1998; Pei, Fall, & Hauser 1999). The only uncertainty which remains to be resolved for a full use of this information is the degree to which existing samples of DLAs are biased against sight-lines sufficiently dusty to obscure the background QSOs; this is a question which we are in the process of exploring by examining the statistics of damped systems in radio selected QSOs. At redshifts the metallicity distribution of known DLAs is intermediate between those of stars in the halo and thick disk of the Milky Way; at this epoch most of the galaxies giving rise to damped systems were clearly less evolved chemically than the stellar population forming the thin disk of our Galaxy (see Figure 6).
Second, DLAs present us with the opportunity to extend local studies of the relative abundances of different elements to unexplored regimes and to earlier epochs. Potentially, DLAs have an important role to play here in complementing the information so far obtained from observations of Galactic stars and nearby H II regions and providing fresh clues both to the origin of different stellar populations and to the stellar yields.
For example, Pettini, Lipman, & Hunstead (1995) and Lu, Sargent, & Barlow (1998) showed that in DLAs it is possible to follow the behaviour of the (N/O) ratio to lower metallicities than those probed up to now (IZw18 still remains the most metal-poor star-forming region known in our vicinity). Their results appear to lend support to the idea of a delayed production of primary nitrogen by intermediate mass stars, although this interpretation has been challenged more recently (Centurión et al. 1998; Izotov & Thuan 1999—see also Pilyugin 1999) and more observations are clearly required in order to settle the issue.
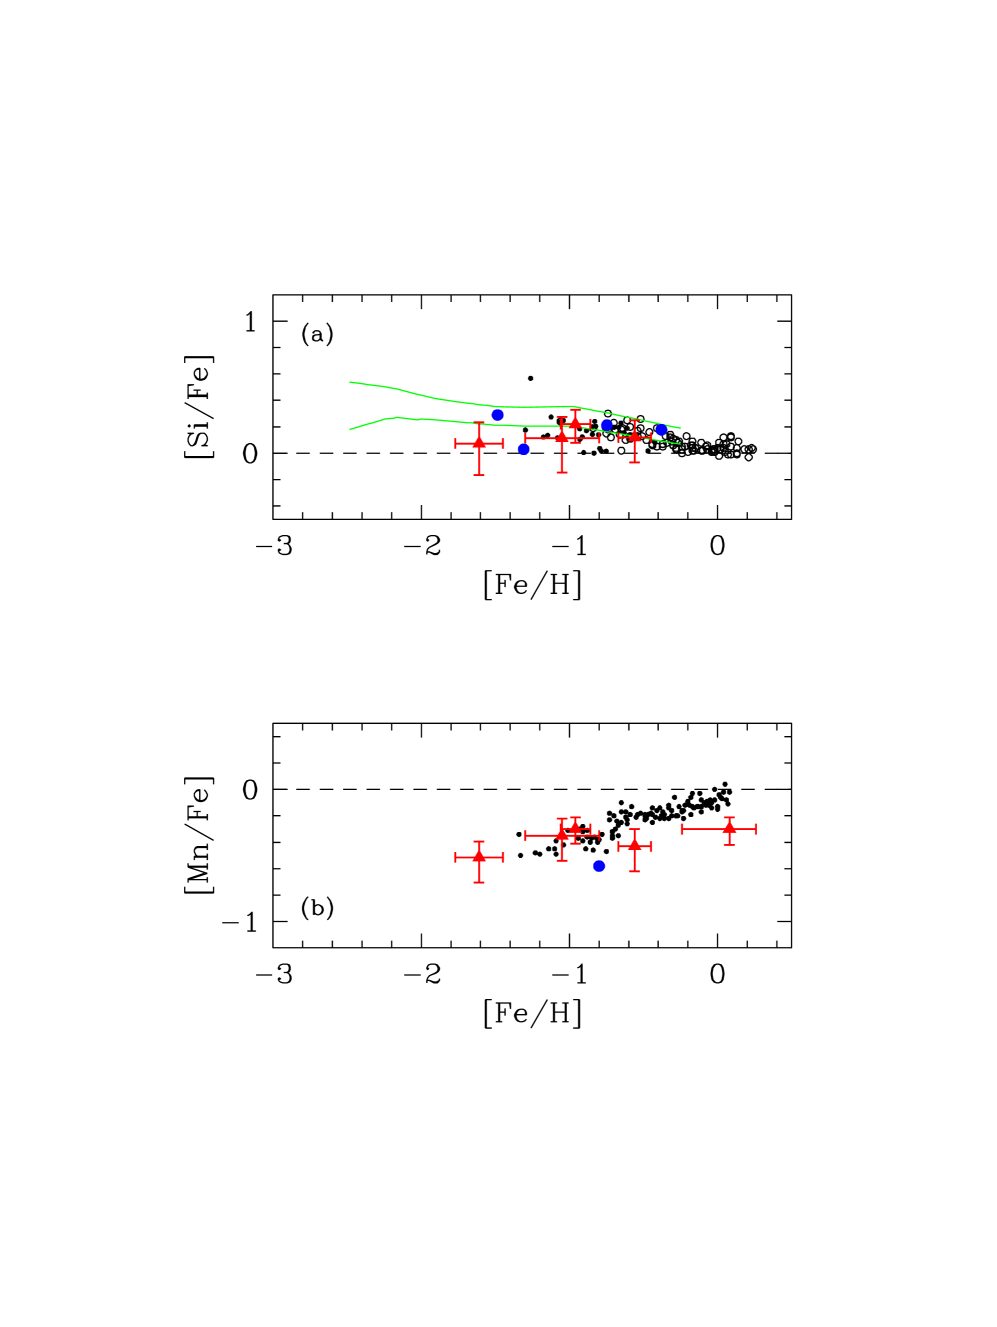
The latest application of this technique involves Silicon (an -capture element) and Manganese. In Figure 7 (reproduced from Pettini et al. 2000a) the abundances of these two elements in damped Ly systems of different metallicities are compared with analogous data for stars in the disk and halo of our Galaxy. The DLAs considered are those where less than 50% of Si, Mn, and Fe is locked up in dust grains, so that the total (gas+dust) abundances can be recovered with minimum uncertainty. The first-order conclusion is that the DLA values roughly follow the local trends, but there are notable differences too, as we now discuss.
The rise of [Si/Fe] from to solar to between and as the metallicity drops to [Fe/H] (top panel of Figure 7) is the well-known overabundance of the -elements commonly attributed to the delayed production of additional Fe by Type Ia supernovae. While some DLAs do show enhanced [Si/Fe], we also find counter-examples of near-solar abundance of Si at metallicities in the range [Fe/H] to . Current wisdom would interpret such cases as arising in galaxies where star formation has proceeded slowly, or in bursts, so that there has been sufficient time for Fe to build up to solar abundance relative to Si, while the overall metallicity remained low. Corroborating evidence for this interpretation may be provided by deep imaging of the absorbers, if they are found to be low surface brightness or dwarf galaxies.
Turning to Mn (lower panel of Figure 7), the strong decrease in [Mn/Fe] towards low metallicities is now well documented, but its origin is unclear. Two possibilities have been proposed and both have problems with the DLA data, at least at face value. If the stellar trend is due to a metallicity dependent yield of Mn in massive stars, it is difficult to explain the one DLA with [Mn/Fe] at solar [Fe/H]. On the other hand, enhanced (relative to Fe) production of Mn in Type Ia supernovae cannot explain DLAs with low [Mn/Fe] and near-solar [Si/Fe] of which there are at least two examples.
In concluding this section, it is important to stress the preliminary nature of the above conclusions which are based on the comparison of very few measurements in DLAs with a much larger body of stellar data. One of the lessons from stellar work is that there is considerable scatter, both observational and intrinsic, in the relative abundances of different elements so that most trends only become apparent when a large set of measurements has been assembled. Thus Figure 7 should be taken as no more than an illustration of the issues which can be addressed with surveys of element abundances in damped systems. Although work on element ratios in high redshift galaxies is still a long way behind its counterpart in Galactic stars, it may well play a decisive role in resolving some outstanding questions on the origin of elements.
4 The Lyman alpha Forest
The final component of the high redshift universe considered in this review is the all-pervading intergalactic medium which manifests itself as fluctuating absorption bluewards of the Ly emission line of every QSO. Observationally, the term Ly forest is used to indicate the bulk of discrete Ly absorption lines with column densities in the range cm-2; since this gas is highly ionised, it may account for most of the baryons at (Rauch 1998). Hydrodynamical simulations have shown that the Ly forest is a natural consequence of structure formation in a universe dominated by cold dark matter and bathed in a diffuse ionising background (e.g. Weinberg, Katz, & Hernquist 1998). In this picture, the physics of the absorbing gas is relatively simple and the run of optical depth (Ly) with redshift can be thought of as a ‘map’ of the density structure of the IGM along a given line of sight. At low densities, where the temperature of the gas is determined by the balance between photoionisation heating and adiabatic cooling, (Ly), where the is the overdensity of baryons . At (Ly) corresponds to a region of the IGM which is just above the average density of the universe at that time ().
The lack of associated metal lines was originally one of the defining characteristic of the Ly forest and was interpreted as evidence for a primordial origin of the clouds (Sargent et al. 1980). As it is often the case, subsequent improvements in the observations have shown this to be an oversimplification and in reality weak metal absorption, principally by C IV, is present at the redshift of most Ly clouds down to the detection limit of the data (Songaila & Cowie 1996). The degree of metal enrichment implied is relatively high, ([C/H] with a scatter of perhaps a factor of —Davé et al. 1998), in the sense that stars with significantly lower metallicities are known to exist in the halo of our Galaxy.
It is not easy to understand how the low density IGM came to be polluted so uniformly by the products of stellar nucleosynthesis at such an early epoch. While, as explained above, we see directly the outflow of metal-enriched gas in ‘superwinds’ from Lyman break galaxies at the same redshift, most of this gas is not expected to travel far from the production sites, because it is either trapped by the gravitational potential of the galaxies, if they are sufficiently massive, or is confined by the pressure of the hot IGM (Ferrara, Pettini, & Shchekinov 2000). Whether an early episode of pre-galactic star formation is required depends on whether C IV lines continue to be seen in Ly clouds of diminishing H I column density. Current limits are for (H I) cm-2 (some 75% of such Ly clouds have associated C IV absorption—Songaila & Cowie 1996) corresponding to moderately overdense gas () which in the simulations is preferentially found in the vicinity of collapsing structures and may thus reflect local, rather than universal, metal pollution.

The detection of C IV lines when (H I) is a challenging task, even with a 10-m telescope, because we are dealing with observed equivalent widths mÅ. A possible approach in these circumstances is to try and recover such a weak signal from a statistical treatment of many lines which individually are below the detection limit. Unfortunately, different analyses have reached conflicting conclusions (Lu et al. 1998; Cowie & Songaila 1998). Furthermore, a recent reappraisal of the techniques with the help of extensive simulations of the spectra has indicated that many subtle effects, such as small random differences between the redshifts of Ly and C IV absorption, make the interpretation of the results far from straightforward (Ellison et al. 1999).
A more direct way to tackle the problem is to push the detection limit further by securing spectra of exceptionally high signal-to-noise ratio; as for Lyman break galaxies this is most effectively achieved with the aid of gravitational lensing. In this way Ellison et al. (2000) were able to reach S/N in the C IV region between and 3.54 of the gravitationally lensed QSO Q1422+231 after adding together data recorded over several nights with HIRES on Keck I.
As can be seen from Figure 8, the number of weak C IV lines continues to rise as the signal-to-noise ratio of the spectra increases and any levelling off in the column density distribution presumably occurs at (C IV) cm-2. This limit is one order of magnitude more sensitive than those reached previously. In other words, we have yet to find any evidence in the Ly forest for regions of the IGM which are truly of primordial composition or have abundances as low as those of the most metal-poor stars in the Milky Way halo. Pushing the sensitivity of this search even further is certainly one of the goals for the future.
5 Conclusions
This review has covered a lot of ground reflecting the fast pace of progress in the study of element abundances at high redshift, now set to accelerate further with the forthcoming availability of new, efficient spectrographs on Keck, VLT, Subaru and Gemini. The picture which is emerging is that of a universe at with many of today’s characteristics already in place. At this epoch, Lyman break galaxies resembled closely today’s star-forming galaxies dominated by Population I stars, damped Ly systems exhibited mostly Population II chemical abundances, and the low density Ly forest may well have been the repository of the first heavy elements synthesised by Population III stars. This does not necessarily imply a one-to-one correspondence between these objects then and now, given the substantial time interval available for evolution. It is likely that Lyman break galaxies, which at trace the highest peaks in the underlying mass distribution, have through subsequent mergers evolved into today’s massive ellipticals and bulges to be found preferentially in rich clusters. It is also plausible that the gas giving rise to at least some high redshift damped Ly systems has turned into the stars of today’s spiral galaxies. And the heavy elements ejected into the IGM by the first stars which formed in low mass collapsed structures have by now presumably been augmented by the much more substantial metal-enriched outflows from successive generations of stars in more massive galaxies. Thus the lack of a clear age-metallicity relationship in our own Galaxy is reflected on a much larger scale by the universe as a whole—old (and high redshift) do not necessarily mean metal-poor.
What is clear is that much work still
needs to be done before we have a full picture
of the chemical enrichment of the universe at .
The very substantial gaps in our knowledge
evident in Figure 1 are reflected by the results of a simple
accounting exercise.
As discussed by Pettini (1999) and more recently Pagel (2000),
the comoving density of metals so far detected in the
Ly forest, damped Ly systems and Lyman break galaxies
accounts for only about 10% of the total metal production
associated with the
star formation activity we see directly at .
Presumably then, as now, at least some if not most
of the ‘missing metals’
are to be found in hot gas—in galactic halos and
(proto)clusters—which has not yet been fully
accounted for, mainly because we remain ignorant of both its
metallicity and baryon content.
Food for thought, as we enter the new millennium.
I should like to acknowledge my collaborators in the various projects described in this talk, particularly Chuck Steidel, Sara Ellison, Kurt Adelberger, David Bowen, Len Cowie, Jean-Gabriel Cuby, Mark Dickinson, Mauro Giavalisco, Alan Moorwood, Joop Schaye, Alice Shapley and Toni Songaila. I am grateful to the Royal Society and the organisers for inviting me to take part in such a stimulating discussion meeting.
References
- [1]
- [2] Centurión, M., Bonifacio, P., Molaro, P., & Vladilo, G. 1998, ApJ, 509, 620
- [3]
- [4] Cowie, L.L., & Songaila, A. 1998, Nature, 394, 44
- [5]
- [6] Davé. R., Hellsten, U., Hernquist, L., Katz, N., & Weinberg, D. 1998, ApJ, 509, 661
- [7]
- [8] Djorgovski, S.G., Pahre, M.A., Bechtold, J., & Elston, R. 1996, Nature, 382, 234
- [9]
- [10] Edvardsson, B., Andersen, J., Gustaffson, B., Lambert, D.L., Nissen, P.E., & Tomkin, J. 1993, A&A, 275, 101
- [11]
- [12] Ellison, S.L., Lewis, G.F., Pettini, M., Chaffee, F.H., & Irwin, M.J. 1999, ApJ, 520, 456
- [13]
- [14] Ellison, S.L., Songaila, A., Schaye, J., Cowie, L.L., & Pettini, M. 2000, ApJ, submitted
- [15]
- [16] Fall, S.M. 1996, in The Hubble Space Telescope and the High Redshift Universe. eds. N. Tanvir, A. Aragon-Salamanca, & J.V. Wall (Singapore: World Scientific), 303
- [17]
- [18] Ferrara, A., Pettini, M., & Shchekinov. Y. 2000, MNRAS, submitted
- [19]
- [20] Izotov, Y.I., & Thuan, T.X. 1999, ApJ, 511, 639
- [21]
- [22] Kobulnicky, H.A., & Gebhardt, K. 2000, AJ, in press (astro-ph/9911361)
- [23]
- [24] Kudritzki, R.P. 1998, in Stellar Astrophysics for the Local Group, ed. A. Aparicio, A. Herrero, & F. Sánchez(Cambridge: CUP), 149
- [25]
- [26] Le Brun, V., Bergeron, J., Boissé, P., & Deharveng, J.M. 1997, A&A, 321, 733
- [27]
- [28] Leitherer, C., et al. 1999, ApJS, 123, 3
- [29]
- [30] Lennon, D.J. 1999, Rev. Mex. Astr. Ap., in press
- [31]
- [32] Lu, L., Sargent, W.L.W., & Barlow, T.A. 1998, AJ, 115, 55
- [33]
- [34] Lu, L., Sargent, W.L.W., Barlow, T.A., Churchill, C.W., & Vogt, S.S. 1996, ApJS, 107, 475
- [35]
- [36] Lu, L., Sargent, W.L.W., Barlow, T.A., & Rauch, M. 1998, ApJ, submitted (astro-ph/9802189)
- [37]
- [38] Madau, P., Ferguson, H.C., Dickinson, M.E., Giavalisco, M., Steidel, C.C., & Fruchter, A. 1996, MNRAS, 283, 1388
- [39]
- [40] Melnick, J., Terlevich, R., & Terlevich, E. 2000, MNRAS, submitted (astro-ph/9908346)
- [41]
- [42] Mo, H.J., Mao, S., & White, S.D.M. 1999, MNRAS, 304, 175
- [43]
- [44] Nissen, P.E., Chen, Y.Q., Schuster, W.J., & Zhao, G. 2000, A&A, submitted
- [45]
- [46] Nissen, P.E., & Schuster, W.J. 1997, A&A, 326, 751
- [47]
- [48] Pagel, B.E.J. 2000, in Galaxies in the Young Universe II, ed. H. Hippelein (Berlin: Springer), in press (astro-ph/9911204)
- [49]
- [50] Pagel, B.E.J., Edmunds, M.G., Blackwell, D.E., Chun, M.S., & Smith, G. 1979, MNRAS, 189, 95
- [51]
- [52] Pei, Y.C., Fall, S.M., & Hauser, M.G. 1999, ApJ, 522, 604
- [53]
- [54] Pettini, M. 1999, in Chemical Evolution from Zero to High Redshift, ed. J. Walsh & M. Rosa (Berlin: Springer), 233
- [55]
- [56] Pettini, M., Ellison, S.L., Steidel, C.C., Shapley, A.E., & Bowen, D.V. 2000a, ApJ, in press (astro-ph/9910131)
- [57]
- [58] Pettini, M., Ellison, S.L., Steidel, C.C., & Bowen, D.V. 1999, ApJ, 510, 576
- [59]
- [60] Pettini, M., Kellogg, M., Steidel, C.C., Dickinson, M., Adelberger, K.L., & Giavalisco, M. 1998, ApJ, 508, 539
- [61]
- [62] Pettini, M., Lipman, K., & Hunstead, R.W. 1995, ApJ, 451, 100
- [63]
- [64] Pettini, M., Smith, L.J., King, D.L., & Hunstead, R.W. 1997, ApJ, 486, 665
- [65]
- [66] Pettini, M., Steidel, C.C., Adelberger, K.L., Dickinson, M., & Giavalisco, M. 2000b, ApJ, in press (astro-ph/9908007)
- [67]
- [68] Pierce, M.J., & Tully, R.B. 1992, ApJ, 387, 47
- [69]
- [70] Pilyugin, L.S. 1999, A&A, 346, 428
- [71]
- [72] Prantzos, N., & Silk, J. 1998, ApJ, 507, 229
- [73]
- [74] Prochaska, J.X., & Wolfe, A.M. 1999, ApJS, 121, 369
- [75]
- [76] Prochaska, J.X., & Wolfe, A.M. 2000, ApJ, submitted
- [77]
- [78] Rao, S.M., & Turnshek, D.A. 1998, ApJ, 500, L115
- [79]
- [80] Rao, S.M., & Turnshek, D.A. 2000, ApJ, submitted (astro-ph/9909164)
- [81]
- [82] Rauch, M. 1998, ARA&A, 36, 267
- [83]
- [84] Ryan, S.G., Norris, J.E., & Beers, T.C. 1996, ApJ, 471, 254
- [85]
- [86] Sargent, W.L.W., Young, P.J., Boksenberg, A., & Tytler, D. 1980, ApJS, 42, 41
- [87]
- [88] Seitz, S., Saglia, R.P., Bender, R., Hopp, U., Belloni, P., & Ziegler, B. 1998, MNRAS, 298, 945
- [89]
- [90] Songaila, A., & Cowie, L.L. 1996, AJ, 112, 335
- [91]
- [92] Steidel, C.C., Adelberger, K.L., Dickinson, M., Giavalisco, M., Pettini, M., & Kellogg, M. 1998, ApJ, 492, 428
- [93]
- [94] Steidel, C.C., Adelberger, K.L., Giavalisco, M., Dickinson, M., & Pettini, M. 1999, ApJ, 519, 1
- [95]
- [96] Steidel, C.C., Dickinson, M., & Persson, S.E. 1994, ApJ, 437, L75
- [97]
- [98] Steidel, C.C., Giavalisco, M., Pettini, M., Dickinson, M. & Adelberger, K.L. 1996, ApJ, 462, L17
- [99]
- [100] Steidel, C.C., Pettini, M., & Hamilton, D. 1995 D. AJ, 110, 2519
- [101]
- [102] Teplitz, H.I. et al. 2000, ApJ, in press
- [103]
- [104] Vogt, N.P. et al. 1997, ApJ, 479, L121
- [105]
- [106] Weinberg, D.H., Katz, N., & Hernquist, L. 1998, in ASP Conf. Series 128, Origins, ed. C.E. Woodward, J.M. Shull, & H.A. Thronson (San Francisco: ASP), 21
- [107]
- [108] Yee, H.K.C., Ellingson, E., Bechtold, J., Carlberg, R.G., & Cuillandre, J.-C. 1996, AJ, 111, 1783
- [109]