[
The Second Peak: The Dark-Energy Density and the Cosmic Microwave Background
Abstract
Supernova evidence for a negative-pressure dark energy (e.g., cosmological constant or quintessence) that contributes a fraction of closure density has been bolstered by the discrepancy between the total density, , suggested by the location of the first peak in the cosmic microwave background (CMB) power spectrum and the nonrelativistic-matter density obtained from dynamical measurements. Here we show that the impending identification of the location of the second peak in the CMB power spectrum will provide an immediate and independent probe of the dark-energy density. As an aside, we show how the measured height of the first peak probably already points toward a low matter density and places upper limits to the reionization optical depth and gravitational-wave amplitude.
pacs:
PACS number(s): 98.80.-k,95.35.+d,98.70.Vc,98.65.Dx,98.80.Cq CALT-68-2253]
A “cosmic-concordance” model now seems to be falling into place [1]. The central and most intriguing feature of this model is a negative-pressure dark energy (e.g., cosmological constant or quintessence) that contributes a fraction of closure density. Supernova evidence for this dark energy [2] has been bolstered by the discrepancy between the total density, , suggested by the location of the first peak in the cosmic microwave background (CMB) power spectrum [3, 4] and the nonrelativistic-matter density, , obtained from dynamical measurements.
This dark energy has implications of the utmost importance not only for cosmology, but for fundamental physics as well. It can be viewed equivalently/alternatively as a correction to general relativity or as some new exotic form of matter. It would have significant implications for the evolution of large-scale structure in the Universe, for particle theory, and possibly for quantum gravity. Theorists have expanded the realm of possibilities for this dark energy from a simple cosmological constant to quintessence, a variable cosmological constant driven by the rolling of some new scalar field [5, 6]. Given the extraordinary ramifications, it is crucial to test for a nonzero dark-energy density as thoroughly as possible. There are already several promising possibilities; e.g., statistics of gravitational-lens systems [7], the Alcock-Paczyński test [8], and cross-correlation of the CMB with some tracer of the density at lower redshifts [9].
The purpose of this article is to show that impending measurements of the location of the second peak in the CMB power spectrum will provide an additional and independent probe of the dark-energy density. We argue that the location of the second peak depends primarily on the matter density and on the Hubble constant ( in units of 100 km sec-1 Mpc-1), and plot contours of the second-peak location in the - parameter space. If the Hubble constant is fixed by independent observations (e.g., from the Hubble Space Telescope [HST]), then the second-peak location determines the matter density, or equivalently, the dark-energy density. As an aside, we also illustrate how recent measurements of the height of the first peak may already be pointing to a low value of .
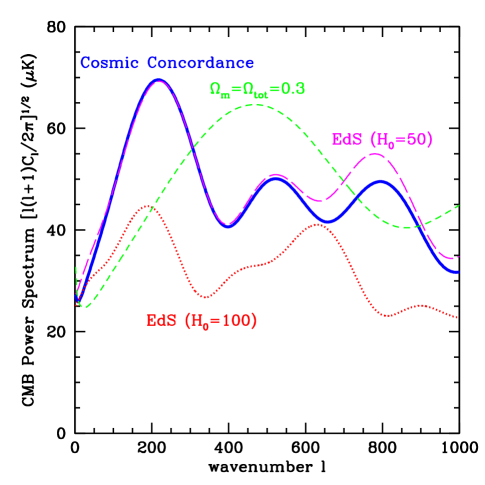
The aim of CMB mapping experiments is to measure the temperature as a function of position on the sky [10]. The temperature can then be expanded in spherical harmonics, , and rotationally invariant multipole moments (the “power spectrum”), , can be constructed. Given the values of several cosmological parameters, predictions for the power spectrum can be made; Fig. 1 shows a few models. The peak structure is due to oscillations in the primordial plasma [11].
The location in of the first peak depends strongly on and only very weakly on the values of other cosmological parameters, and so it provides a robust indicator of the geometry of the Universe [12]. A compilation of data from a number of recent experiments indicates a peak near , and data from the test flight of BOOMERANG clearly shows a peak at this location. We thus assume that, as argued by Dodelson and Knox [3], the verdict is in: the Universe is flat.***Strictly speaking, such a peak location could be fit in an open or closed Universe with combinations of very strange values for other cosmological parameters (e.g., [13]). We realize this as a mathematical possibility, but a physical improbability.
If the geometry is fixed, the location of the second peak in the CMB power spectrum depends primarily (though not entirely) on the expansion rate of the Universe at the epoch of recombination [14], and this depends on the nonrelativistic-matter density and the Hubble constant. In principle, variations in several other parameters can change the precise location of the second peak. However, the second-peak location shifts very little as each of these uncertain parameters is allowed to vary within its acceptable range. For example, if measurements of the deuterium abundance fix [15], as Tytler asserts, then allowable shifts in the baryon-to-photon ratio produce negligible shifts in the location of the second peak. To be safe, we show results below for the more conservative range, , advocated by Olive, Steigman, and Walker [16]. The spectral index of primordial density perturbations changes the amplitudes of the peaks, but allowable variations in ( [17]) lead to even smaller uncertainties in the second-peak location than those from uncertainty in the baryon density. Moreover, a more recent analysis that includes constraints from degree-scale CMB anisotropies and large-scale structure finds that the allowed range for is much tighter—within 5% of unity [18]. Reionization may reduce the amplitudes of all the peaks, but it will not strongly affect their locations, and the same is true of gravitational waves. Plausible neutrino masses would have a negligible effect on the peak locations [19]. Higher-order effects, such as weak gravitational lensing [20], the Rees-Sciama effect [21], or unsubtracted foregrounds would primarily affect the heights or shapes of the peaks but leave their locations intact. The second-peak location is similarly insensitive to whether the dark energy is a cosmological constant or quintessence [6]. We also expect magnetic fields to have no more than a small effect on the peak location [22].
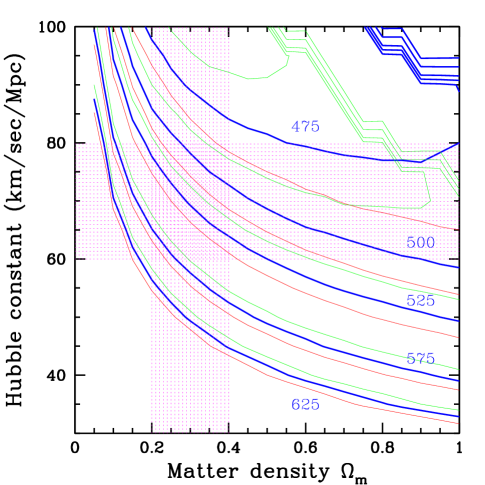
Fig. 2 shows contours of , the location of the second peak, in the two-dimensional parameter space (,) in which it varies most strongly. Results are shown for the allowable range of . Had we included contours for and , they would have fallen very well within the range spanned by the allowed values of the baryon-to-photon ratio.
The location of the second peak picks out a specific contour in the - plane. When combined with the range, [23], allowed by HST, determination of the second-peak location will provide a constraint to the matter density. For example, if the second peak turns out to be located at , then it will suggest (for the entire allowable range for ). A value will allow (likewise, for the allowed range of ). If it turns out that , then a broader range of larger values, , will be allowed. Smaller values of allow larger values of , and they are also less constraining. If , as suggested by supernova data [2], then the second peak must be at .
The contours in Fig. 2 show that jumps to very large values for large and large (the upper right-hand corner). In this region of parameter space, the amplitude of the second peak actually becomes so small that the second peak disappears, and the de facto second peak is what would have otherwise been the third peak. To illustrate, the long-dash (magenta) curve in Fig. 1 shows the for , , and . The region of the - parameter space in which this confusion between the second and third peaks arises conflicts with the age of the Universe, the shape of the power spectrum, and as discussed below, the amplitude of the first peak. We therefore dwell no further on this possibility.
There are some caveats we should make. The allowed range of for any given value of can be broadened if a larger range of values for the Hubble constant are allowed. So, for example, if the second peak is found to be at , it will be possible that , but only if the Hubble constant is , considerably lower than the HST value. (This could be tested further with the third peak, as indicated in Fig. 1.) A smaller baryon density would shift the second peak to larger values of and thus allow slightly larger values of for fixed . However, such small values of the baryon density would conflict not only with Tytler’s results, but would be additionally discordant with baryon abundances in x-ray clusters. Some combination of other effects (e.g., the optical depth, primordial spectrum, neutrino masses, recombination history, etc.) could move the peak, but such a conspiracy seems unlikely. Thus, the weakest link in the relation between and is probably uncertainty in the Hubble constant, as indicated in Fig. 2. Even if independent measurements of the Hubble constant are discarded, the location of the second peak will provide a useful constraint to the - parameter space.
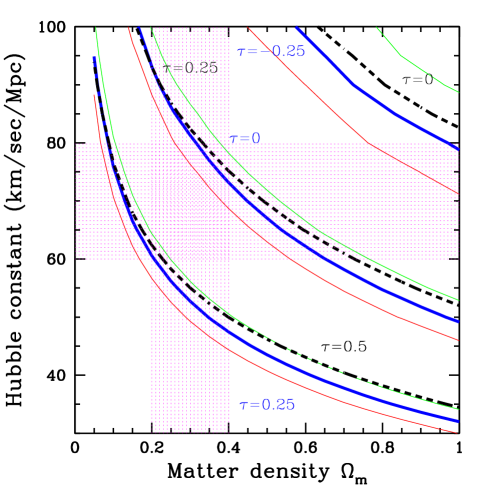
The main focus here is on the location of the second peak. However, it is easy and important to see that the observed height of the first peak already points toward a low density if primordial perturbations have a flat scale-invariant (i.e., ) spectrum. It is natural to expect that at least some small fraction of CMB photons re-scattered from reionized electrons after the nominal surface of last scatter at redshift . If so, then the amplitude of the peaks in the power spectrum will be suppressed by a factor . Fig. 3 shows contours of the optical depth inferred by comparing the predicted height of the first peak with the measured value of K for the allowable range of , and for a flat (i.e., ) primordial spectrum and for an primordial spectrum. Since is impossible, those regions of parameter space in which is inferred are ruled out. If primordial perturbations have a flat spectrum, then the amplitude of the first peak thus rules out a considerable portion of the high-–high- parameter space. Moreover, notice that a shift of 0.2 in is roughly equivalent to a shift of about 0.25 in . Thus, constraints to the - parameter space from the height of the first peak can be relaxed if the spectral index is raised a bit, while models with are likely inconsistent as they would require a negative optical depth over virtually the entire plausible range of and . The constraints may also be relaxed if the actual amplitude is a bit different than the value, 70 K, used here, as may be allowed by reasonable calibration and/or statistical uncertainties.
It is also interesting to note that in currently favored models (i.e., cosmic-concordance models with ), the optical depth to the surface of last scatter cannot be too large, . A stochastic gravitational-wave background could mimic the effect of reionization by supplying power on large angular scales at which the CMB power spectrum is normalized to the COBE amplitude. Thus, the upper limits to can be translated directly to upper limits to the gravitational-wave amplitude (see [10] for a precise definition) by identifying with . Doing so, the nominal limit suggests that no more than one-third the large-angle power in the CMB is due to gravitational-waves, and this improves slightly the limit to the gravitational-wave amplitude from COBE [24].
It has long been appreciated that the richness of the peak structure in the CMB power spectrum will eventually allow simultaneous determination of a number of cosmological parameters [25] when the CMB power spectrum is measured with sufficient precision. However, it has also been repeatedly emphasized that a strong degeneracy in the parameter space exists (e.g., [13]), as indicated, for example, by the elongation of the error ellipses forecast for MAP and Planck along the line in the - parameter space (e.g., Fig. 2 in Ref. [26]). In this paper, we have noted that by implementing recent measurements of the geometry, baryon density, and especially the Hubble constant, we can break this degeneracy and thus link the location of the second peak fairly robustly to the cosmological constant.†††The value of changes considerably as one goes from one end of the aforementioned CMB ellipse in the - parameter space to the other end. This observation is additionally noteworthy given the accumulation of independent evidence for some sort of dark energy, the identification of the first peak, and the approaching discovery of the second peak. Thus, by visual inspection alone, we may be able to learn something significant about the cosmological constant once the second peak is identified. Of course, mapping the second peak is also of the utmost importance as it will provide additional confirmation of the paradigm of structure formation from primordial adiabatic perturbations that underlies the entire analysis. We thus eagerly await the discovery of the second peak.
We thank P. Ullio for useful comments. We used CMBFAST [27] to calculate the power spectra. This work was supported in part by the DoE, NSF, and NASA. AB also acknowledges the support of a Lee A. DuBridge Fellowship.
REFERENCES
- [1] E.g., J. P. Ostriker and P. J. Steinhardt, Nature 377, 600 (1995); L. M. Krauss and M. S. Turner, Gen. Rel. Grav. 27, 1137 (1995); N. A. Bahcall et al., Science 284, 1481 (1999).
- [2] S. Perlmutter et al., Astrophys. J. 517, 565 (1999); A. G. Riess et al., Astron. J. 116, 1009 (1998).
- [3] See, e.g., S. Dodelson and L. Knox, astro-ph/9909454, and references therein.
- [4] A. Melchiorri et al., astro-ph/9911445.
- [5] E.g., K. Coble, S. Dodelson, and J. Frieman, Phys. Rev. D 55, 1851 (1997); V. Silveira and I. Waga, Phys. Rev. D 56, 4626 (1997); M. S. Turner and M. White, Phys. Rev. D 56, 4439 (1997).
- [6] R. R. Caldwell, R. Dave, and P. J. Steinhardt, Phys. Rev. Lett. 80, 1582 (1998);
- [7] M. Fukugita and E. L. Turner, Mon. Not. R. Astr. Soc. 253, 99 (1991); C. Kochanek, Astrophys. J. 419, 12 (1993).
- [8] C. Alcock and B. Paczyński, Nature 251, 358 (1979); L. Hui, A. Stebbins, and S. Burles, Astrophys. J. Lett. 511, L5 (1999); P. McDonald and J. Miralda-Escudé, Astrophys. J. 518, 24 (1999).
- [9] R. G. Crittenden and N. G. Turok Phys. Rev. Lett. 76, 575 (1996); S. P. Boughn, R. G. Crittenden, and N. G. Turok, New Astron. 3, 275 (1998); A. Kinkhabwala and M. Kamionkowski, Phys. Rev. Lett. 82, 4172 (1999); M. Zaldarriaga and U. Seljak, Phys. Rev. D 60, 043504 (1999).
- [10] For a recent review, see M. Kamionkowski and A. Kosowsky, Ann. Rev. Nucl. Part. Sci. 49, 77 (1999).
- [11] R. A. Sunyaev and Ya. B. Zeldovich, Astrophys. Sp. Sci. 7, 3 (1970); P. J. E. Peebles and J. T. Yu, Astrophys. J. 162, 815 (1970).
- [12] M. Kamionkowski, D. N. Spergel, and N. Sugiyama, Astrophys. J. Lett. 426, L57 (1994); G. Jungman, M. Kamionkowski, A. Kosowsky, and D. N. Spergel, Phys. Rev. Lett. 76, 1007 (1996).
- [13] M. Zaldarriaga, D. Spergel, and U. Seljak, Astrophys. J. 488, 1 (1997).
- [14] W. Hu and N. Sugiyama, Astrophys. J. 471, 542 (1995).
- [15] S. Burles and D. Tytler, astro-ph/9803071.
- [16] K. A. Olive, G. Steigman, and T. P. Walker, astro-ph/9905320.
- [17] K. M. Gorski et al., Astrophys. J. Lett. 464, L11 (1996).
- [18] J. R. Bond and A. H. Jaffe, astro-ph/9809043.
- [19] S. Dodelson, E. Gates, and A. Stebbins, Astrophys. J. 467, 10 (1996); C.-P. Ma and E. Bertschinger, Astrophys. J. 455, 7 (1995); R. E. Lopez et al., Phys. Rev. Lett. 82, 3952 (1999).
- [20] E.g., U. Seljak, Astrophys. J. 463, 1 (1996).
- [21] E.g., M. J. Rees and D. W. Sciama, Nature 517, 611 (1968); U. Seljak, Astrophys. J. 460, 549 (1996); R. Tuluie, P. Laguna, and P. Anninos, Astrophys. J. 463, 15 (1996).
- [22] J. Adams et al., Phys. Lett. B 388, 253 (1996).
- [23] J. R. Mould et al., astro-ph/9909260.
- [24] J. P. Zibin, D. Scott, and M. White, Phys. Rev. D 60, 123513 (1999).
- [25] G. Jungman, M. Kamionkowski, A. Kosowsky, and D. N. Spergel, Phys. Rev. D 54, 1332 (1996).
- [26] M. Tegmark, D. J. Eisenstein, and W. Hu, astro-ph/9805117.
- [27] M. Zaldarriaga and U. Seljak, Phys. Rev. D 55, 1830 (1997).