Studies of Low-Mass Star Formation with ALMA
Abstract
ALMA will revolutionize the study of star formation by providing a combination of angular resolution and sensitivity that far exceeds that of present instruments. I will focus on studies of relatively isolated cores that are forming low-mass stars. There is a general paradigm for the formation of such stars, and there are detailed theoretical predictions for the evolution of the density and velocity fields for different assumptions about the initial conditions. Because the theory is well developed, observational tests are particularly revealing. The primary probes of physical conditions in these regions are discussed and the sensitivity of ALMA to these probes is shown and compared to the current state of the art. The consequences for the ALMA requirements are discussed.
Department of Astronomy, The University of Texas at Austin Austin, TX 78712-1083
1. Introduction
The focus in this paper will be on regions forming low mass stars in relative isolation, as other papers are covering issues of massive star formation and clustered star formation. Isolated star formation is interesting for several reasons. An empirical evolutionary scheme (Lada 1987, André et al. 1993) is generally accepted. There is a well-established theory (Shu et al. 1987) and variations (e.g., Foster & Chevalier 1993; Henriksen, André, & Bontemps 1997; McLaughlin & Pudritz 1997) that can be tested by observations. It is particularly suited to studies connecting star formation to planet formation.
The two primary probes of the conditions in star-forming cores are continuum emission from dust and spectral lines from molecules. These are complementary in many ways. The dust emission is not affected by molecular depletion and traces column density very effectively, but dust grain sizes may be a function of the environment, or gas and dust distributions may differ because of ambipolar diffusion. In principle, molecular spectroscopy probes the local density and velocity fields, but it is sensitive to variations in chemical abundances. Together, these two probes can be very powerful. With ALMA, a hybrid probe will become widely available: molecular line absorption against emission from compact dust components, such as circumstellar disks.
The exquisite sensitivity of ALMA to continuum emission will allow us to map the detailed structure of the dust column density in many cores, ranging along the evolutionary sequence, to trace the flow of matter from large scales to disks and stars. Together with information from other wavelength regions, a complete picture of the distribution of dust temperature and column density will result, along with information on possible changes in the grain size distribution.
Maps of optically thin, thermally excited tracers will provide column densities of gas, for comparison to those of dust measured by the continuum emission. The molecular spectroscopy of lines with subthermal excitation will yield direct estimates of the local density. Combined studies of optically thick and thin lines will reveal the kinematics in detail. Finally, absorption spectroscopy of the material in front of opaque disks will be a new capability of ALMA that will help to unravel the complex velocity fields involved in forming stars.
The dust continuum emission provides a probe of mass (), total gas column density (), dust temperature (), grain properties, and the component of the magnetic field projected on the sky (). Molecular line emission can probe the gas kinetic temperature (), volume density (), velocity field (), abundances (), and the line-of-sight component of the magnetic field (). A more detailed discussion of these probes can be found in Evans (1999).
2. Dust Continuum Emission
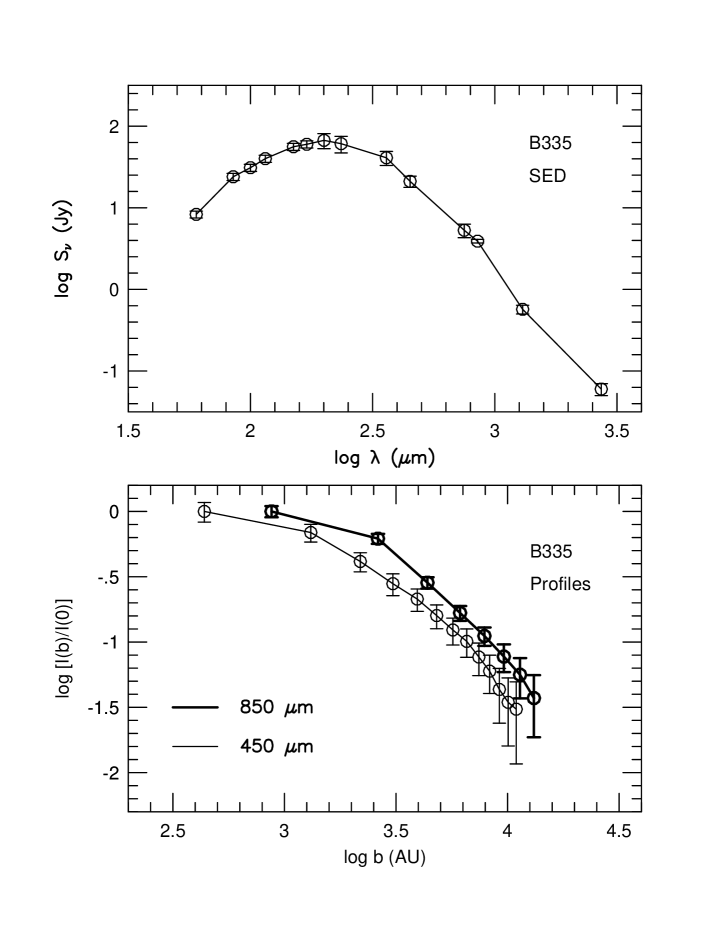
The dust continuum emission provides a probe of the total amount and distribution of the dust. If the dust and gas are well mixed, these quantities can be translated into the same information about the gas. One caveat is that the dust opacity may change from source to source or even within a single source (e.g., Visser et al. 1998). The primary tool that has been used in the past is the spectral energy distribution, or SED (), which gives information on the source luminosity, by integrating under the SED. The mass can be determined by observing the flux in large beams at large enough that the emission is optically thin. With suitable radiative transport codes (e.g. Egan, Leung, & Spagna 1988), source models constrained by the SED can yield the distribution of the dust temperature () for a given set of grain properties. Matching different parts of the SED can constrain the choice of grain opacities (Adams, Lada, & Shu 1987; Butner et al. 1991; van der Tak et al. 1999).
More recently, spatially resolved studies of the intensity of dust continuum emission have become a powerful probe. New instruments operating at submillimeter wavelengths have provided an enormous increase in this kind of data (e.g., Johnstone & Bally 1999; Motte, André, & Neri 1998). Maps of polarized dust emission are starting to provide maps of (Greaves et al. 1999; Rao et al. 1998). By taking cuts through maps or by azimuthally averaging the intensity, one obtains , the intensity as a function of impact parameter (), the separation of the beam from the center of emission. Plots of provide probes of column density as a function of impact parameter , and with modeling, the density distribution , which is predicted by theories of isolated low-mass star formation. Recent examples of such studies are those of Chandler & Richer (2000), Hogerheijde & Sandell (2000) and Shirley et al. (2000). They reveal steeper density gradients than were apparent from most studies of molecular lines. An example of an SED and determinations of are shown in Fig. 1 for B335, a well-studied region of low mass star formation.
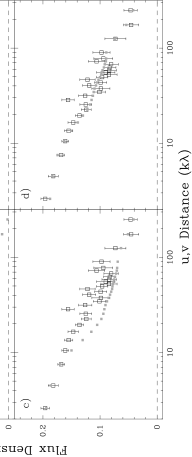
Interferometers naturally provide a complementary probe to , the spatial visibility function (), which can also be compared to models. This approach is especially well suited to distinguishing compact structures, such as disks, from the envelope. An example of how this capability can separate components that would be otherwise indistinguishable is given in Fig. 2, taken from Looney, Mundy, & Welch (1997).
To discuss the sensitivity of ALMA to dust continuum emission, we make some simplifying assumptions: the Rayleigh-Jeans limit is valid; the emission is optically thin; the dust opacity follows
| (1) |
and the resolution is diffraction-limited (, where is the maximum dimension of the array). Then the sensitivity to dust emission can be expressed in terms of the product of gas column density and dust temperature:
| (2) |
or, in terms of visual extinction,
| (3) |
Alternatively, one can describe the sensitivity to gas mass in Earth masses given a distance ():
| (4) |
The fiducial distance of 140 pc is a typical distance to nearby regions that are forming low-mass stars. These equations can be generalized to the case where the Rayleigh-Jeans approximation fails, at the cost of some clarity. These expressions will suffice to illustrate the main points, if we bear in mind that Rayleigh-Jeans failure will first tend to decrease the sensitivity to column density or mass at the shorter wavelengths.
In calculating sensitivities, I have used the values of given by Butler & Wootten (1999), for 1.5 mm of precipitable water vapor (PWV). The values are for 1 noise after 60 sec of integration. This would correspond to 22 in an 8 hour integration. The resulting plots of and versus are shown in Fig. 3, along with a plot of the spatial resolution in AU at a distance of 140 pc. The plot is truncated at 3 mm to allow the shorter wavelengths to be seen clearly. Note that mm have comparable sensitivity to column density, with much better sensitivity in compact configurations. For the most compact configuration, ALMA could detect cm-2 ( mag) at K. The sensitivity to mass is best at mm for the standard water vapor. The mass sensitivity is even better at the shortest wavelengths if the PWV drops to 0.35 mm (crosses in the top panel), but only if the dust is warm enough that the Rayleigh-Jeans limit applies (K at 850 GHz).

To put things in perspective, ALMA can detect the dust emission from 0.3 of gas at K at mm! Another useful comparison is to the current state of the art. Table 1 shows the comparison between ALMA and SCUBA on the JCMT, assuming roughly comparable PWV, at mm.
| Quantity | SCUBA | ALMA | ALMA |
|---|---|---|---|
| km | km | ||
| 40 | 0.11 | 0.11 | |
| (arcsec) | 15 | 1.1 | 0.02 |
| (AU at 140 pc) | 2100 | 150 | 3.0 |
| (mag-K) | 19 | 9.6 | |
| (at 140 pc) | 34 | 34 |
It is clear from the figure and table that ALMA will take us into new regimes of sensitivity and resolution, allowing study of and hence to much finer scales than currently possible. The key requirement for this work is spatial dynamic range. Sensitivity to the largest relevant spatial scales is a challenge for any interferometer, and ALMA must solve this problem.
3. Molecular Line Emission
Mapping molecular line emission provides a wealth of information about star forming regions. Transitions between levels in thermal equilibrium (CO, some transitions of H2CO, CH3CN, etc.) provide , while transitions between levels not in thermal equilibrium allow a measure of . The latter however is coupled to the abundance because of trapping, and multiple transitions of a single molecule are needed to separate these effects. In the simplest model, a homogeneous cloud, one derives a weighted mean density along each line of sight. For more sophisticated models (e.g., power laws and collapse models), the data constrain the model parameters.
The line profiles contain vital information about the velocity field. While this has been difficult to extract, in some cases it is possible to learn about rotation (Goodman et al. 1993), infall (Myers, Evans, & Ohashi 2000), and outflow (Bachiller 1996). For a few transitions, the line profile, observed with suitable polarization, yields (e.g., Crutcher 1999).
The key instrumental parameters for molecular line emission are the beam size and the velocity resolution. Butler & Wootten (1999) give the formula for the line radiation temperature (proportional to intensity) for the case of diffraction-limited beams and velocity resolution of 1 km s-1:
| (5) |
While bright lines may be observed with diffraction-limited beams, choosing a fixed beam of 1′′ provides a convenient benchmark for weak lines. In this case,
| (6) |
where is the sensitivity (1 in 60 sec) in a 1 km s-1 band from Butler & Wootten (1999), and is the velocity resolution in km s-1.
The current state of the art for interferometers using is about 1000 mJy at 110 GHz. For ALMA, is less than 10 mJy up to 345 GHz, implying a gain of a factor of 100. Values of K can be achieved from 0.35 to 2.7mm, even with PWV of 1.5 mm. Such sensitivity will allow detailed mapping of the temperature, density, and velocity field at an unprecedented scale. Figure 4 shows plots of for km s-1 for both constant () and for diffraction-limited beams.

In addition to the ALMA requirements for sensitivity, spatial resolution, and spatial dynamic range established for continuum observations, line studies of molecular clouds add velocity resolution (must be easily variable and very fine) and frequency coverage (needed to cover the range of transitions and molecules needed for a full analysis). The baseline ALMA sensitivity for line radiation observed with diffraction-limited resolution and large baselines is marginal. Observing lines at very high spatial and spectral resolution will stretch ALMA to its limit in sensitivity.
4. Molecular Line Absorption Against Continuum Sources
This technique, familiar at cm wavelengths, has only recently become possible in regions forming low mass stars (e.g., Choi, Panis, & Evans 1999). The background source is a compact dust continuum source, plausibly a circumstellar disk or perhaps the inner part of the envelope. With current instruments, only a few disks are strong enough to produce absorption lines from molecular gas in front. ALMA will make this a routine probe. Because the disk lies at the center of the infalling envelope, only gas in front of the disk will show absorption, while the rest of the cloud will produce emission. This selection provides a clear-cut way to resolve the infall-outflow ambiguity that plagues studies of cloud collapse. For a beam that includes only an opaque disk, only the front half of the cloud will be seen in absorption. For larger beams, the surrounding cloud will produce emission, resulting in an inverse P-Cygni profile for infall. The sensitivities for line emission are sufficient that most disks can be used in this way.
5. Summary and Requirements
ALMA will provide a tremendous advance in capability for studies of isolated low-mass star formation. The key probes are dust continuum emission and molecular line emission. A new capability, molecular line absorption against circumstellar disks, will become routine, allowing clear-cut resolution of infall-outflow ambiguities.
The requirements on ALMA for dust continuum emission are very low receiver temperatures and wide bandwidths, coverage of a wide range of wavelengths, and very good coverage of the uv plane. The last of these is particularly important, as star formation is intrinsically a multiscale problem, with essential information on scales ranging from a few AU to at least a few times AU. For spectral lines, the large bandwidth requirement is replaced by the need for a flexible correlator capable of velocity resolution as good as 0.01 km s-1. The requirement for a wide range of wavelengths is stiffened to essentially complete coverage of the bands that penetrate the atmosphere.
This work has been supported by the State of Texas and NASA grant NAG5-7203. L. Looney and Y. Shirley provided figures.
References
Adams, F. C., Lada, C. J., & Shu, F. H. 1987, ApJ, 312, 788
André, P., Ward-Thompson, D., & Barsony, M. 1993, ApJ, 406, 122
Bachiller, R. 1996, ARA&A, 34, 111
Butler, B., and Wootten, A. 1999, ALMA Memo. No. 276
Butner, H. M., Evans, N. J., II, Lester, D. F., Levreault, R. M., & Strom, S. E. 1991, ApJ, 376, 636
Chandler, C. J., & Richer, J. S. 2000, ApJ, in press
Choi, M., Panis, J-F., & Evans, N. J., II 1999, ApJS, 122, 519
Crutcher, R. M., 1999, ApJ, 520, 706
Egan, M. P., Leung, C. M., & Spagna, G. R., Jr. 1988, Computer Physics Communications, 48, 271
Evans, N. J., II 1999, ARA&A, 37, 311
Foster, P. N., & Chevalier, R. A. 1993, ApJ, 416, 303
Goodman, A. A., Benson, P. J., Fuller, G. A., & Myers, P. C. 1993, ApJ, 406, 528
Greaves, J. S., Holland, W. W., Friberg, P., & Dent, W. R. F. 1999, ApJ, 512, L139
Henriksen, R. N., André, P., & Bontemps, S. 1997, A&A, 323, 549
Hogerheijde, M. R., & Sandell, G. 2000, ApJ, in press
Johnstone, D., & Bally, J. 1999, ApJ, 510, L49
Lada, C. J. 1987 in IAU Symp 115, Star Forming Regions, ed. M. Peimbert & J. Jugaku (Dordrecht: Reidel), 1
Looney, L. W., Mundy, L. G., & Welch, W. J. 1997, ApJ, 484, L157
McLaughlin, D. E., & Pudritz, R. E. 1997, ApJ, 476, 750
Motte, F., André, P., & Neri, R. 1998, A&A, 336, 150
Myers, P. C., Evans, N. J., II, & Ohashi, N. 2000, in Protostars and Planets IV, ed. V. Mannings, A. Boss, & S. Russell (Tucson: Univ. Arizona), in press
Rao, R., Crutcher, R. M., Plambeck, R. L., & Wright, M. C. H. 1998, ApJ, 502, L75
Shirley, Y. L., Evans, N. J., II, Rawlings, J. M. C., Gregersen, E. M. 2000, ApJ, submitted
Shu, F. H., Adams, F. C., & Lizano, S. 1987, ARA&A, 25, 23
van der Tak, F. F. S. van Dishoeck, E. F., Evans, N. J., II, Bakker, E., & Blake, G. A. 1999, ApJ, 522, 991
Visser, A. E., Richer, J. S., Chandler, C. J., & Padman, R. 1998, MNRAS, 301, 585