Testing envelope models of young stellar objects with submillimeter continuum and molecular-line observations
Abstract
Theoretical models of star formation make predictions about the density and velocity structure of the envelopes surrounding isolated, low-mass young stars. This paper tests such models through high quality submillimeter continuum imaging of four embedded young stellar objects in Taurus and previously obtained molecular-line data. Observations carried out with the Submillimeter Continuum Bolometer Array on the James Clerk Maxwell Telescope at 850 and 450 m of L1489 IRS, L1535 IRS, L1527 IRS, and TMC 1 reveal AU elongated structures embedded in extended envelopes. The density distribution in these envelopes is equally well fit by a radial power-law of index –2.0 or with a collapse model such as that of Shu (1997: ApJ, 214, 488). This inside-out collapse model predicts 13CO, C18O, HCO+, and H13CO+ line profiles which closely match observed spectra toward three of our four sources. This shows that the inside-out collapse model offers a good description of YSO envelopes, but also that reliable constraints on its parameters require independent measurements of the density and the velocity structure, e.g., through continuum and line observations. For the remaining source, L1489 IRS, we find that a model consisting of a 2000 AU radius, rotating, disk-like structure better describes the data. Possibly, this source is in transition between the embedded Class I and the optically revealed T Tauri phases. The spectral index of the dust emissivity decreases from –2.0 in the extended envelope to in the central peaks, indicating grain growth or high optical depth on small scales. The observations of L1527 IRS reveal warm ( K) material outlining, and presumably heated by, its bipolar outflow. This material comprises , comparable to the amount of swept-up CO but only 10% of the total envelope mass. Two apparently starless cores are found at AU from L1489 IRS and L1535 IRS. They are cold, 10–15 K, contain 0.5–3.0 , and have flat density distributions characterized by a Gaussian of AU FWHM. The proximity of these cores shows that star formation in truly isolated cores is rare even in Taurus.
1 Introduction
Of the two currently identified modes of low-mass star formation, viz. formation of clusters in giant molecular clouds and isolated star formation in dark molecular clouds, the latter is by far the best studied (for recent reviews on star formation, see Lada & Kylafis, 1999; Mannings, Boss, & Russell, 2000). Theoretical models make definite predictions for the density and velocity structure of these collapsing cores (Shu, 1977; Terebey, Shu, & Cassen, 1984; Safier, McKee, & Stahler, 1997; McLaughlin & Pudritz, 1997; Foster & Chevalier, 1993), and several ways exist to test these observationally. Molecular lines probe the density as well as the velocity distribution, but are subject to changes in the chemistry and may be affected by the bipolar outflows driven by many, if not all, young stellar objects (YSOs). Continuum emission from dust at (sub) millimeter wavelengths suffers less from these effects, but only traces the column density integrated along the line of sight and is insensitive to the velocity field. This paper presents submillimeter continuum observations of four low-mass YSOs in Taurus: L1489 IRS, L1535 IRS, L1527 IRS, and TMC 1. We test the often-used model of Shu (1977) by using the model parameters inferred from the continuum emission to predict line profiles and comparing these to previously obtained spectra.
In the ‘standard picture’ of low-mass star formation, as described, e.g., in Shu et al. (1993), cloud cores are initially supported by magnetic fields. As the neutral molecules slip past the field lines through ambipolar diffusion, the density distribution approaches that of a singular isothermal sphere: (Lizano & Shu, 1989; Basu & Mouschovias, 1994). After its center can no longer be supported, the core starts to collapse at time from the inside-out. Shu (1977) found a self-similar solution of the collapse using as spatial coordinate , where is the location of the head of the collapse expansion wave with the sound speed. Just inside , the density profile is relatively flat, with , but steepens to as material approaches free-fall further in. In other words, the density profile can be roughly represented by with –2. The corresponding velocities increase from to , characteristic of free fall.
The inside-out collapse model constructed by Shu (1977) is a very simple one, and many authors have extended it to larger degrees of realism, including rotation (Terebey, Shu, & Cassen, 1984) and magnetic fields (Galli & Shu, 1993; Li & Shu, 1996, 1997; Galli et al., 1999). The directional dependence of cloud support in these cases leads to the formation of a flattened structure at the center of the collapsing envelope, merging into a centrifugally supported circumstellar disk. Entirely different approaches to cloud collapse are proposed by Whitworth & Summers (1985); Foster & Chevalier (1993); McLaughlin & Pudritz (1997); and Safier, McKee, & Stahler (1997). However, the simplicity of Shu’s model has made it very popular for the analysis of continuum and line data. Many authors have confirmed its success in explaining the broad-band spectral energy distributions (SEDs) of embedded YSOs (Adams, Lada, & Shu, 1987; Ladd et al., 1991a). Their envelopes follow a radial power law with negative index between 1 and 2 (Ladd et al., 1991b; Chandler, Barsony, & Moore, 1998; Hogerheijde et al., 1999), while cores which do not (yet) contain an embedded star have density distributions which are much flatter at their center (Ward-Thompson et al., 1994; André, Ward-Thompson, & Motte, 1996; Motte, André, & Neri, 1998). Molecular-line profiles observed toward YSO envelopes can be fitted with the inside-out collapse model as well (e.g. Zhou et al., 1993; Zhou, 1995; Zhou, Evans, & Wang, 1996; Choi et al., 1995; Saito et al., 1999; Hogerheijde, 1998). The infalling motions of collapse models result in the so-called infall asymmetry in self-absorbed lines profiles, with the blue peak stronger than the red one. This signature is detected toward a majority of deeply embedded objects (Mardones et al., 1997; Gregersen et al., 1997).
This paper investigates collapse models as descriptions of the envelopes around embedded YSOs through 850 and 450 m observations of pc fields with the powerful Submillimeter Common User Bolometer Array (SCUBA) on the James Clerk Maxwell Telescope (JCMT). We use the inside-out collapse model of Shu (1977) as a template for collapse models because of its simplicity and because it is so often invoked in the literature: a critical investigation of this model’s ability to fit the high quality continuum data from SCUBA together with molecular line profiles seems warranted. The four sources of our sample (L1489 IRS = IRAS 04016+2610; L1535 IRS = 04325+2402; L1527 IRS = 04368+2557; and TMC 1 = 04381+2540) are all low-mass embedded Class I YSOs (see Lada, 1987; André, Ward-Thompson, & Barsony, 1993, for definitions of YSO classes); L1527 IRS particularly deeply embedded and sometimes referred to as a Class 0 object. They have low bolometric luminosities of 0.7–3.7 and estimated stellar masses (for a more detailed description of their characteristics, see Hogerheijde et al., 1997, 1998). Previous continuum observations, of lower signal-to-noise and covering smaller fields of view, are reported by Ladd et al. (1991a, b) and Chandler, Barsony, & Moore (1998). Recently, Chandler & Richer (1999) and Shirley et al. (1998) reported very similar results using SCUBA observations of YSOs including L1527 IRS. Our work stands apart from these papers in that it also considers the velocity structure of the envelopes as measured through molecular lines.
After describing the observations and their reduction (§2), section 3 discusses the characteristics of the emission. Section 4 first analyzes the extended emission in terms of a power-law density distribution (§4.1) followed by the inside-out collapse model (§4.2). We then verify the derived model parameters by comparing the calculated line profiles to observed spectra (§4.3). The paper continues with a discussion of the implications of our modeling (§5.1) and of the properties of L1489 IRS (§5.2), for which a different model description seems required. Section 5.3 discusses in more detail the central 2000 AU of the envelopes, where different conditions may exist. The properties of two starless cores identified near L1489 IRS and L1535 IRS are discussed in §5.4. A brief summary of our main findings concludes the paper in section 6.
2 Observations and reduction
We observed the submillimeter-continuum emission of four low-mass YSOs in Taurus in 1997 September and December, and 1998 January using SCUBA on the JCMT111The James Clerk Maxwell Telescope is operated by the Joint Astronomy Centre on behalf of the Particle Physics and Astronomy Research Council of the United Kingdom, the Netherlands Organization for Scientific Research and the National Research Council of Canada., on Mauna Kea, Hawaii. SCUBA is a bolometer array camera with a long-wavelength array of 37 pixels and a short-wavelength array of 92 pixels. Both arrays can be used simultaneously. In our observations the arrays were set to 850 and 450 m, respectively. Holland et al. (1999) describes the instrument and its observing modes in detail; this section only gives a short description of our observations and their specific details.
All observations were done as 64-point ‘jiggle’ maps, where the secondary mirror is used to produce a Nyquist-sampled image of the 450 m array by chopping at a frequency of 7.8125 Hz. To cancel sky variations this jiggle pattern is split into four 16-point sub-patterns of 1 second integration time per point, after which the telescope nods to the negative beam and repeats the pattern. The complete 64-point pattern takes 128 seconds, with 64 seconds spent looking at the sky on each side of the array. Because of this sky-subtraction, jiggle-maps can only be made of sources which are smaller along the chop direction than the throw distance. In practice this translates to ; larger chop throws result in poor sky subtraction and degradation of the image quality.
Most of our observations were done in service mode and always in stable night-time conditions with an initial chop in azimuth. If the observations spanned several nights, we inspected the first night’s results and modified the chop throw or the offset of the array to include as much extended emission as possible. Each observing sequence started with a pointing check on a nearby blazar or secondary calibrator, followed by 5–10 integrations on the target and another pointing check. Any pointing drifts were corrected for by linear interpolation in azimuth and elevation.
Table 1 lists the best-fit source positions, observing dates, number of integrations, and chop throw position angle. Most observations were done in excellent or good sub-millimeter conditions, with typical zenith opacities at 850 m of 0.1–0.3 and seeing of 02–05. Only a few observations were done during marginal sub-millimeter nights, in which case we only used the 850 m data. In 1997 September we used Uranus as a primary calibrator, but for our observations in 1997 December and 1998 January we only used the secondary calibrators CRL 618 and HL Tau. The 850 m and 450 m optical depth was estimated from the 1.3 mm opacity monitor at the Caltech Submillimeter Observatory, and occasionally double-checked with 850 m sky dips with SCUBA.
The data were reduced in a standard way using the SCUBA reduction package SURF (Jenness & Lightfoot, 1997). We took extreme care to inspect the images and blank out any bolometers suspected to have chopped onto source emission. This could not be avoided for L1535 IRS, since the data were taken in only one night and the chop direction could not be corrected later. The images of L1489 IRS are also likely to be affected at their northeast edge, where the emission goes to zero coincident with the chop direction. The cloud emission also drops off fast in the southwest, but an observation with chop throw as well as previous HCO+ 1–0 and C18O 2–1 data suggest that this morphology is real. In all cases, the drop off of emission beyond is due to the chop throw; this only affects the emission near the edges of the images, but not on smaller scales, as confirmed from an observation of L1527 IRS with a throw.
After calibration, pointing correction, and sky noise subtraction of each scan, the 850 m images were coadded to determine the best-fit positions of the submillimeter source in each field (Table 1). We then repeated the coadding, now including proper weighting with the noise levels and aligning each scan to the best-fit 850 m position. We used the 850 m position to align the data from the 450 m array, which is slightly offset from the long-wavelength array. This shift and add procedure ensures that the final images are as sharp as possible. The SCUBA positions agree to within of available aperture-synthesis values for L1489 IRS and L1527 IRS (Rodríguez et al., 1989; Hogerheijde et al., 1997). The latter work only marginally detected L1535 IRS and TMC 1, and SCUBA significantly improves their known positions. For TMC 1 we find offsets of from the position given there, which should be accurate to within . The observations of L1535 IRS suffer from unusually large, systematic pointing drifts, but an offset of is obtained with an uncertainty of in right ascension and in declination estimated from map to map scatter.
The images were further analyzed with the MIRIAD software package (Sault, Teuben, & Wright, 1995). Because of the shape of the JCMT’s primary reflector, deviations of its beam from a single Gaussian are an important factor in the analysis. At short wavelengths, for example, equal power lies within the FWHM main beam as in a much broader error beam. Unfortunately, the lack of observable planets during most of our observations precluded the contemporaneous measurement of the beam profile. We have used observations of Uranus from 1997 September to construct an ad-hoc model of the beam. Fitting the azimuthally averaged Uranus data, we find a satisfactory description of the beam profile by three Gaussians with relative amplitudes and FWHM as listed in Table 2. The dimension of the largest beam component is partially determined by the size of the chop throw, and thus reflects the beam pattern set by the JCMT dish and the observing mode. This description of the beam is used in the analysis below.
3 The submillimeter-continuum images
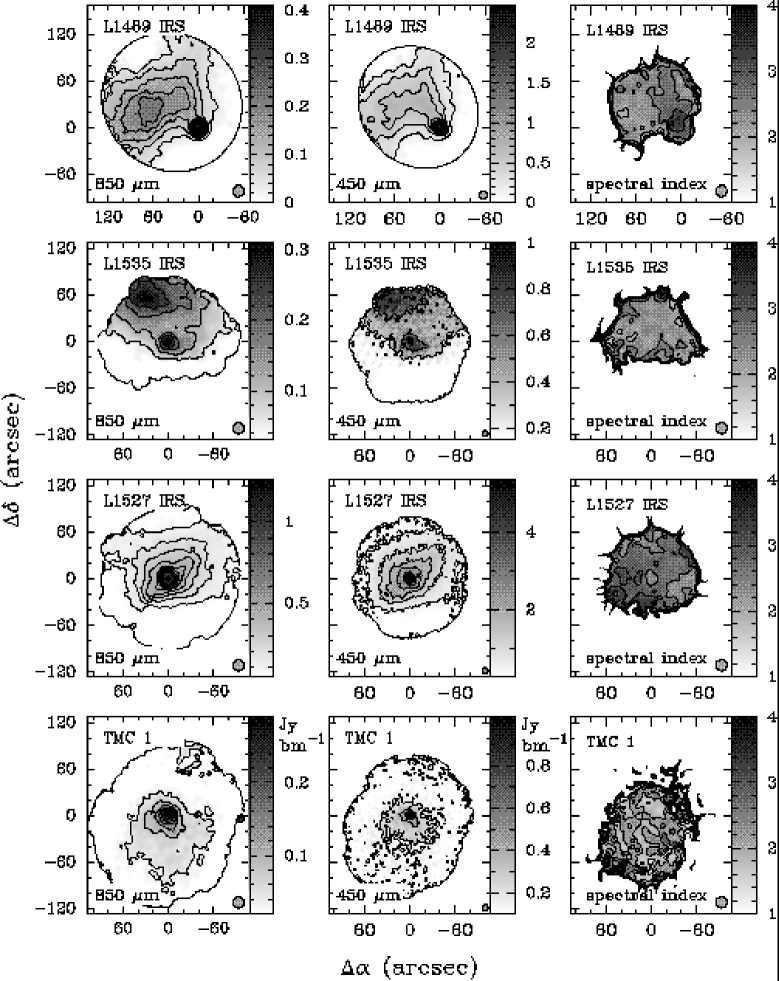
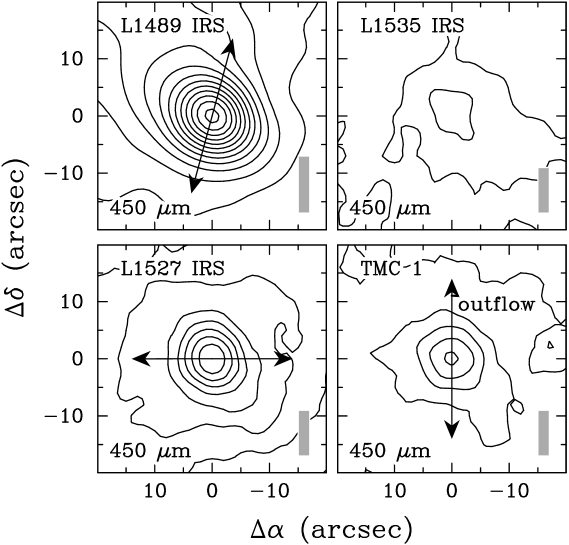
The 850 and 450 m images show emission peaks at the position of the young stars, surrounded by extended emission filling almost the entire fields of view (Fig. Testing envelope models of young stellar objects with submillimeter continuum and molecular-line observations). Second emission peaks are visible northeast of L1489 IRS and north of L1535 IRS. Table 3 lists the total flux contained in the images, and results of a Gaussian fit to the central emission peaks. These fits reflect the smallest sized Gaussians which can describe the emission peaks, while treating the extended emission as an unrelated background (see §5.3). The fluxes and morphologies are consistent with previously published results (Ladd et al., 1991b; Moriarty-Schieven et al., 1994; Chandler, Barsony, & Moore, 1998; Chandler & Richer, 1999). A blow-up of the around the objects at 450 m (Fig. Testing envelope models of young stellar objects with submillimeter continuum and molecular-line observations) show elongated cores oriented roughly perpendicular to the known outflow directions. The fit results of Table 3 yield aspects ratios between 3:2 and 2:1 for the central regions of L1489 IRS, L1527 IRS, and TMC 1 after deconvolution of the beam size. The morphology of L1535 IRS’s emission peak is not well defined and a correspondingly larger size of is found. Its outflow direction is also poorly known. The position angle of quoted by Hogerheijde et al. (1998) was based on scattered 2 m emission interpreted as an outflow cavity, where in fact it is light scattered off the second submillimeter core north of L1535 IRS (see §5.4). The elongated core of L1489 IRS and the irregular structure of L1535 IRS’s emission peak closely resemble aperture-synthesis maps of HCO+ and 13CO =1–0 (Hogerheijde et al., 1998).
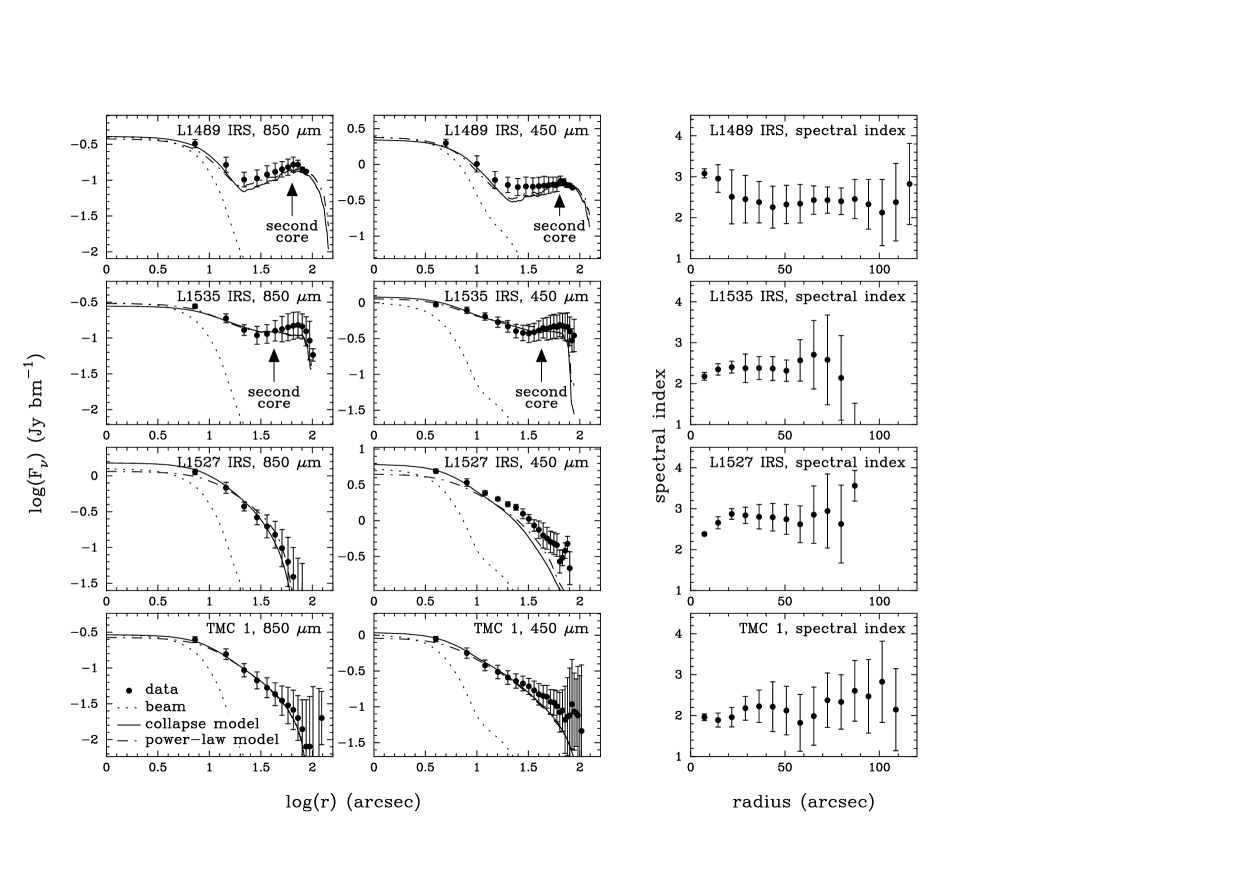
When plotted on a log-log scale in Fig. Testing envelope models of young stellar objects with submillimeter continuum and molecular-line observations, which better brings out the extended emission, the azimuthally averaged, radial emission profiles of the sources indicate that the extended emission follows a radial power law, corresponding to a straight line in the figure. For L1527 IRS only the radial profile perpendicular to the east-west outflow is shown. L1489 IRS appears much more compact than the other sources, a result which does not depend on the likely artificial drop in emission at the northeast edge of the images (§2). In addition to emission directly associated with the YSOs, L1489 IRS and L1535 IRS show second emission peaks at and , respectively, or AU from the YSOs. While L1489 IRS’s observations were recentered to cover the emission of this second core, the peak adjacent to L1535 IRS is located near the edge of the images. Since it dominates the emission over the entire field of view, it severely hampers the analysis of the L1535 IRS data. The emission around L1527 IRS is elongated along the east-west outflow, perpendicular to the orientation of its central peak. The outflows of the other sources, which have kinetic luminosities smaller by factors of 3–100 (Hogerheijde et al., 1998), do not leave a detectable imprint on the dust emission.
The quality of the SCUBA observations is sufficient to derive the spectral index between 850 and 450 m (Figs. Testing envelope models of young stellar objects with submillimeter continuum and molecular-line observations and Testing envelope models of young stellar objects with submillimeter continuum and molecular-line observations). To obtain images of , we deconvolved the 850 and 450 m images with the appropriate beam profiles, convolved them with a single Gaussian to the same resolution of 145, and calculated . The resulting values of range between 1.8 and 3.5. The largest values are found toward the position of L1489 IRS and along the outflow cavity of L1527 IRS; the lowest values around TMC 1. A proper description of the beam profile is crucial when deriving the spectral index: using a single Gaussian for the beam lowers by 0.5 on average and significantly changes its spatial distribution.
In the submillimeter range, the overall spectral index reflects the emission-averaged values of the dust temperature, the opacity, and the spectral index of the dust emissivity . Assuming fully optically thin emission and 1.5–2.0 (as expected for dust in dense clouds, Goldsmith, Bergin, & Lis, 1997; Ossenkopf & Henning, 1994), the observed directly translates to dust temperatures of 10–15 K for the extended material and K for the material near L1489 IRS and along the outflow of L1527 IRS; lower values of , corresponding to grain growth (Ossenkopf & Henning, 1994; Pollack et al., 1994), give higher temperatures. At the position of L1527 IRS, the spectral index shows a local minimum of . The next section will show that rather than a lower temperature, a decreased in the central region or a significant contribution from optically thick emission from an unresolved circumstellar disk are more likely explanations. The extended emission peaks northeast of L1489 IRS and north of L1535 IRS do not show up as extrema in , indicating that they correspond to enhancements in column density rather than temperature. In the following, we will refer to these condensations as L1489 NE-SMM and L1535 N-SMM.
4 Modeling the structure of the YSO envelopes
4.1 Power-law density models
The emission profiles of Fig. Testing envelope models of young stellar objects with submillimeter continuum and molecular-line observations show that the emission of the extended emission follows a radial power law. The inside-out collapse model predicts a power-law distribution for the density with negative index between 1 and 2, where the exact shape is given by the location of the collapse expansion wave . In this section we investigate which single value of the power-law index best fits the overall emission around the sources; the next section will focus on the inside-out collapse model. Since these model results are mostly constrained by the extended emission, no additional unresolved sources like circumstellar disks are included (but see Chandler & Richer, 1999, for a discussion of the effect of the presence of an unresolved central source on derived model parameters). These models are spherically symmetric; at the end of this section (§5.3) we will look at the properties of the central elongated emission peaks, and how they differ from those inferred for the envelope as a whole.
For the power-law model we adopt a density distribution , where is the density at an arbitrary radius of 1000 AU. Instead of density we will use the H2 number density as a parameter, assuming a ‘standard’ gas-to-dust ratio of 100:1. The inner radius of the envelope is set at 50 AU, which does not influence the results, while the outer radius is initially set at 8000 AU. Following Adams & Shu (1985), we assume the dust temperature to follow a radial power law with index 0.4, K. Such a distribution is expected for a spherical cloud with an embedded heating source and which is optically thin to the bulk of the heating radiation. The dust temperature depends on the luminosity of the central source as described by Adams & Shu (1985). For our sources, K (L1489 IRS: 3.7 ) and 24 K (L1535 IRS and TMC 1: 0.7 ). These temperature distributions reproduce the observed SEDs at millimeter and infrared wavelengths for the envelope parameters derived below (e.g., Ladd et al., 1991a; Kenyon, Calvet, & Hertmann, 1993a). For L1527 IRS, the above expression yields K, which significantly overestimates the IRAS fluxes at 100 and 60 m. For the parameters derived below, the opacity of its envelope is around unity at these wavelengths, and it is possible that a flattened rather than spherical geometry of its edge-on envelope could increase the opacity by a factor of a few and hence reconcile the fluxes. However, for our modeling we choose to lower the temperature of L1527 IRS’s envelope to K, in which case the 100 and 60 m are reproduced.
The power-law index of of our adopted temperature profile () is strictly true only for . Chandler & Richer (1999) give an alternative description of , where . For realistic values of of 1–2, this translates to –0.4. Heating by the external radiation field may be an other factor influencing the temperature profile (e.g., see Choi et al., 1995). Since the Rayleigh-Jeans limit of the Planck function is not valid in the submillimeter range, the emission – and the inferred model parameters – depend sensitively on the temperature distribution. Provided that the choice for the adopted temperature distribution is reasonable, the conclusions that a certain model does or does not fit the data is more robust that the exact value of the inferred model parameters. Since it is the main aim of this paper to investigate models for YSO envelopes, rather than derive accurate constraints on their parameters, we deem our simple description of the temperature distribution sufficient, but urge the reader to keep in mind that the values of the inferred parameters are valid only within the framework of our model assumptions.
Realistic models for the dust emissivity at submillimeter wavelengths, including grain growth, are available (Ossenkopf & Henning, 1994; Pollack et al., 1994), but for the sake of simplicity we parameterize the dust emissivity as , with Hz and cm2 g-1 (gas and dust, with a gas:dust ratio of 100:1; see Hildebrand 1983). Typical values for range between 1 and 2, although much lower values of have been found in T Tauri disks (Beckwith & Sargent, 1991). The absolute values for lie within a factor of 2–3 from those of the more elaborate models, a difference which only influences the inferred mass, not the density power law index.
The free parameters of this model are the density at 1000 AU , the density power-law index , and the dust spectral index . These correspond to the observed total flux, radial emission profile, and ratio of 450 to 850 micron emission, respectively. For each combination of we calculate the emission from the envelope model over the imaged region by following the radiative transfer along a large number of lines of sight through the source using the Planck function. The resulting intensity distribution is then convolved with the appropriate beam pattern, and a measure is determined of the difference between the model and the data at both wavelength bands together over a ( AU) region around the source. Minimization of the , where is the intensity in Jy beam-1, the noise, and the summation is over all pixels within the region and both wavelength bands, yields best-fit values of , , and listed in Table 4. The indicated uncertainties in the best-fit values include the effects of signal-to-noise, the shape of the surface, and an estimated 20% calibration uncertainty in the 850 and 450 m data. The reduced values of these fits are 1.5 for L1489 IRS, 0.8 for L1535 IRS, 2.7 for L1527 IRS, and 0.7 for TMC 1.
The model fit requires assumptions about the contribution of L1489 NE-SMM and L1535 N-SMM to the emission; the emission along L1527 IRS’s outflow does not contribute significantly within the fitting region. We assume a Gaussian emission distribution centered on the former cores with adjustable flux at 850 m, spectral index, and major and minor axes. This increases the number of free parameters from three to seven. Because the measure is still limited to around the YSOs, the best-fit values for the latter four parameters are not representative for the L1489 NE-SMM and L1535 N-SMM cores as a whole but only describe the ‘background’ emission around the source due to the secondary cores (see §5.4).
The observations are well fit by the power-law model (Fig. Testing envelope models of young stellar objects with submillimeter continuum and molecular-line observations), if the outer radius is decreased to 2000 AU for L1489 IRS and increased to 12,000 AU for TMC 1. This is required to fit the compact size of L1489 IRS and the emission out to the edge of TMC 1’s images. The radii of 8000 and 12,000 AU reflect the imaged regions, not necessarily the true extent of the sources. The derived values of , , and are constrained by the central regions of the envelopes and do not depend critically on ; only for L1489 IRS would increase from 2.1 to 2.5 if AU were used. L1527 IRS is well fit with AU, while the dominance of L1535 N-SMM precludes strong constraints on the size of L1535 IRS itself. For our sources, the inferred power-law indices range between 0.9 for L1527 IRS and 2.1 for L1489 IRS, and envelope masses are 0.016–3.7 . For L1527 IRS Chandler & Richer (1999) infer an equally low index of 1.0–1.2 from similar SCUBA data. For TMC 1 our inferred value of is marginally consistent with the result of SED fitting by Chandler, Barsony, & Moore (1998) of . The difference is possibly due to the much smaller outer radius of 2500 AU adopted by these authors corresponding to their smaller imaged regions. The inferred values for the spectral index of the dust emissivity are 1.5–2.0, excluding the uncertain values for L1535 IRS, as expected for material in dense molecular clouds which underwent some grain growth (, Ossenkopf & Henning, 1994; Pollack et al., 1994).
4.2 The inside-out collapse model
The data are well described by a radial power-law distribution with –2. This lies in the range of indices predicted by the inside-out collapse model. Can this collapse model, which has a slope varying with radius, also describe the data? In this section we fit the inside-out collapse model of Shu (1977) to the data, where we parameterize the model in and the location of the collapse expansion wave, . This parameterization offers a good match to the directly observed quantities peak flux () and shape of the emission distribution (). The other model parameters (temperature, inner and outer radius, dust emissivity) are the same as in the previous section. We again adopt a Gaussian model for L1489 NE-SMM and L1535 N-SMM, without which no satisfactory model fit can be found, which increases the number of free parameters for these objects from three to seven. Best-fit parameters follow from minimization over regions around the YSOs (Table 5), yielding reduced values of 1.5 for L1489 IRS, 0.7 for L1535 IRS, 3.0 for L1527 IRS, and 0.8 for TMC 1. The table does not list the parameters of the Gaussian model for L1489 SE-SMM and L1535 N-SMM, which are essentially similar to those found in §4.1 and listed in Table 4.
The inside-out collapse model does not predict a density distribution characterized by a single power-law index throughout the envelope. However, the beam sizes of – (1000–2000 AU) are sufficiently large compared to the envelopes, that the resulting distribution of the emission after beam convolution is not far off from a single power law. The observations can therefore be equally well fit with the inside-out collapse model as with single power laws, as witnessed by the very similar reduced values and model curves in Fig. Testing envelope models of young stellar objects with submillimeter continuum and molecular-line observations. The inferred masses and spectral indices of the dust emissivity are close to those found from the power-law fitting; only those of L1535 IRS differ somewhat, probably because of the larger uncertainty in its derived parameters due to the dominance of L1535 N-SMM.
For L1527 IRS and TMC 1 sound speeds and ages are inferred of 0.44 and 0.19 km s-1, and and yr, respectively. Again, an outer radius of 12,000 AU is used for TMC 1, which does not influence the values of or . For L1535 IRS more uncertain values of 0.29 km s-1 and yr are found. L1489 IRS can only be fit satisfactory for an outer radius of 2000 AU, because larger radii require a density fall-off which is too steep for the model (, §4.1). For AU, we find a high sound speed of 0.46 km s-1 and large age of yr. This corresponds to a location for the collapse expansion wave of AU, much larger than . For the other sources, is slightly smaller than , and L1489 IRS’s value suggests that a different model may be required for this source.
4.3 Probing the velocity field with molecular lines
The previous two sections have shown that the continuum observations are well fit by a density distribution following a radial power-law of index –2. Many collapse model predict distributions with slopes in this range, and the inside-out collapse model of Shu (1977) is therefore found to satisfactorily represent the data. However, a collapse model implies infalling motions. Several authors have used molecular-line observations to derive – very similar – model parameters for our sources (Zhou, Evans, & Wang, 1996; Hogerheijde, 1998). The results obtained by Hogerheijde (1998), listed in Table Testing envelope models of young stellar objects with submillimeter continuum and molecular-line observations, closely agree for TMC 1 with those inferred above from the continuum observations, but not in the case of the other sources. For L1527 IRS the value for is similar, but its sound speed is lower and its age is correspondingly larger by a factor of two. Even larger differences are found for L1489 IRS and L1535 IRS. Rather than comparing inferred model parameters, which may suffer from systematic effects because of different model assumptions, a more direct test is to look at the line profiles predicted by the inside-out collapse model and the best-fit parameters of Table 5. How well are the observed spectra reproduced by the profiles calculated using these parameters derived directly from the SCUBA continuum observations?
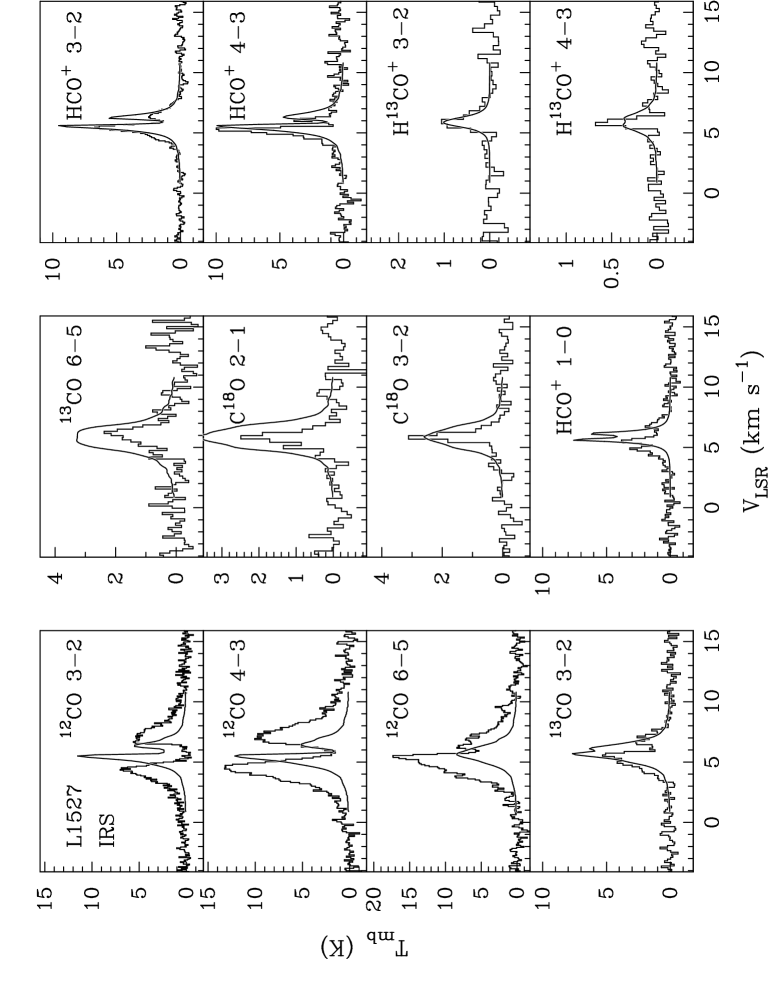
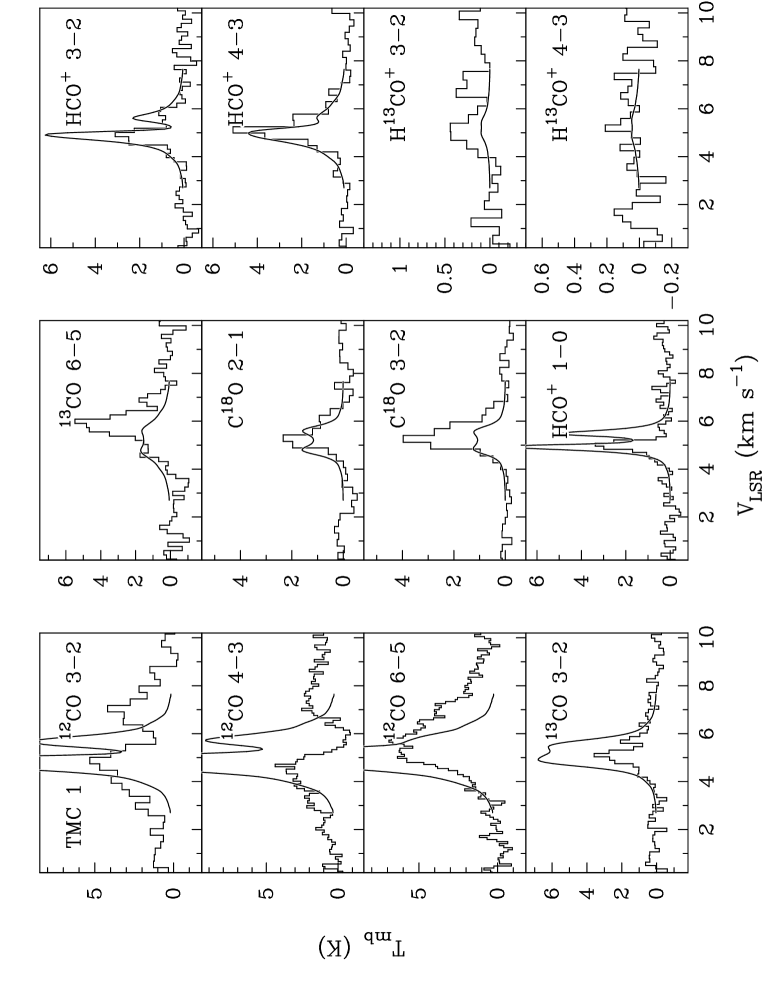
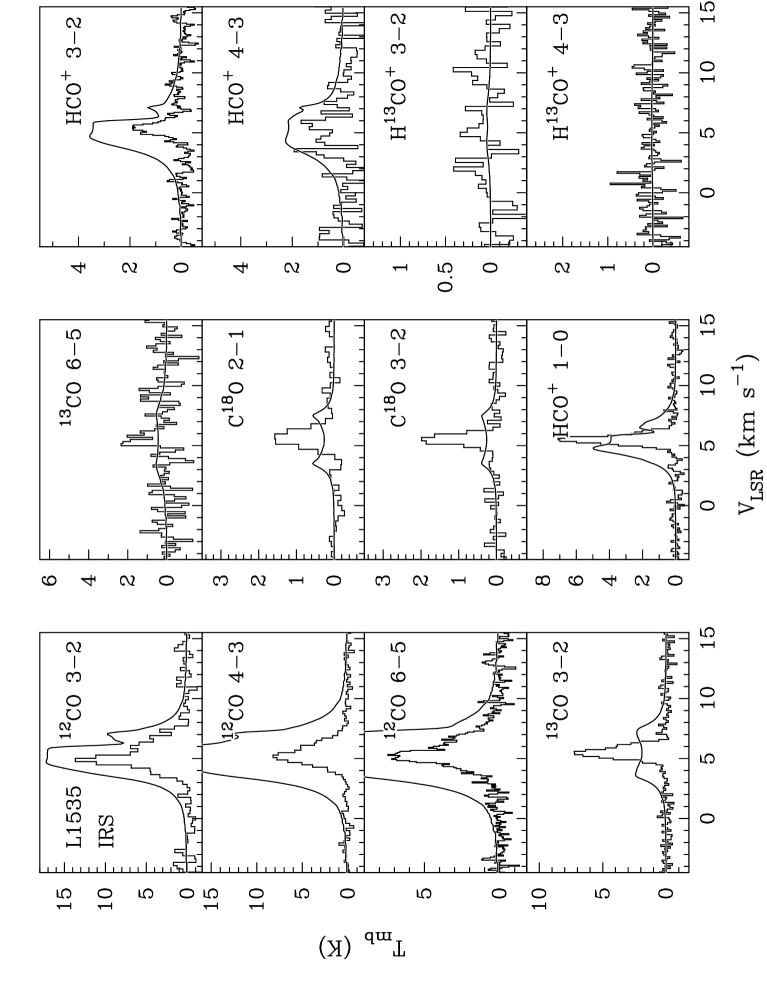
Using single-dish observations of 12CO, 13CO, C18O, HCO+ and H13CO (previously presented by Hogerheijde et al. 1997, 1998, and shown in Fig. Testing envelope models of young stellar objects with submillimeter continuum and molecular-line observations), we calculate line profiles based on the same parameters as derived from the continuum emission (Table 5). The modeling of the molecular excitation and line radiative transfer employs a spherically-symmetric Monte-Carlo method developed by Hogerheijde & van der Tak (1999). The envelopes are divided into 32 concentric shells, sufficient to follow the excitation and optical depth. The maximum optical depth encountered in the model is , and 32 shells ensure that all shells are optically thin. A calculation with 64 shells confirmed that the results are independent of the adopted gridding. We adopt a ‘standard’ CO abundance of with respect to H2, and isotopic ratios of 12C:13C of 65:1 and 16O:18O of 500:1 (Wilson & Rood, 1994). The optically thin H13CO+ lines constrain the HCO+ abundance to for L1527 IRS, for L1489 IRS, for TMC 1, and for L1535 IRS. Initially, we assume that the kinetic temperature is equal to the dust temperature throughout the envelope. The adopted local turbulent line width of 0.2 km s-1, independent of radius, is similar to that found in dark cloud cores (Fuller & Myers, 1992; Myers & Fuller, 1992); since the systematic (infall) motions of the model dominate the overall velocity field, the calculated profiles are independent to changes in the turbulent width of factors of a few. After the level populations have converged, the sky brightness distribution is calculated and convolved with the appropriate beams.
With these parameters, the modeled line profiles are wider and more intense than observed. However, for L1527 IRS and TMC 1 much better agreement between the models and the observations if found (Fig. Testing envelope models of young stellar objects with submillimeter continuum and molecular-line observations) when CO is depleted by a factor of 30 in regions with K (the sublimation temperature of CO, Sandford & Allamandola, 1990). In the cold and dense envelopes around YSOs, freezing out of CO on dust grains is responsible for observed depletions by factors of 10–20 (e.g., Blake et al., 1995; Mundy & McMullin, 1997; Kramer et al., 1999). Obvious exceptions where the models do not reproduce the 12CO observations are self-absorption due to low-density foreground material and contributions from the outflows to the line wings. The HCO+ line profiles are particularly well fit, supporting the conclusion of Hogerheijde et al. (1997) that this species is an excellent tracer of YSO envelopes. The calculations do not include any depletion for HCO+, but use the abundance which is directly constrained from the H13CO+ data.
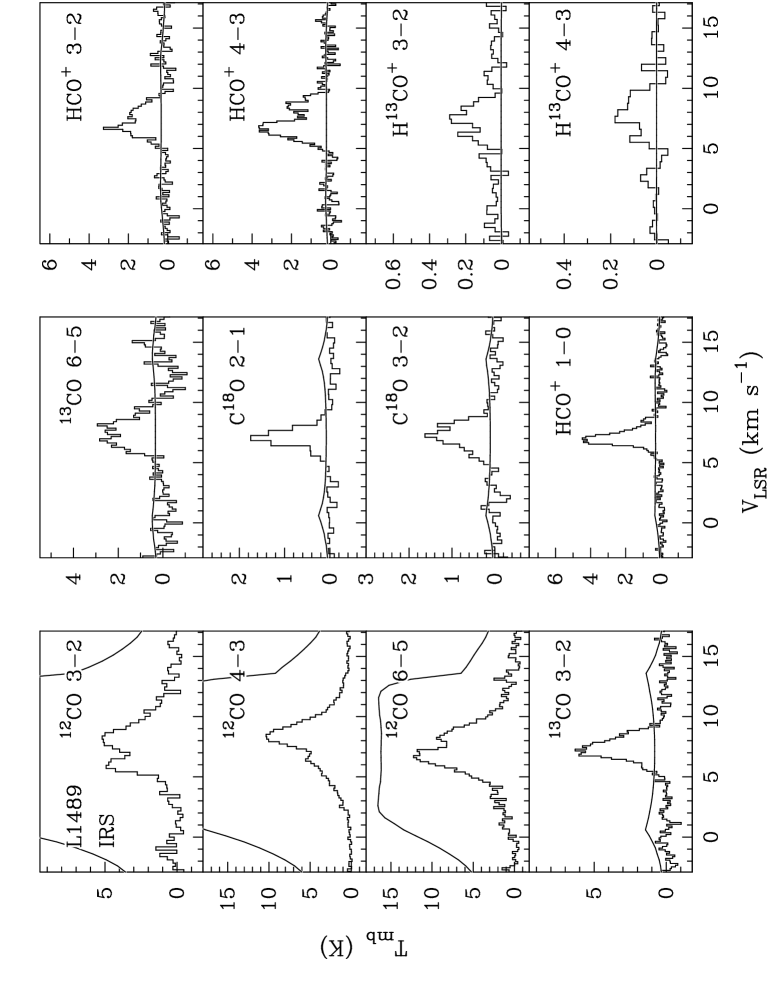
For L1535 IRS the predicted 12CO and HCO+ lines are still slightly wider than observed, even with CO depletion. The model predicts much lower intensities for the optically thin lines of 13CO and C18O than observed. This suggests that these lines primarily trace the low density gas associated with L1535 N-SMM. Since the mismatch in 12CO and HCO+ is most likely due to the uncertain nature of the derived parameters because of L1535 IRS’s weak continuum emission, trying to obtain a closer fit is probably not a very useful exercise. For L1489 IRS, the line profiles predicted by the model calculations do not agree at all with the observations, showing much larger widths (10–15 km s-1 vs. km s-1). Apparently, its compact size and steep density fall-off are not well described by the inside-out collapse model (see §5.2).
To answer the question posed at the beginning of this section: yes, the inside-out collapse model can reproduce the observed line profiles. And where it fails, it confirms earlier suspicions that the inside-out collapse model is not a good description for L1489 IRS.
5 Discussion
5.1 Critical tests of collapse models
Section 4.2 showed that the inside-out collapse model can successfully describe the density and the velocity structure of the extended envelopes around our YSOs. Perhaps the most direct indication that the line and continuum data are tracing the same collapse model, is given by the HCO+ line widths toward L1527 IRS and TMC 1. The continuum data suggest a factor of two difference in sound speed, which is, as the inside-out model predicts, reflected in the factor of two difference in line widths seen toward the sources (Fig. Testing envelope models of young stellar objects with submillimeter continuum and molecular-line observations; note the different respective horizontal scales). Our modeling clearly illustrates that a full test of a collapse model requires independent measurements of the density and the velocity structure. We have used submillimeter continuum and line observations to obtain this goal. A judicially chosen set of molecules and lines will work as well, if some of these lines are readily thermalized and their excitation no longer depend on the density.
Combining continuum and line data, as well as combining lines from different molecules, introduces some level of uncertainty, however. In our case, it arises from uncertainties in the dust emissivity, the CO depletion, and possibly the gas-to-dust ratio. For a molecular line set it is reflected in the abundances of the different species. In general, it comes down to the question of how the fluxes in different tracers are scaled to one another. Hence, it is easier to test whether a certain collapse model can fit the data than to accurately constrain its parameters. In §4.2 we confirmed that the envelopes of L1527 IRS and TMC 1 are well described by the infall model, but the derived values for the sound speed and the age are valid only for the adopted values for the dust emissivity and the dust temperature distribution. For example, different values are quoted in §4.3 derived from directly fitting line profiles, a process which comes with its own set of model assumptions (kinetic temperature, abundance, etc.).
Clearly, this situation can be much improved if the temperature distribution of the dust and of the gas is constrained by observations. Self-consistent modeling of the continuum radiative transfer and the heating and cooling balance of the dust and the gas will be an important step, as will be observations of spatially resolved SEDs (e.g., from SOFIA) and sensitive tracers of the gas kinetic temperature (e.g., H2CO, Mangum & Wootten 1993). With these tools, we can hope to go beyond the simple inside-out collapse model of Shu (1977) and investigate more realistic, but more complex, collapse models.
5.2 A different model for L1489 IRS
For L1489 IRS the inside-out model spectacularly fails to simultaneously fit the continuum and line data, although both data sets can be fit separately (see §4.2 and Hogerheijde 1998). Together with other pieces of evidence, this leads us to suggest that L1489 IRS is not embedded in a collapsing envelope, but is instead surrounded by a 2000 AU radius, rotating, thick disk-like structure. First, Fig. Testing envelope models of young stellar objects with submillimeter continuum and molecular-line observations indicates a much more compact size of AU in radius compared to the other sources. Second, interferometric observations of HCO+ and 13CO 1–0 directly reveal a rotating structure of this size, coincident in orientation with the position angle of Table 3 (Hogerheijde et al., 1998). Third, its comparatively bright near-infrared SED appears intermediate between that of embedded objects and T Tauri stars (Ladd et al., 1991a). In such a disk-like structure, one still expects power-law distributions for the density and the velocity (Keplerian rotation), but a different distribution of mass with velocity. Therefore, the power-laws of the inside-out collapse model can still fit the density and the velocity individually but not simultaneously. Our data do not constrain the vertical structure of this disk-like structure, since it is almost unresolved along its minor axis.
Could L1489 IRS be a transitional object between the fully embedded Class I and the optically revealed T Tauri phases, with its extended envelope collapsed into a 2000 AU radius disk-like structure? Its inclination has been constrained to near edge-on (–; Kenyon et al. 1993b), and a thick disk-like structure may explain its bright near-infrared but visually obscured nature (see also Padgett et al., 1999, for HST/NICMOS observations of this same structure). This situation is reminiscent in some ways of T Tau, where a Class II star (T Tau N) also has many of the characteristics of a Class I object because of the large amount of circumstellar material – in fact, T Tau consists of a Class II object T Tau N and a more embedded, Class I companion, T Tau S (Dyck, Simon, & Zuckerman, 1982). That T Tau N is classified as an optically visible Class II object may be largely due to its favorable face-on orientation with respect to the observer (Herbst, Robberto, & Beckwith, 1997), possibly exactly opposite from the Class I classification of the more edge-on L1489 IRS. Other objects which come to mind in this context are HL Tau (see, e.g., Stapelfeldt et al., 1995), which also has a steep density distribution in its envelope (Chandler & Richer, 1999).
An important difference with T Tau, and with many younger Class I objects, is that no (100 AU radius) centrifugal disk of significant mass appears to surround L1489 IRS. It is only marginally detected in 3 mm aperture-synthesis observations which selectively trace such disks (see Terebey, Chandler, & André, 1993). It seems unlikely that L1489 IRS is a low-mass system, and hence may have an intrinsically low-mass disk, because of its comparatively large luminosity of 3.7 . Possibly, L1489 IRS is a close binary, inhibiting the formation of a circumstellar accretion disk (Jensen, Mathieu, & Fuller, 1996). Padgett et al. (1999) only detect a single point source, but with 015 resolution, binaries with separations less than 20 AU are still unresolved.
One possibility is that we observe L1489 IRS at the moment where it is making its transition from an embedded object to a T Tauri star, as appears to be the case for HL Tau. Rotating disks around T Tauri stars have typical radii of 500–1000 AU radius in line emission (Handa et al., 1995; Mannings & Sargent, 1997; Dutrey et al., 1998; Guilloteau & Dutrey, 1998), but appear more compact ( AU) when observed in continuum due to differences in line and continuum emissivities. No sensitive SCUBA images of the dust continuum around such T Tauri stars have been published, however, which may show more extended low-level structures, and which offer a better comparison to the observations of L1489 IRS. At a contraction velocity of only 0.5 km s-1, it will take L1489 IRS’s disk-like structure yr to contract to 500 AU. This is short compared to the yr typically required to disperse the envelope, and only a detailed analysis of its velocity structure will allow its detection in the presence of the much larger (2–3 km s-1) rotation velocities.
Another possibility which such an analysis might confirm, is that L1489 IRS’s disk-like structure is not contracting but is fully rotationally supported. If its central object is indeed a close binary which has inhibited the formation of an accretion disk, this system may find itself without an efficient means to carry away excess angular momentum. Bipolar outflows driven by disk accretion are generally thought to play an important role in this process (e.g. Shu et al., 1993). L1489 IRS’s outflow as detected in CO 3–2 is very weak indeed (Hogerheijde et al., 1998). A binary companion may have cleared a gap in the accretion disk, shutting off or greatly decreasing the inward flow of material. Ascertaining whether L1489 IRS is, as this would suggest, a young analog to the GG Tau ‘ring’ system (Guilloteau, Dutrey, & Simon, 1999) will require additional observations in the near- and mid-infrared characterizing this object’s multiplicity and accretion state, as well as aperture-synthesis in molecular lines to probe the velocities in the disk-like structure.
5.3 The inner regions of the envelopes
Section 4 only considered models which describe the emission over the entire envelope in a spherically symmetric geometry, and neglected any radial changes in dust properties or source geometry. This section adopts a different view of the data, fitting two Gaussians to the data, one describing the emission from the central region and one from the extended emission. By minimizing the size of the first component, we maximize the difference between the emission from the central region and the extended emission, and thus the difference with the models explored in the previous two sections. This description of the intensity distribution only refers to the central around the objects. Since the emission follows a radial power law (§4, a series of Gaussians would be required to fit the entire images. By limiting ourselves to the inner , two Gaussians suffice. We do not claim that these Gaussian carry physical significance beyond being a description of the emission profiles and allowing for an investigation of the dust properties on small scales.
Table 3 lists the (deconvolved) major and minor axes and position angles of the central Gaussian components; the listed components fit the radial emission profiles in the inner as well as the single power laws of §4.1. We consider a simple isothermal model for the central regions, with an effective temperature estimated from the infrared SED. Warm material near the star dominates the emission at 100 m and shorter, yielding a characteristic temperature for the inner regions of the envelope. This is essentially an effective temperature: it describes the characteristics of the emission, not the physical temperature of the bulk of the material. Using an effective temperature, allows us to link the observed intensity in both wavelength bands through a spectral index of the dust emissivity. The free parameters of this model are the effective temperature, the source diameter, and the spectral index of the dust emissivity, again parameterized as cm2 g-1 (gas+dust, with gas:dust=100). We assume that the emission is optically thin (but see below).
The 850 and 450 m fluxes and sizes of the central peaks and the infrared SED from Kenyon, Calvet, & Hertmann (1993a) yields best-fit results as listed in Table 7. The obtained diameters are or 1000 AU, slightly larger than the typical value for disks around T Tauri stars as seen in molecular lines (Handa et al., 1995; Mannings & Sargent, 1997; Dutrey et al., 1998; Guilloteau & Dutrey, 1998). The spectral index of the dust emissivity is 0.9–1.1, with an estimated uncertainty of 0.2. Toward L1527 IRS the low is directly reflected in the spectral index maps of Fig. Testing envelope models of young stellar objects with submillimeter continuum and molecular-line observations; toward the other sources increased temperature partially compensates for the lower . These values of the dust emissivity’s spectral index are significantly smaller than the 1.5–1.9 representative of the entire envelope (Tables 4 and 5), and indicate that grain growth may take place on small scales.
Alternatively, the low spectral index indicates a significant contribution to the emission from optically thick material. The envelope models as derived in the previous sections are optically thin at 850 and 450 m, even at small radii, and significant flattening is required to increase the opacity without changing the flux. Part of the central flux could also originate in an unresolved, optically thick circumstellar disk. Previous 3 mm interferometer observations (Terebey, Chandler, & André, 1993; Ohashi et al., 1996; Hogerheijde et al., 1997) and limits inferred by Chandler & Richer (1999) suggest, however, that no more than 10–20% of the flux at 850 and 450 m can be attributed to an unresolved point source. We therefore conclude that the observed decrease in spectral index on small scales is likely caused by a change in dust properties, but cannot rule out a significant contribution from optically thick material if the inner regions of the envelope are highly flattened.
5.4 The nature of L1489 NE-SMM and L1535 N-SMM
The presence of L1489 NE-SMM and L1535 N-SMM within 10,000 AU of the YSOs L1489 IRS and L1535 IRS, respectively, shows that star formation in truly isolated cores is rare even in Taurus. These cores are not chance alignments but are physically close to the YSOs. Moderately dense ( cm-3) gas traced by HCO+ 1–0 shows emission from these cores near the systemic velocities of the YSOs (Hogerheijde et al., 1997), and L1535 N-SMM is visible in scattered near-infrared emission in observations by Hodapp (1994). Their presence was already noted by Ladd et al. (1991b), who show that they coincide with NH3 cores detected by Benson & Myers (1989) and Ungerechts, Winnewisser, & Walmsley (1982).
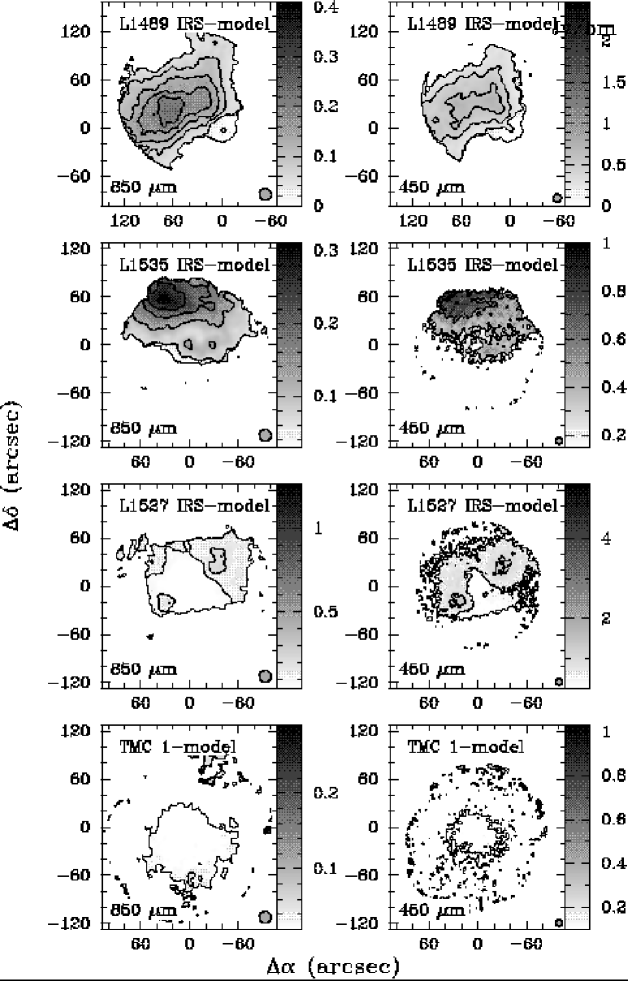
The nature of these cores is best investigated through the residual images after subtracting the YSO models (Fig. Testing envelope models of young stellar objects with submillimeter continuum and molecular-line observations). Because the power-law model and the inside-out collapse model provide equally well fits to the continuum data, only the residuals of the latter are shown. Figure Testing envelope models of young stellar objects with submillimeter continuum and molecular-line observations presents the radial flux density profiles around the centers of these cores. Contrary to the emission distribution of the YSOs, those of L1489 NE-SMM and L1535 N-SMM are not characterized by a power-law, but more closely resemble a Gaussian of deconvolved FWHM and , respectively. It seems unlikely that this shape is caused by the assumption of a Gaussian distribution in the model fits, since these only applied to the immediately around the YSOs.
The spectral index of the emission from these cores is not significantly changed by the subtraction of the best fit YSO models, and indicates a dust temperature of 10–15 K, assuming a dust emissivity spectral index of –2. For such low temperatures, masses of 0.5–3.0 are found for both cores, significantly larger than the circumstellar masses of L1535 IRS and L1489 IRS, and close to the virial mass estimates assuming a velocity dispersion of 0.2–0.3 km s-1 and a density distribution given by . The low temperature throughout the cores, their large masses, and the lack of central concentration all suggest that these cores do not contain embedded sources. Further interferometric searches for embedded continuum sources and molecular line observations of possible infall signatures will shed more light on the nature of these cores.
Contrary to L1489 IRS and L1535 IRS, the fields of L1527 IRS and TMC 1 are dominated by the YSO’s themselves. We interpret the residual emission toward L1527 IRS as dust heated to K along the edge of the outflow. An upper limit to the mass of 0.2 is found, or 10% of the total inferred envelope mass. This is comparable to the total amount of swept up CO (0.2 ; Hogerheijde et al., 1998), and may be the same material. No residual emission is detected toward TMC 1, making it an ideal target for further studies of isolated star formation.
6 Conclusions
This paper presents high-quality submillimeter-continuum observations of four embedded YSOs in Taurus, analyzes them in terms of the popular collapse model of Shu (1977), and compares the results to molecular-line data. The main conclusions can be summarized as follows.
-
1.
The emission around the YSOs can be described by AU elongated central peaks, oriented perpendicular to the outflows, embedded in extended emission filling the fields of view. The density distribution in the extended envelopes is characterized by a radial power-law the with negative index –2, and outer radii between 2000 AU and 12,000 AU. The inferred envelope masses are 0.016–3.5 .
-
2.
Equally good fits can be found using the inside-out collapse model of Shu (1977), yielding sound speeds –0.46 km s-1 and ages between and yr.
-
3.
Only independent measurements of the density and the velocity structure can offer true tests of collapse models. Combined with previously obtained molecular line data, the SCUBA observations provide such a test. The combination of both data sets confirms that L1527 IRS, TMC 1, and probably L1535 IRS, are surrounded by collapsing envelopes which can be described by the inside-out collapse model.
-
4.
For one source, L1489 IRS, the inside-out collapse model spectacularly fails to fit the continuum and line data simultaneously. Instead, a better solution is offered by a rotating, disk-like structure of 2000 AU radius with a density distribution following a radial power-law. We suggest that this source may be in a transitional phase between a Class I and Class II object, and is possibly stunted in its evolution because of insufficient means to carry away excess angular momentum.
-
5.
Grain growth on small scales is evidenced by the decrease of the spectral index of the dust emissivity from 1.5–2.0 in the extended envelopes to in the central elongated cores, although high optical depth in the inner regions of the envelopes is also a possible explanation.
-
6.
Star formation in isolated cores is rare, even in Taurus, as is witnessed by the presence of two, apparently starless, cores within 10,000 AU of our YSOs. These cores are cold (10–15 K), lack central concentration in their density structure, but have sufficient mass to eventually form stars (0.5–3.0 ).
References
- Adams, Lada, & Shu (1987) Adams, F. C., Lada, C. J., & Shu, F. H. 1987, ApJ, 312, 788
- Adams & Shu (1985) Adams, F. C. & Shu, F. H. 1985, ApJ, 296, 655
- André, Ward-Thompson, & Barsony (1993) André, P., Ward-Thompson, D., & Barsony, M. 1993, ApJ, 406, 122
- André, Ward-Thompson, & Motte (1996) André, P., Ward-Thompson, D., & Motte, F. 1996, A&A, 314, 625
- Basu & Mouschovias (1994) Basu, S. & Mouschovias, T. C. 1994, ApJ, 432, 720
- Beckwith & Sargent (1991) Beckwith, S. V. W. & Sargent, A. I. 1991, ApJ, 381, 250
- Benson & Myers (1989) Benson, P. J. & Myers, P. C. 1989, ApJS, 71, 89
- Blake et al. (1995) Blake, G. A., Sandell, G., van Dishoeck, E. F., Groesbeck, T. D., Mundy, L. G., & Aspin, C. 1995, ApJ, 441, 689
- Chandler & Richer (1999) Chandler, C. & Richer, J. S. 1999, ApJ, in press
- Chandler, Barsony, & Moore (1998) Chandler, C. J., Barsony, M., & Moore, T. J. T. 1998, MNRAS, 299, 789
- Choi et al. (1995) Choi, M. H., Evans, N. J., Gregersen, E. M., & Wang, Y. S. 1995, ApJ, 448, 742
- Dutrey et al. (1998) Dutrey, A., Guilloteau, S., Prato, L., Simon, M., Duvert, G., Schuster, K., & Ménard, F. 1998, A&A, 338, L63
- Dyck, Simon, & Zuckerman (1982) Dyck, H. M., Simon, T., & Zuckerman, B. 1982, ApJ, 255, L103
- Foster & Chevalier (1993) Foster, P. N. & Chevalier, R. A. 1993, ApJ, 416, 303
- Fuller & Myers (1992) Fuller, G. A. & Myers, P. C. 1992, ApJ, 384, 523
- Galli et al. (1999) Galli, D., Lizano, S., Li, Z.-Y., Adams, F., & Shu, F. 1999, ApJ, 521, 630
- Galli & Shu (1993) Galli, D. & Shu, F. H. 1993, ApJ, 417, 220
- Goldsmith, Bergin, & Lis (1997) Goldsmith, P. F., Bergin, E. A., & Lis, D. C. 1997, ApJ, 491, 615
- Gregersen et al. (1997) Gregersen, E. M., Evans, N. J., Zhou, S., & Choi, M. 1997, ApJ, 484, 256
- Guilloteau & Dutrey (1998) Guilloteau, S. & Dutrey, A. 1998, A&A, 339, 467
- Guilloteau, Dutrey, & Simon (1999) Guilloteau, S., Dutrey, A., & Simon, M. 1999, A&A, 348, 570
- Handa et al. (1995) Handa, T., et al. 1995, ApJ, 449, 894
- Herbst, Robberto, & Beckwith (1997) Herbst, T. M., Robberto, M., & Beckwith, S. V. W. 1997, AJ, 114, 744
- Hildebrand (1983) Hildebrand, R. H. 1983, QJRAS, 24, 267
- Hodapp (1994) Hodapp, K.-W. 1994, ApJS, 94
- Hogerheijde (1998) Hogerheijde, M. R. 1998, Ph.D. thesis, Leiden University
- Hogerheijde & van der Tak (1999) Hogerheijde, M. R. & van der Tak, F. F. S. 1999, in preparation
- Hogerheijde et al. (1997) Hogerheijde, M. R., van Dishoeck, E. F., Blake, G. A., & van Langevelde, H. J. 1997, ApJ, 489, 293
- Hogerheijde et al. (1998) Hogerheijde, M. R., van Dishoeck, E. F., Blake, G. A., & van Langevelde, H. J. 1998, ApJ, 502, 315
- Hogerheijde et al. (1999) Hogerheijde, M. R., van Dishoeck, E. F., Salverda, J. M., & Blake, G. A. 1999, ApJ, 513, 350
- Holland et al. (1999) Holland, W. S., et al. 1999, MNRAS, 303, 659
- Jenness & Lightfoot (1997) Jenness, T. & Lightfoot, J. F. 1997, Starlink User Note 216, (see also the SURF homepage: http://www.jach.hawaii.edu/jcmt_sw/scuba/surf/)
- Jensen, Mathieu, & Fuller (1996) Jensen, E. L. N., Mathieu, R. D., & Fuller, G. A. 1996, ApJ, 458, 312
- Kenyon, Calvet, & Hertmann (1993a) Kenyon, S. J., Calvet, N., & Hartmann, L. 1993a, ApJ, 414, 676
- Kenyon et al. (1993b) Kenyon, S. J., Whitney, B. A., Gomez, M., & Hartmann, L. 1993b, ApJ, 414, 773
- Kramer et al. (1999) Kramer, C., Alves, J., Lada, C. J., Lada, E. A., Sievers, A., Ungerechts, H., & Walmsley, C. M. 1999, A&A, 342, 257
- Lada (1987) Lada, C. J. 1987, in Proc. IAU Symp. 115: Star-forming regions, ed. M. Peimbert & J. Jugaku (Dordrecht: Reidel), 1
- Lada & Kylafis (1999) Lada, C. J. & Kylafis, N. D. 1999, The Origin of Stars and Planetary Systems (Dordrecht: Kluwer Academic Publishers)
- Ladd et al. (1991a) Ladd, E. F., Adams, F. C., Casey, S., Davidson, J. A., Fuller, G. A., Harper, D. A., Myers, P. C., & Padman, R. 1991a, ApJ, 366, 203
- Ladd et al. (1991b) Ladd, E. F., Adams, F. C., Fuller, G. A., Myers, P. C., Casey, S., Davidson, J. A., Harper, D. A., & Padman, R. 1991b, ApJ, 382, 555
- Li & Shu (1996) Li, Z.-Y. & Shu, F. H. 1996, ApJ, 472, 211
- Li & Shu (1997) Li, Z.-Y. & Shu, F. H. 1997, ApJ, 475, 237
- Lizano & Shu (1989) Lizano, S. & Shu, F. H. 1989, ApJ, 342, 834
- Mangum & Wootten (1993) Mangum, J. G. & Wootten, A. 1993, ApJS, 89, 123
- Mannings, Boss, & Russell (2000) Mannings, V. G., Boss, A. P., & Russell, S. S. 2000, Protostars and Planets IV (Tucson: University of Arizona Press)
- Mannings & Sargent (1997) Mannings, V. G. & Sargent, A. I. 1997, ApJ, 490, 792
- Mardones et al. (1997) Mardones, D., Myers, P. C., Tafalla, M., Wilner, D. J., Bachiller, R., & Garay, G. 1997, ApJ, 489, 719
- McLaughlin & Pudritz (1997) McLaughlin, D. E. & Pudritz, R. E. 1997, ApJ, 476, 750
- Moriarty-Schieven et al. (1994) Moriarty-Schieven, G. H., Wannier, P. G., Keene, J., & Tamura, M. 1994, ApJ, 436, 800
- Motte, André, & Neri (1998) Motte, F., André, P., & Neri, R. 1998, A&A, 336, 150
- Mundy & McMullin (1997) Mundy, L. G. & McMullin, J. P. 1997, in Proc. IAU Symp. 178: Molecules in Astrophysics: Probes and Processes, ed. E. F. van Dishoeck (Dordrecht: Kluwer Academic Publishers), 183
- Myers & Fuller (1992) Myers, P. C. & Fuller, G. A. 1992, ApJ, 390, 181
- Ohashi et al. (1996) Ohashi, N., Hayashi, M., Kawabe, R., & Ishiguro, M. 1996, ApJ, 466, 317
- Ossenkopf & Henning (1994) Ossenkopf, V. & Henning, T. 1994, A&A, 291, 943
- Padgett et al. (1999) Padgett, D. L., Brandner, W., Stapelfeldt, K. R., Strom, S. E., Terebey, S., & Koerner, D. 1999, AJ, 117, 1490
- Pollack et al. (1994) Pollack, J. B., Hollenbach, D., Beckwith, S. V. W., Simonelli, D. P., Roush, T., & Fong, W. 1994, ApJ, 421, 615
- Rodríguez et al. (1989) Rodríguez, L. F., Myers, P. C., Cruz-González, I., & Terebey, S. 1989, ApJ, 347, 461
- Safier, McKee, & Stahler (1997) Safier, P. N., McKee, C. F., & Stahler, S. W. 1997, ApJ, 485, 660
- Saito et al. (1999) Saito, M., Sunada, K., Kawabe, R., Kitamura, Y., & Hirano, N. 1999, ApJ, 518, 334
- Sandford & Allamandola (1990) Sandford, S. A. & Allamandola, L. J. 1990, Icarus, 87, 188
- Sault, Teuben, & Wright (1995) Sault, R. J., Teuben, P. J., & Wright, M. C. H. 1995, in ASP Conf. Ser. 77: Astronomical Data Analysis Software and Systems IV, ed. R. A. Shaw, H. E. Payne, & J. J. E. Hayes (San Francisco: Astronomical Society of the Pacific), 433
- Shirley et al. (1998) Shirley, Y. L., Evans, N. J., Rawlings, J. M. C., & Gregersen, E. M. 1998, BAAS, 193, 7119
- Shu (1977) Shu, F. H. 1977, ApJ, 214, 488
- Shu et al. (1993) Shu, F. H., Najita, J., Galli, D., Ostriker, E., & Lizano, S. 1993, in Protostars and Planets III, ed. E. H. Levy & J. I. Lunine (Tucson: The University of Arizona Press), 3
- Stapelfeldt et al. (1995) Stapelfeldt, K. R., et al. 1995, ApJ, 449, 888
- Terebey, Chandler, & André (1993) Terebey, S., Chandler, C. J., & André, P. 1993, ApJ, 414, 759
- Terebey, Shu, & Cassen (1984) Terebey, S., Shu, F. H., & Cassen, P. 1984, ApJ, 286, 529
- Ungerechts, Winnewisser, & Walmsley (1982) Ungerechts, H., Winnewisser, G., & Walmsley, C. M. 1982, A&A, 111, 339
- Ward-Thompson et al. (1994) Ward-Thompson, D., Scott, P. F., Hills, R. E., & André, P. 1994, MNRAS, 268, 276
- Whitworth & Summers (1985) Whitworth, A. & Summers, D. 1985, MNRAS, 214, 1
- Wilson & Rood (1994) Wilson, T. L. & Rood, R. 1994, ARA&A, 32, 191
- Zhou (1995) Zhou, S. 1995, ApJ, 442, 685
- Zhou et al. (1993) Zhou, S., Evans, N. J., Kömpe, C., & Walmsley, C. M. 1993, ApJ, 404, 232
- Zhou, Evans, & Wang (1996) Zhou, S., Evans, N. J., I., & Wang, Y. 1996, ApJ, 466, 296
Images of the m and 450 m emission observed with SCUBA on the JCMT toward the YSOs L1489 IRS, L1535 IRS, L1527 IRS, and TMC 1. The contours are 2 intervals as listed in Table 3. The right-hand panels show the spectral index between 450 m and 850 m as derived from the data, plotted with contour intervals of 0.5. Note that the center of the images of L1489 IRS is to better bring out the extended emission. The filled circles in the lower right of the panels indicate the main beam size.
Blow-up of the central of the 450 m images. Contour levels are drawn at the same 2 intervals as Fig. Testing envelope models of young stellar objects with submillimeter continuum and molecular-line observations. The vertical bars indicate the FWHM sizes of the beams; the arrows indicate the direction of the outflows.
(left) Radial profiles of the 850 and 450 m emission obtained after azimuthal averaging of the SCUBA data around the source centers. For L1527 IRS this only includes a one-beam wide strip perpendicular to the outflow to minimize contamination with emission from emission along outflow. The solid symbols show the data, binned in half beam-width intervals. The error bars show the standard deviation within each annulus, which includes noise and any deviations from circular symmetry in the source. The dotted curve corresponds to the simple fit to the JCMT beam as derived from maps of Uranus (Table 2). The dash-dotted and solid lines depict the best-fit results for a power-law model (§4.1) and the inside-out collapse model (§4.2), respectively. The emission peaks at toward L1489 IRS and L1535 IRS correspond to the adjacent cores L1489 NE-SMM and L1535 N-SMM. (right) Radial profiles of the 850–450 m spectral index, with error bars including noise and deviations from circular symmetry. The calibration uncertainty between both wavelength bands in not included and may shift the spectral index up or down by 0.4, but does not affect its radial distribution.
Observed single-dish spectra from Hogerheijde et al. (1997, 1998) (histograms) and line profiles predicted by the inside-out collapse model including CO depletion (solid curves). Good agreement between the observed spectra and the model predictions is found for L1527 IRS (a) and TMC 1 (b), when CO is depleted by a factor of 10 in the coldest regions. Because of L1535 IRS’s weak continuum emission compared to L1535 IRS B, the derived model parameters are uncertain, and the predicted line profiles differ from the observations (c). For L1489 IRS (d) the predicted profiles do not agree with the observations. Instead, a different model is proposed for this source in the text.
Residual images after subtracting the best-fit inside-out collapse models of §4.2. For L1489 IRS and L1535 IRS, the Gaussian background source used in the fitting procedure has not been subtracted out. The contours are the same 2 intervals as Fig. Testing envelope models of young stellar objects with submillimeter continuum and molecular-line observations and as listed in Table3.
Radial profiles of L1489 NE-SMM and L1535 N-SMM, after subtraction of the best-fit power-law (symbols) and inside-out collapse (solid line) models. The dotted line shows the beam profile.
| Source | (2000.0) | (2000.0) | Dates | Chop PA | |
|---|---|---|---|---|---|
| L1489 IRS | 1997/Dec/7,8,10,16 | 60 | , | ||
| L1535 IRS | 04 35 35.23 | +24 08 25.3 | 1998/Jan/18 | 40 | |
| L1527 IRS | 04 39 53.89 | +26 03 11.0 | 1997/Dec/5,6 | 15 | AZ |
| TMC 1 | 04 41 12.74 | +25 46 33.3 | 1997/Dec/7,8,16,18 | 35 | AZ |
| Relative | FWHM | |
|---|---|---|
| (m) | amplitude | (′′) |
| 850 | 0.970 | 14.5 |
| 0.020 | 40 | |
| 0.010 | 70 | |
| 450 | 0.934 | 8 |
| 0.060 | 30 | |
| 0.006 | 120 |
| noise rms | aaTotal flux over entire observed image. | bbParameters of smallest Gaussian which can be fit to central peak. Size is deconvolved FWHM. The estimated error in the fitted peak fluxes are 5%, in the FWHM at 03–05, and in the PA are . | bbParameters of smallest Gaussian which can be fit to central peak. Size is deconvolved FWHM. The estimated error in the fitted peak fluxes are 5%, in the FWHM at 03–05, and in the PA are . | SizebbParameters of smallest Gaussian which can be fit to central peak. Size is deconvolved FWHM. The estimated error in the fitted peak fluxes are 5%, in the FWHM at 03–05, and in the PA are . | PAbbParameters of smallest Gaussian which can be fit to central peak. Size is deconvolved FWHM. The estimated error in the fitted peak fluxes are 5%, in the FWHM at 03–05, and in the PA are . | ||
|---|---|---|---|---|---|---|---|
| Source | (m) | (Jy beam-1) | (Jy) | (Jy beam-1) | (Jy) | (′′) | (∘) |
| L1489 IRS | 850 | 0.02 | 5.78 | 0.36 | 0.43 | 54 | |
| 450 | 0.10 | 23.3 | 1.76 | 2.82 | 51 | ||
| L1535 IRS | 850 | 0.03 | 6.03 | 0.18 | 0.29 | 53 | |
| 450 | 0.15 | 22.4 | 0.36 | 1.00 | 38 | ||
| L1527 IRS | 850 | 0.06 | 10.6 | 0.84 | 1.04 | 24 | |
| 450 | 0.27 | 65.3 | 2.79 | 5.07 | 36 | ||
| TMC 1 | 850 | 0.02 | 2.60 | 0.19 | 0.24 | 40 | |
| 450 | 0.10 | 12.5 | 0.65 | 1.20 | 56 |
| aaGaussian model for adjacent core. | FWHMaaGaussian model for adjacent core. | ||||||
|---|---|---|---|---|---|---|---|
| Source | (cm-3) | () | (Jy) | aaGaussian model for adjacent core. | (′′) | ||
| L1489 IRS | |||||||
| L1535 IRS | |||||||
| L1527 IRS | n/a | n/a | n/a | ||||
| TMC 1 | n/a | n/a | n/a |
Note. — Using AU (L1489 IRS), 8000 AU (L1535 IRS, L1527 IRS), 12,000 AU (TMC 1).
| aaGaussian model for adjacent core. FWHM unchanged from values in Table 4 | |||||||
|---|---|---|---|---|---|---|---|
| Source | (km s-1) | (AU) | (yr) | () | (Jy) | aaGaussian model for adjacent core. FWHM unchanged from values in Table 4 | |
| L1489 IRS | |||||||
| L1535 IRS | |||||||
| L1527 IRS | n/a | n/a | |||||
| TMC 1 | n/a | n/a |
Note. — Using AU (L1489 IRS), 8000 AU (L1535 IRS, L1527 IRS), 12,000 AU (TMC 1).
| a | |||
|---|---|---|---|
| Source | (km s-1) | (AU) | (yr) |
| L1489 IRS | 0.23 | 4.2 | 5.5 |
| L1535 IRS | |||
| L1527 IRS | 0.23 | 3.9 | 5.2 |
| TMC 1 | 0.17 | 4.0 | 5.4 |
References. — All parameters from Hogerheijde 1998
| Diameter | |||||
|---|---|---|---|---|---|
| Source | (′′) | (K) | () | () | |
| L1489 IRS | 5.5 | 45 | 1.1 | 1.75 | 0.01 |
| L1535 IRS | 11 | 41 | 0.9 | 0.51 | 0.006 |
| L1527 IRS | 6.5 | 35 | 0.9 | 0.95 | 0.035 |
| TMC 1 | 7.0 | 36 | 0.8 | 0.23 | 0.006 |