Stellar Birth Radii in the LMC: Insights into Chemodynamics, Radial Migration, and Star Formation Across the Disk
Abstract
The LMC and SMC are interacting dwarf galaxies that offer a valuable testbed for studying the effects of galactic mergers. We investigate the chemodynamic history of the LMC in the context of its interaction with the SMC by inferring stellar birth radii, first validated on a hydrodynamical simulation tailored to reproduce their interaction history. Using inferred birth radii and stellar ages, we identify signatures of dynamical and chemical evolution across the LMC disk. We find that the LMC’s metallicity gradient steepened around 5, 3, and 1 Gyr ago, coinciding with enhanced star formation (SF) episodes. These events exhibit distinct spatial patterns — initially concentrated in the inner disk at 5 Gyr, expanding outward by 3 Gyr, and becoming widespread with renewed central activity at 1 Gyr — likely reflecting changes in spin alignment between the interacting disks if the enhancements of SF tracks the pericenter passages of the SMC to the LMC. The inferred radial migration strength of the LMC shows notable enhancements at 0.5, 2, and 5 Gyr. The most -enriched stars form 2–3 Gyr ago at birth radii of 2–4 kpc, the only epoch when star formation is broadly distributed across the disk. Finally, unlike the Milky Way, the LMC lacks a clear [/M]–[Fe/H] bimodality. This is likely due to its more centrally concentrated star formation during these periods, compared to the MW’s more extended outer-disk star formation enhancements. These findings place strong constraints on the LMC’s assembly history and its interaction with the SMC.
1 Introduction
Radial migration is the process by which stars undergo permanent changes in angular momentum due to dynamical interactions, often at co-rotation resonances of various galactic structures. These interactions can arise from transient spiral arms (e.g., Sellwood & Binney, 2002; Roškar et al., 2008), overlapping resonances between the bar and spiral structure (e.g., Minchev & Famaey, 2010), external perturbations (e.g., Quillen et al., 2009), or a slowing bar (e.g., Zhang et al., 2025). Stars moving away from their birth locations means one cannot and should not equate an age-resolved evolution of a galaxy with its temporal evolution (e.g., Minchev et al., 2013; Frankel et al., 2019; Sharma et al., 2020; Lu et al., 2022b; Ratcliffe et al., 2023). One such common misconception is using “look-back time” and “age” interchangeably. Gradient evolution in age is typically shallower and exhibits more scatter around the relation than that in look-back time, as stars at a given age have had time to migrate across the galaxy (increase in scatter). They also typically move outwards as a population (flattening the gradient), due to the exponential surface density profile in galaxies (e.g., Minchev et al., 2013). As a result, in order to infer the true formation history of a galaxy, it is important to take into account the effects of radial migration.
Extensive efforts have been devoted to identifying the effects and signatures of radial migration in the Milky Way (MW). For example, studies have focused on understanding the metallicity distribution functions and the age-metallicity relation (e.g., Sellwood & Binney, 2002; Loebman et al., 2016; Lu et al., 2022b; Lian et al., 2022), the formation of the high- and low- disks (e.g., Sharma et al., 2020; Sahlholdt et al., 2022; Lu et al., 2024b), the temporal evolution of the metallicity gradient (e.g., Minchev et al., 2018; Lu et al., 2024b; Ratcliffe et al., 2023), and many more (e.g., Frankel et al., 2020). Despite extensive efforts in the MW, the effects of radial migration in external galaxies have received comparatively little attention. Recently, studies have shown that inferring the spatially resolved star formation history for disk galaxies without taking into account radial migration can introduce large uncertainties (Minchev et al., 2025; Bernaldez et al., 2025; Ratcliffe et al., 2025).
To begin addressing this gap, we start with the closest galaxy pairs to us — the MCs system. The LMC and the SMC have photometric observations for individual stars down to the main-sequence (e.g., VMC, SMASH, Cross et al., 2012; Cioni, 2016; Nidever et al., 2017, 2021), providing us with detailed star formation history (SFH) of the MCs (Rubele et al., 2018; Ruiz-Lara et al., 2020; Mazzi et al., 2021; Massana et al., 2022; Saroon et al., 2025). Moreover, detailed abundances are also available (Nidever et al., 2020) for a subset of the upper red giant branch stars (RGB) through the APOGEE–2S (Wilson et al., 2019). These observations of individual stars provide us with the exact data set we need to obtain birth radii (, the galactic-centric radius of where the stars are born). Combining age, , element abundances, and the SFH, we can begin to uncover the true chemodynamic history of the LMC and assess the role of major mergers in shaping galaxy evolution.
In Lu et al. (2024a), we explored the possibility of obtaining for external galaxies using the method described in Lu et al. (2024b), which is a method improved upon Minchev et al. (2018), using a set of updated assumptions (Lu et al., 2022a). Using the Numerical Investigation of a Hundred Astronomical Objects (NIHAO; Wang et al., 2015) cosmological simulations, we determined it is important to consider the effects of radial migration in the LMC when understanding its formation history, and birth radii can be inferred with 25% uncertainty.
In this paper, we test the method described in Lu et al. (2024b) on a hydrodynamical simulation of the LMC (Garver et al., 2026, in preparation.) that is set up to reproduce the formation and interaction history of the LMC and SMC. The description of the simulation is in Section 2.1. After successfully inferring from the simulation (Section 2.3), we apply this method to the LMC observations (Section 2.2) to infer and the temporal evolution of the metallicity gradient (Section 2.4). In Section 3, we look at the radial migration strength, preferred star formation radii across time, and the chemodynamic history of the LMC in [/M]-[Fe/H] space. Finally, in Section 4, we discuss how insights from the LMC–SMC merger inform our understanding of the two-infall model for the MW.
2 Data & Methods
2.1 Simulation Data
The orbit of the MCs is taken from the Garver et al. (2025, in preparation.) suite of 8,000 N-body interaction simulations. This produces closer encounters 2 Gyr and 150 Myr ago. We use the smooth particle hydrodynamics+N-body tree-code GASOLINE (Wadsley et al., 2004, 2017) to simulate the MCs and MW. The LMC and SMC are simulated in isolation for 6 Gyr and are then combined with the MW and evolved for another 2.5 Gyr. The simulated LMC begins with a gas disk of mass and a dark matter halo of mass . It is evolved in isolation for 6 Gyr during which time some of the gas forms into stars. Then it is combined with an SMC and MW model, and the combined simulation is evolved for a further 2.5 Gyr. GASOLINE tracks the [Fe/H] and [O/Fe] of the star and gas particles, as well as the birth times and locations of the stars. The simulation uses 20% feedback, which means that 20% of the erg of energy from SNe is injected as thermal energy into the interstellar medium.
2.2 Observational Data
Stellar ages were derived following the method in Povick et al. (2024) using observed APOGEE spectroscopic parameters (Teff, , [Fe/H], and [/Fe]) and multi-band photometry from Gaia (Gaia Collaboration et al., 2016, 2021a) and 2MASS (Skrutskie et al., 2006) with PARSEC isochrones (Girardi et al., 2002; Bressan et al., 2012; Marigo et al., 2017). Distances for the stars were found using the red clump model from SMASH (Choi et al., 2018a, b) and assuming that the RGB stars lie close to the disk plane. For each star, model photometry and were interpolated from the isochrones as functions of Teff, [Fe/H], [/Fe], and a trial age. Since the isochrones are based on scaled-solar models, the [Fe/H] are adjusted with the measured [/Fe] following Salaris et al. (1993) with updated coefficients from Povick et al. (2024). The trial age was then adjusted until the model photometry and best matched the observed values. Validation with the APOKASC asteroseismic sample (with accurate masses and ages) indicates that the age uncertainties are 20% (see Figure 16 in Povick et al., 2024). The selection function is calculated following the method described in Section 9 in Povick et al. (2024).
2.3 Recovering Birth Radii for LMC Simulation
Since inference can only be applied to stars formed in the galactic disk, we selected stars in the simulation that are born within 15 kpc of the galactic center with birth vertical height, 1 kpc. Changing to select 0.5 kpc does not alter our result significantly. We then scale the metallicity so that the standard deviation and median match those of the observations (median: 0.77 dex, std: 0.23 dex). To mimic the observational uncertainty, we perturbed the metallicity and age in the simulation by their typical observational uncertainty (0.015 dex for metallicity and 20% for age).
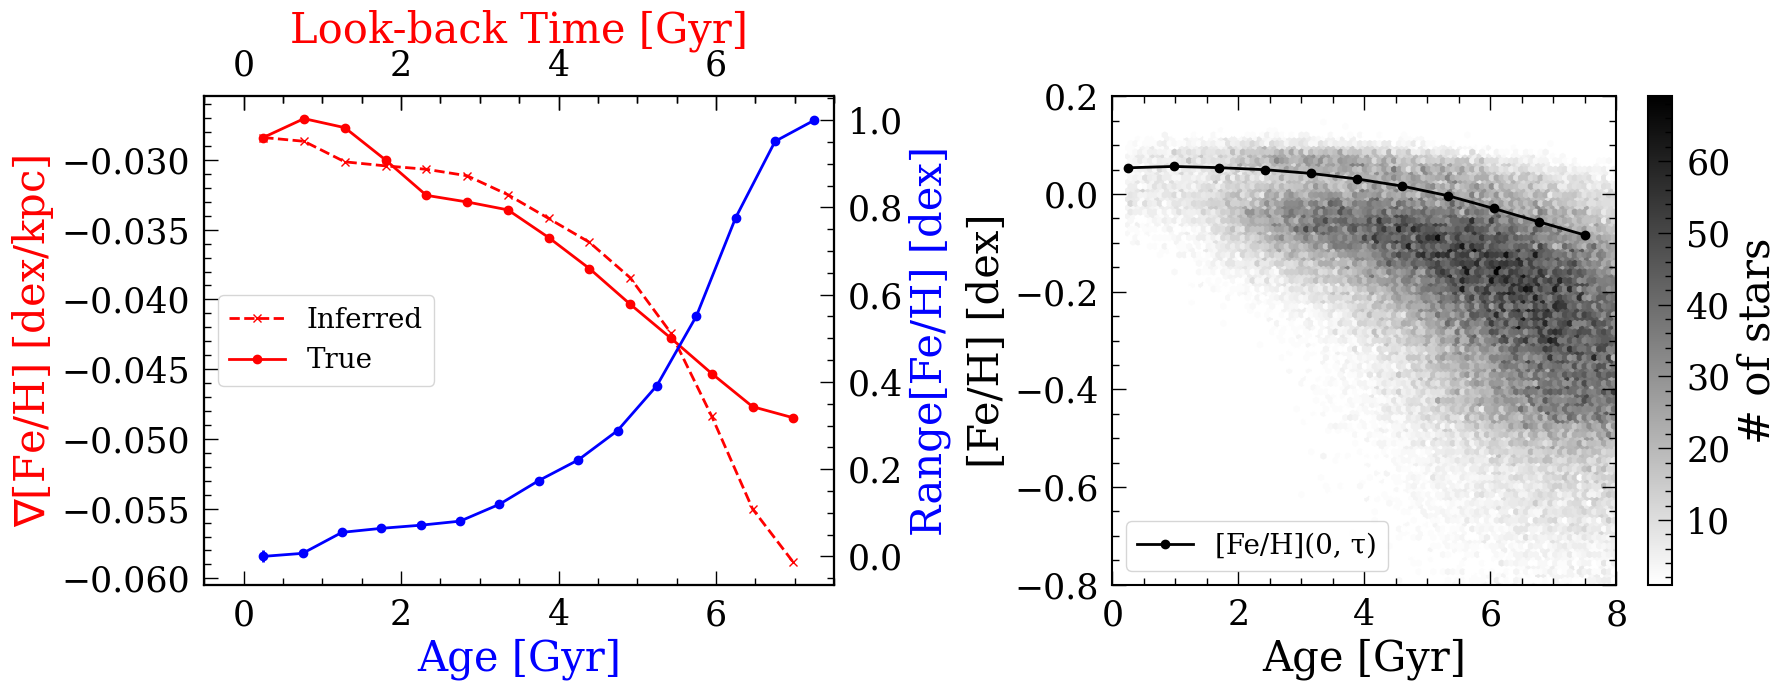
To infer , we first applied the procedure described in Lu et al. (2024b) to measure the range in metallicity in mono-age populations. The method stated that the metallicity gradient as a function of look-back time can be directly inferred using the range in metallicity as a function of age with a linear relation. Since fewer stars are formed in the outer disk, which should be the most metal-poor if we assume a negative metallicity gradient due to inside-out formation, we selected 10th-percentile for the lower limit instead of 5th-percentile when calculating the range of metallicity (Range[Fe/H]). We inferred the metallicity gradient () as a function of look-back time () using Equation (1) in Lu et al. (2024b):
| (1) |
Where 0.028 dex/kpc is the metallicity gradient at redshift 0, inferred using the youngest stars, and is the scaling factor, which we used 0.031 kpc-1 to ensure the disk is formed inside-out (oldest stars have the smallest ). The scaling factor The range, the inferred gradient evolution, and the true gradient evolution for the simulation are shown in the left plot of Figure 1. For better understanding, the range in metallicity (Range[Fe/H]) provides the shape of the inferred metallicity gradient, the current-day metallicity gradient, [Fe/H](0), provides the anchor point, and the scaling factor, , constrains the range, or the steepest point, for the metallicity gradient.
Birth radii are then inferred with age and metallicity measurements using Equation (3) in Lu et al. (2024b):
| (2) |
Where is inferred by first taking the 95th-percentile of the metallicity in mono-age populations (as shown in the right plot of Figure 1). This is because, assuming the metallicity gradient is always negative (naturally arising from inside-out formation), the metallicity of the center of the galaxy at a given look-back time will always contain the most metal-enriched stars of the same age. We then shift so that stars 1 Gyr have peaks close to 0, as these young stars should not have much time to migrate. The shifted value is determined to be -0.04 dex.
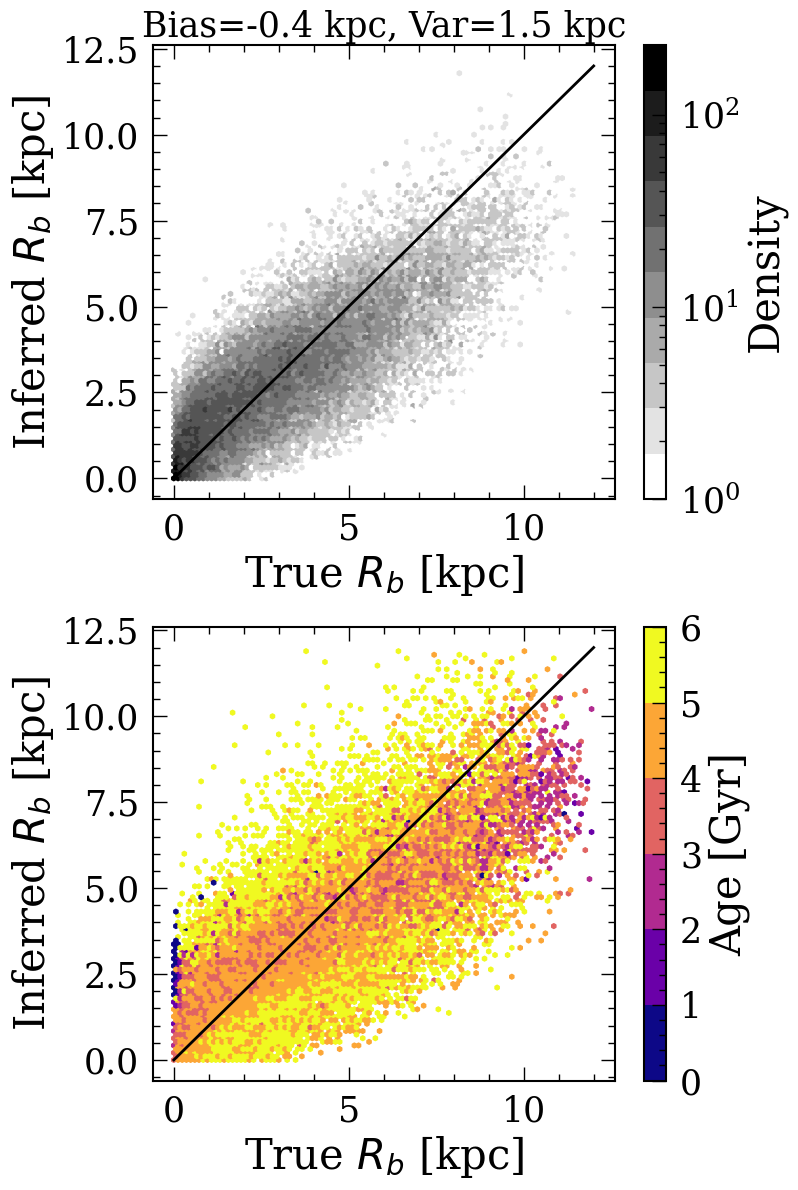
Figure 2 shows the inferred birth radii using the method described in this section compared to the truth for the simulation. We are able to infer birth radii with a variance of 1.5 kpc and a bias of -0.4 kpc for stars 6 Gyr. The bias could affect the absolute values of our results, but since the birth radii in this paper are primarily used to rank the locations where stars are born, the impact should be small as long as the ranking is preserved, i.e., stars formed in the outer disk have larger inferred compared to those formed in the inner galaxy, the bias should not significantly affect our conclusions regarding star-forming regions as a function of look-back time or the inferred migration strength.
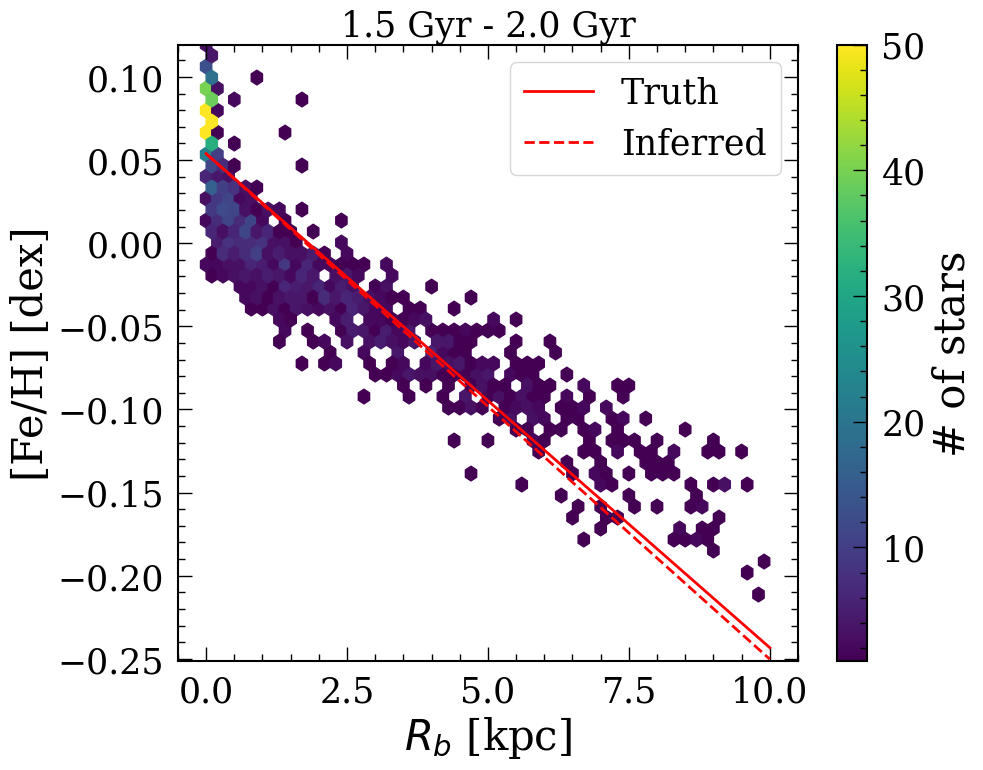
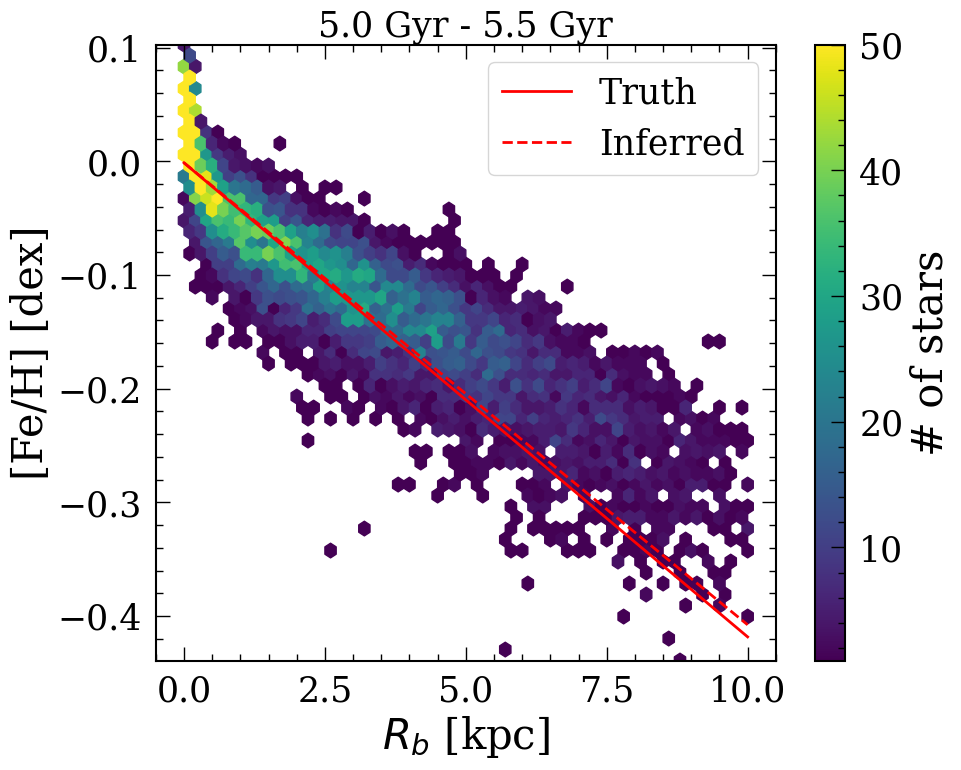
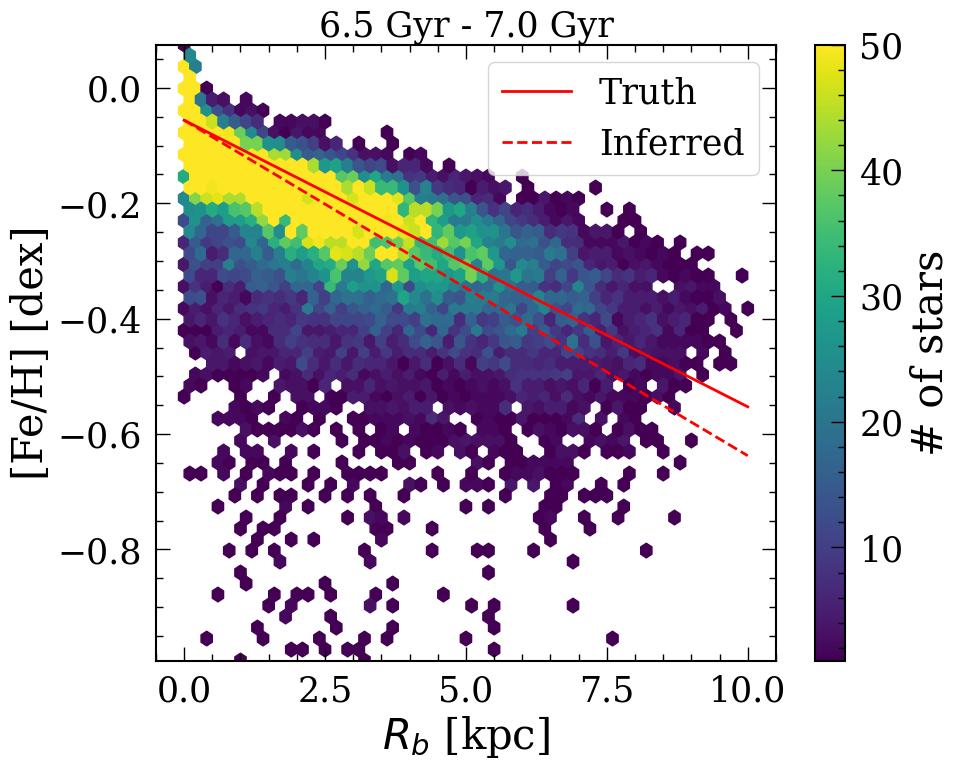
Figure 3 shows the [Fe/H]- distribution (background density plot), the true gradient (red, solid lines), and the inferred gradient (red, dashed lines) for three different look-back time bins. To infer birth radii, we assume all stars follow a perfect relation shown as the dashed line. The fits do not perform well for stars in the outer galaxy, as the gradient is not exactly linear, and most stars are born in the inner galaxy. This could explain the bias seen for stars in the outer disk (Figure 2). One other source of uncertainty comes from the fact that there is scatter around the relation. For stars 6 Gyr, the stellar disk is still settling from the initial condition, and since this method can only be applied to stars after the stellar disk has mostly formed (Lu et al., 2022a), it is not surprising we are not able to reproduce the true metallicity gradient while the disk is still settling and the scatter around the metallicity gradient is larger (see Figure 3 right panel).
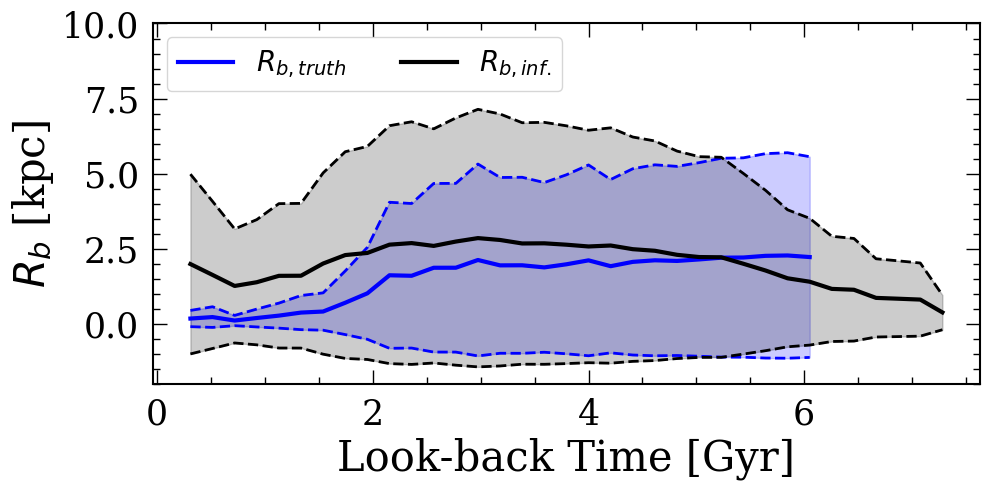
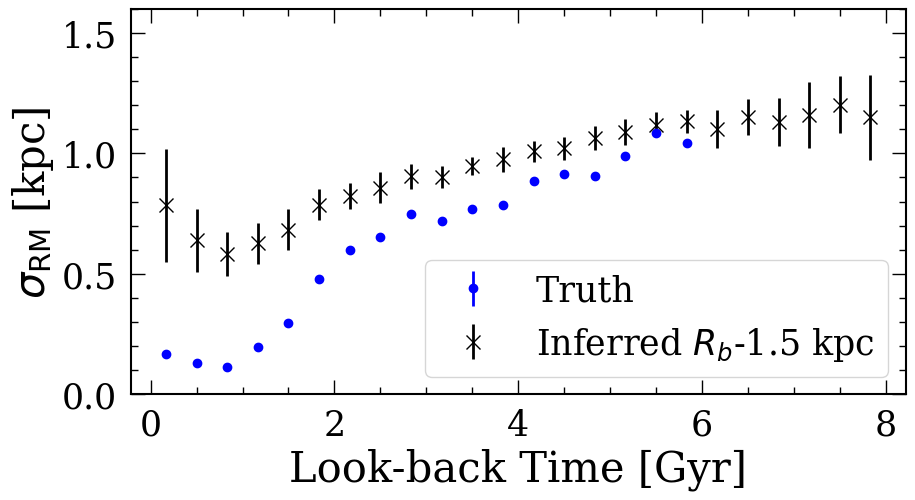
Finally, Figure 4 compares the distribution as a function of age and the radial migration strength in the simulation for stars 6 Gyr. The left panel presents the median and 1.5*MAD of in each age bin using the truth (; blue) and the inferred (; black). Ages include a 20% uncertainty convolved to mimic observation data. The overall shape of the median and dispersion is reproduced down to 1 Gyr. This is not surprising as we are only able to infer birth radii to the accuracy of 1.5 kpc, and most stars 1 Gyr in the simulation are born within the central 1 kpc. The right panel shows the radial migration strength (), calculated with 1.5*MAD of mono-age populations, using the true and the inferred . Uncertainties in radial migration strength from the inferred are obtained via bootstrapping, perturbing within 1.5 kpc (the variance from Figure 2) and age within 20% (the typical observational age uncertainty). To account for the variance between true and inferred , 1.5 kpc was subtracted from the inferred measurement. After this correction, the recovered migration strength reproduces the overall shape, including the minimum near 1 Gyr, and agrees with the true values within the estimated uncertainties.
2.4 Recovering Birth Radii for the LMC
Before applying the method to observational data, we account for the selection function by first identifying the star that has the smallest represented stellar mass. We then make copies of the remaining stars by the number of smallest represented stellar masses they represent. We perturb the age and abundances within their uncertainty before adding each copy. This increases the number of stars in the sample from 6,000 to 26,000.
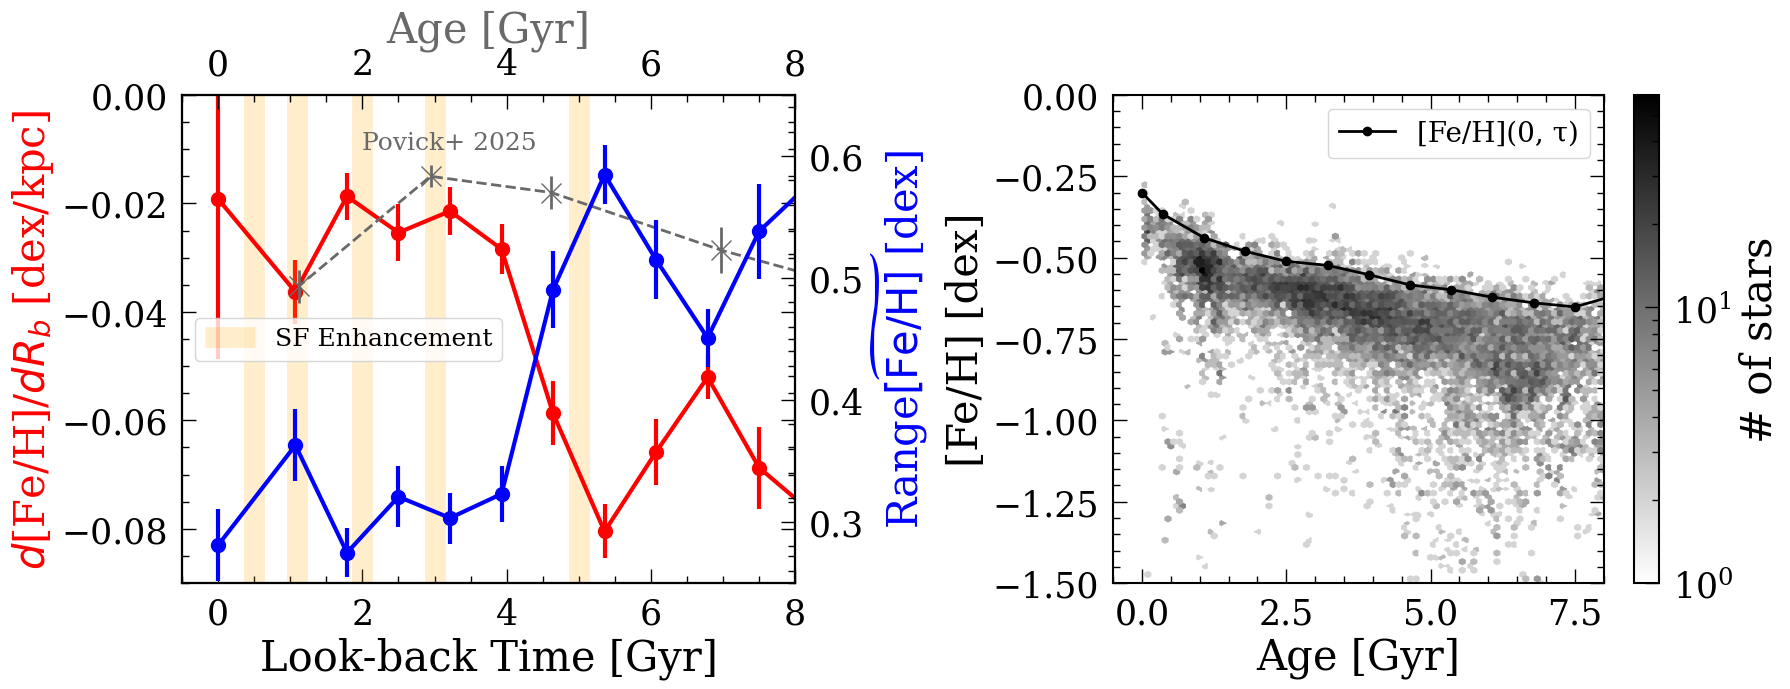
After accounting for the selection function, we apply the method described in the previous section to the data, using age bins between 0 and 8 Gyr, with a width of 0.5 Gyr to obtain Range[Fe/H]. To calculate the uncertainty, for each age bin, we performed bootstrapping 100 times by randomly selecting 200 stars each time and recomputed the percentiles. For reference, we have over 800 stars in each age bin, and changing the number of stars we select to be 100 or 400 does not impact our result. The uncertainty is then taken to be the standard deviation of all the calculations. Figure 5 left panel shows the measured Range[Fe/H] as a function of age (top axis). The center metallicity evolution is determined using the 80th-percentile of the metallicity in mono-age bins, as we did for the simulation. The result is shown as the black solid line in the right panel of Figure 5.
We inferred the birth metallicity gradient as a function of look-back time using Equation 1, where kpc-1, and [Fe/H](0) = ( Range[Fe/H](0) dex/kpc, where is the current day metallicity gradient, and Range[Fe/H](0) = dex is the current day Range[Fe/H], both measured using stars 0.7 Gyr. This ensures Equation 1 can reproduce the current day gradient with the current day Range[Fe/H]. We determine the value of so that the older stars are born in the inner galaxy, following inside-out growth; stars born today have not migrated much, meaning the distribution peaks close to 0 and the width of the Gaussian is 2 kpc for the youngest stars ( 1 Gyr; see Figure 6); and the birth metallicity gradient at a look-back time is at least as steep as the observed metallicity gradient for stars of the same age, since radial migration has the effect of making the birth gradient shallower — a natural phenomenon in galaxies with decreasing surface density towards the disk outskirt. The uncertainty on the inferred birth metallicity gradient is determined by bootstrapping the slope 100 times with Range[Fe/H] measurements perturbed within their uncertainty. We mark the times (0.5, 1.1, 2, 3, and 5 Gyr) where star formation (SF) is enhanced in the LMC (Massana et al., 2022), in which the enhancements of 0.5, 1.1, 2, and 3 Gyr are thought to be caused by the interaction between the MCs, as similar peaks are also found in the SMC. It is unclear what causes the enhancement at 5 Gyr, as this is only seen in the LMC but not in the SMC. However, Saroon et al. (2025) finds enhancement in the SMC around the same time in the outskirts of the galaxy.
Steepening in the metallicity gradient is observed at 1 and 5 Gyr. This is also seen in the MW (e.g., Lu et al., 2024b) and MW-like simulations (e.g., Buck et al., 2023; Ratcliffe et al., 2024). They are typically caused by the sudden increase in the cold gas disk size from lower metallicity gas accreted from infalling satellites. As a result, even if the SMC did not show enhancement in SF in its main body, the signature at 5 Gyr still matches with those of a gas accretion event.
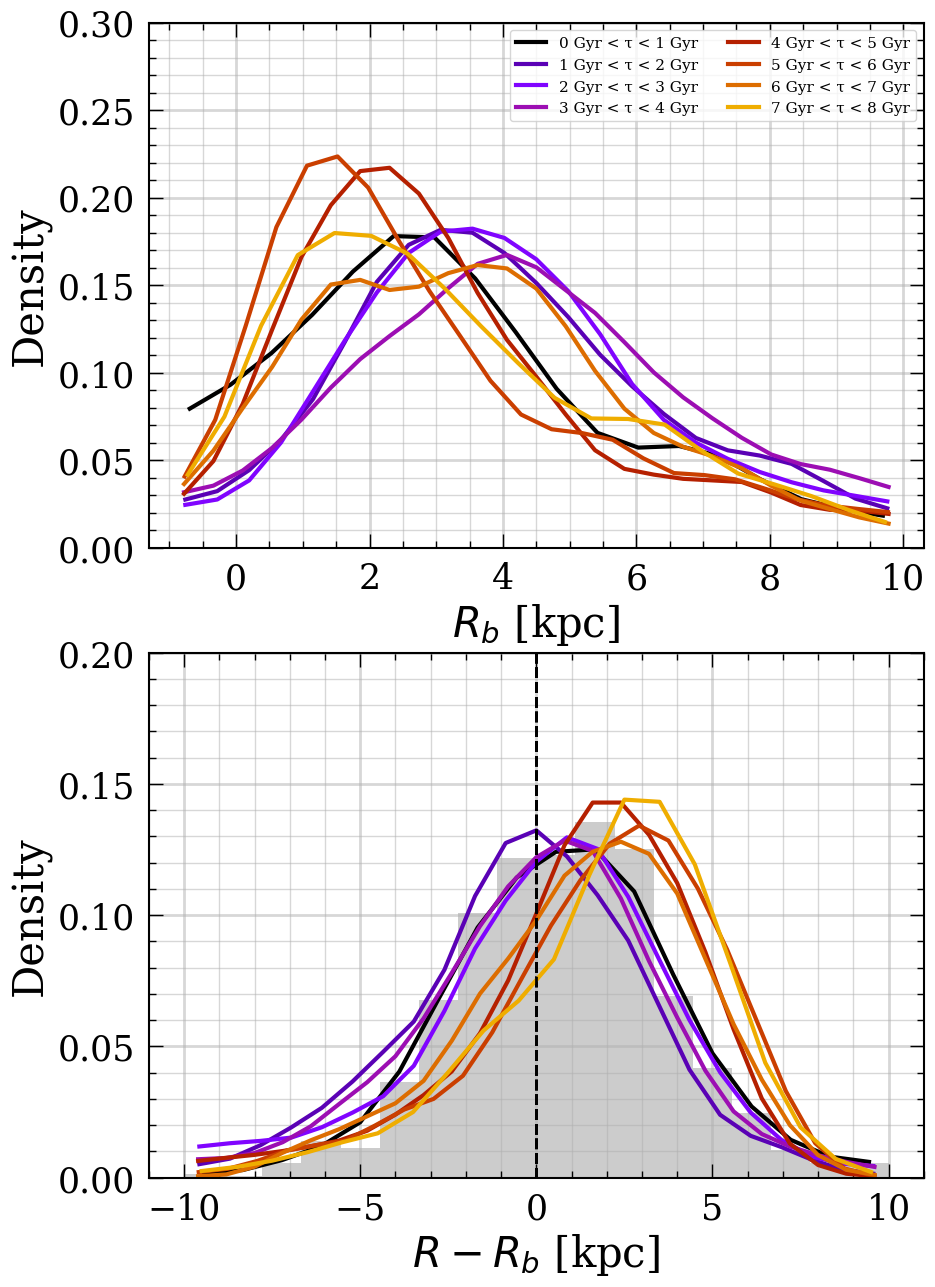
Finally, we estimated the birth radii of stars in the LMC using Equation 2. For each star, we performed 50 Monte Carlo realizations of the birth radius calculation, drawing age, [Fe/H], and [Fe/H]() from Gaussian distributions centered on their measured values and with standard deviations equal to their respective uncertainties. The final birth radius and its uncertainty were taken as the median and half of the difference between the 84th-percentile and the 16th-percentile of these 50 realizations. Figure 6 presents the resulting birth radius and migration distributions for stars grouped by age. As expected from inside-out galaxy formation, older stars should originate in the inner disk relative to younger stars. Additionally, the youngest stars, which haven’t had much time to migrate, exhibit a median radial migration close to 0 kpc, with a characteristic dispersion (migration strength) of approximately 1.5 kpc.
It is worth pointing out that Gallart et al. (2009), and recently, Frankel et al. (2025), suggested that the LMC could form outside-in based on the scale length in mono-[Fe/H], mono-age populations. We could not test this in this work, as overall inside-out formation is one of our assumptions. However, according to individual distributions, the youngest stars are formed more in the inner disk, and some of the oldest stars ( 6 Gyr) are formed in the outer disk. We will revisit this topic in Section 3.2.
3 Results
3.1 Where and When are the LMC Stars Formed
With birth radii, we can now picture a more detailed star formation history — not only when stars are formed, but also where. Figure 7 shows as a function of look-back time, while the black vertical lines show the center of enhancement of SF episodes indicated in Massana et al. (2022) or Mazzi et al. (2021), the red vertical lines show the model predictions of the pericenter passages of the SMC to the LMC from model 2 in Besla et al. (2012), and the text on top shows the possible first pericenter passage of the LMC with the MW predicted in Vasiliev (2024). The blue solid line and the blue dashed lines show the median and 1.5*MAD of . Combining information shown for the birth metallicity gradient in Figure 5, we can conclude that 6 Gyr, the LMC forms inside-out, with most of the stars forming with galactic radius 2 kpc at 8 Gyr to 6 kpc at 6 Gyr.
During the first enhancement of star formation at 5 Gyr according to Massana et al. (2022), most stars are born in the inner disk while the metallicity gradient steepens and the center metallicity slightly increases. Enhancement of SF in the central kpc and suppression of SF in the outer disk could happen during a passage where the primary and secondary galaxies have aligned disk spin orientations, and gas from the secondary quickly funnels in the center of the primary (e.g., Moreno et al., 2015). If this is caused by the passage of the SMC, similar enhancement should be seen in the SMC. This is seen in Rubele et al. (2018) but is not in Massana et al. (2022), possibly because of the difference in spatial selection. After this starburst, the LMC gradient then quickly flattens between 4-5 Gyr. During the SF enhancement at 3 Gyr, most stars are formed in the center or outer disk, between 2-6 kpc. The metallicity gradient also decreases, showing obvious expectations from gas-rich merging satellite (e.g., Torrey et al., 2012; Lu et al., 2024b; Buck et al., 2023). If this is triggered by the pericenter passage of the SMC, the disk spin orientations between the MCs are likely not aligned or perpendicular. The enhancement at 1.1 Gyr shows even a stronger steepening of the metallicity gradient, with stars forming across the LMC and a significant enhancement in star formation in the center, between 1-4 kpc, suggesting aligned disk spin orientations. Finally, the enhancements identified by Massana et al. (2022) at 0.5 Gyr and 2 Gyr show no significant imprints in our distribution. This suggests the SMC and LMC close encounters likely happened around the enhancement in SF 1, 3 Gyr, and perhaps 5 Gyr, agreeing with predictions from some simulations (e.g., Besla et al., 2012; Pardy et al., 2018). The star formation region also suggested a change in disk alignments between the MCs during the multiple passages.
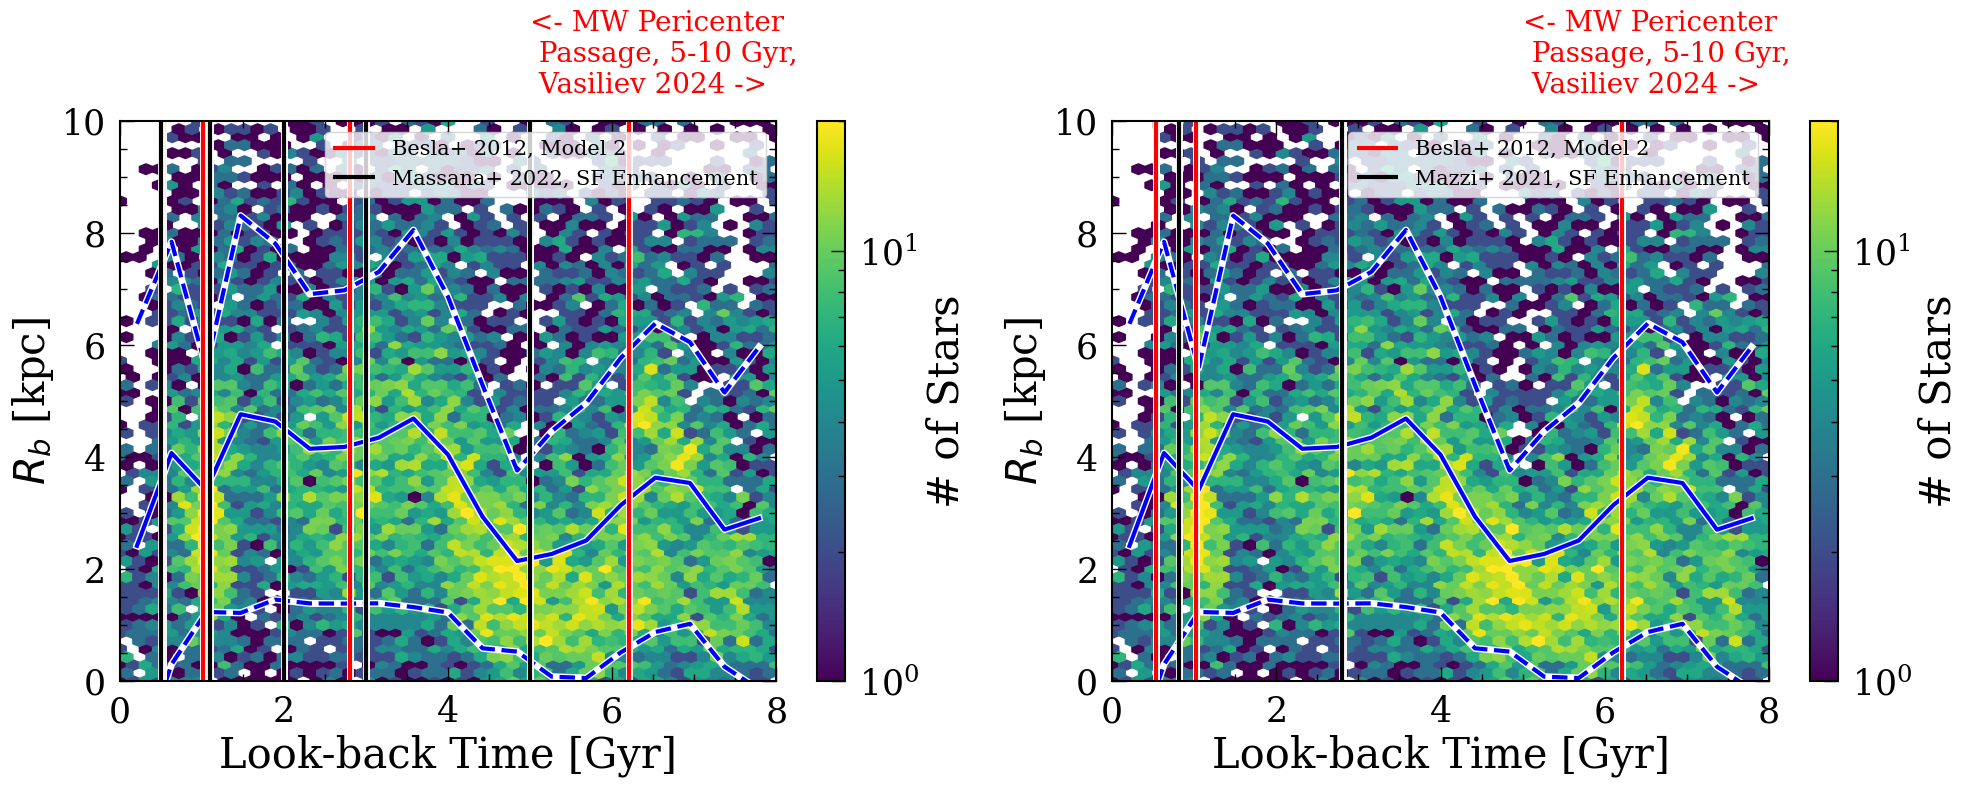
However, if the star formation enhancements do not track the pericenter passages of the SMC, and the model 2 predictions from Besla et al. (2012) are correct, the SMC/LMC disks are likely aligned across all passages. This can be inferred as during all three of these pericenter passages, most stars formed in the middle or outer disk, suggesting disk alignments. The size of the star-forming region (indicated by the blue dashed lines) also increased close to the times when the SMC was predicted to be at the pericenter passages with the LMC according to model 2.
3.2 Radial Migration Strength in the LMC
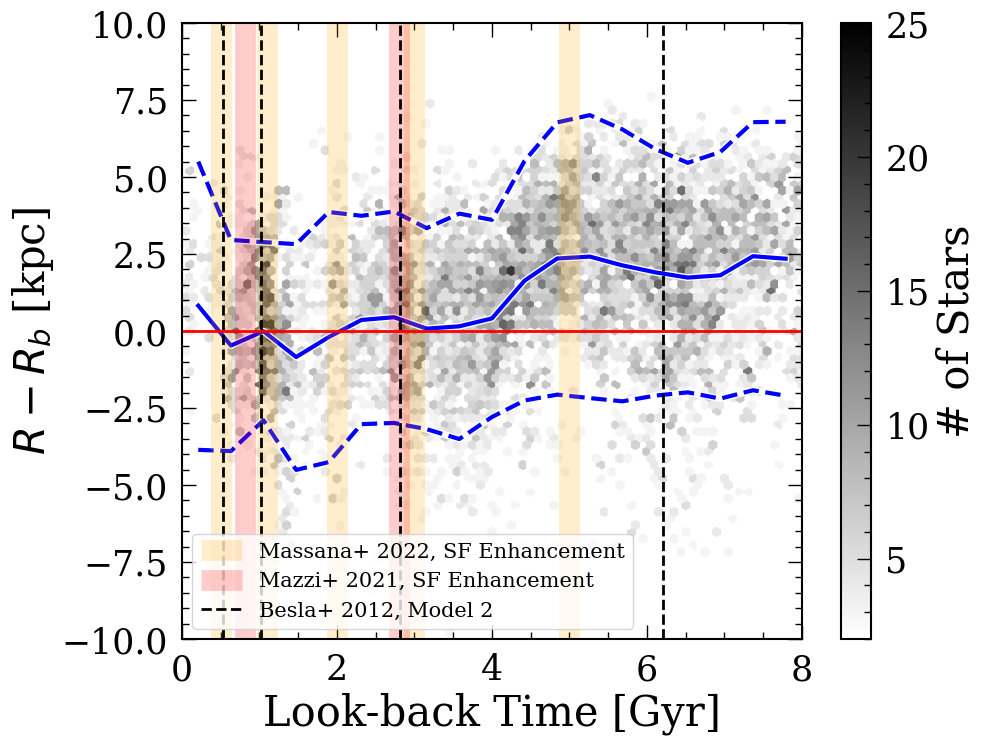
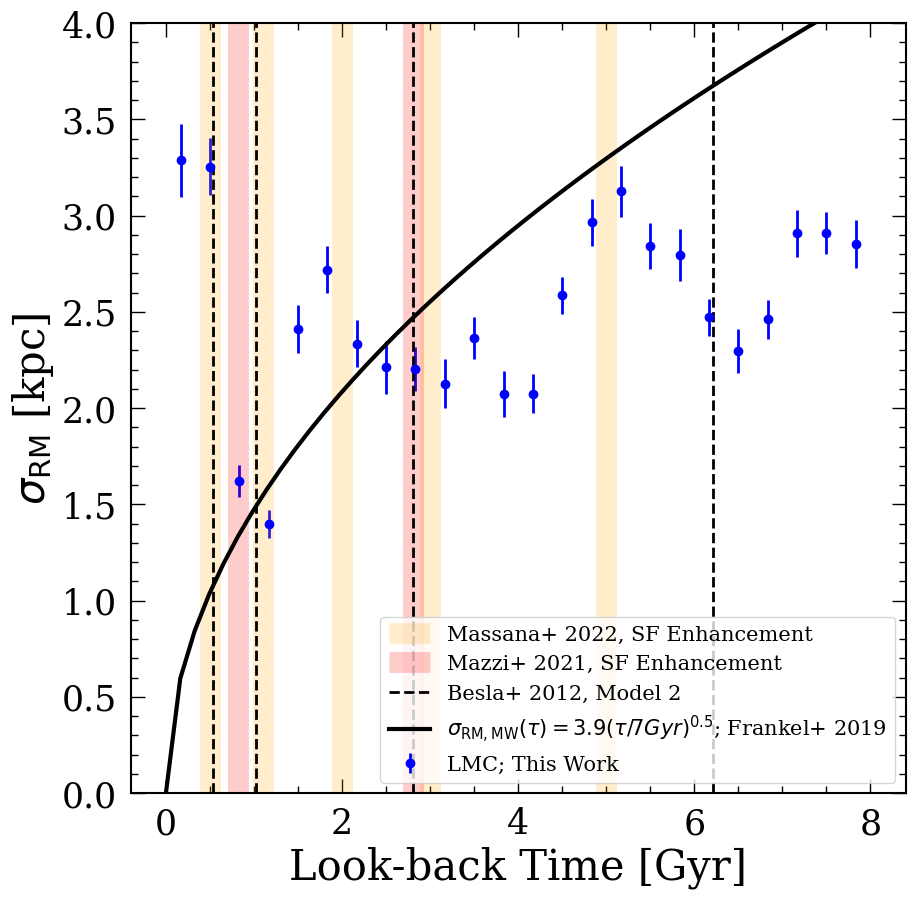
We quantify the radial migration strength by looking at the median and width of the distributions as a function of look-back time, where the median represents the overall migration of a mono-age population, and the width quantifies the strength. Figure 8 shows the radial migration for the LMC stars as a function of look-back time, where the left plot shows the full distribution with median (blue solid line) and 1.5*MAD (blue dashed line), and the right plot shows the standard deviation () as a function of look-back time for the LMC data (blue points). For comparison, we also plotted the analytic model for the MW taken from Frankel et al. (2019). The standard deviation is measured to be 1.5*MAD to account for outliers. The orange and red lines are the SF enhancements taken from Massana et al. (2022) and Mazzi et al. (2021), respectively. We also plotted the predictions for the pericenter passages taken from Besla et al. (2012) model 2.
We find an increase in radial migration strength close to the SF enhancements at 0.5, 1.1, and 5 Gyr. During these times, stars migrated outwards, exceeding the average. However, during the enhancements around 2 and 3 Gyr, the stars have median migrations close to 0. This is not surprising as most stars in our sample are born in the inner disk during the increase in SF around 1.1, and 5 Gyr (see Figure 7), meaning they can only migrate outwards. Since stars are born more evenly across the disk at 3 Gyr, the median stays around 0. The right panel of Figure 8 suggests the migration strength is significantly higher close to most SF enhancements. This is especially obvious at 0.5, 2, and 5 Gyr. Interestingly enough, 0.5 and 2 Gyr are the times that we find no significant preference for where in the disk the stars are preferably born. These increases in migration strength can be caused by external perturbation of the SMC on the LMC during pericenter passages (e.g., Quillen et al., 2009).
The radial migration strength as a function of time for the LMC could be similar, but with a slightly shallower slope than the MW analytic solution taken from Frankel et al. (2019). The migration strength is consistently higher compared to the migration strength from the MW data and analytic solution during the time of frequent SF enrichment below 1 Gyr, where the MCs are most likely interacting. This suggests interacting galaxies of mass ratio 1:10 can produce a significant increase in migration strength.
3.3 The Chemodynamic History of the LMC
With , we are able to recover the Chemodynamic history of the LMC empirically. We do so by looking at the age-metallicity, age-[/M], and [Fe/H]-[/M] relations in mono- and mono-age populations.
Figure 9 shows the age-metallicity (left) and age-[/M] (right) relations in mono- and mono-age populations. Each colored line shows the median evolution of the abundances of stars in a 2 kpc bin. The white segments show the times at which SF enhancements are observed. During the enhancements at 1, 3, and 5 Gyr, the overall metallicity goes down or stays constant at all radii, suggesting dilution from pristine gas. This also matches with the enhancement of SF during those times, as observed in Figure 7. Since the majority of star formation 5 Gyr ago is concentrated in the inner disk, elements should be produced mostly in the central region. As a result, [/M] only increases for mono- tracks 5 kpc, and [/M] decreases in the outer disk, where star formation efficiency (SFE) is low, and no elements are produced. At 3 Gyr, the star formation spreads across the entire disk, thus, [/M] increases for almost all mono- tracks, thanks to the contribution of SN Type II from these newly formed stars. At 1 Gyr, it is possible that the LMC did not accrete a significant amount of gas, given the minor decrease in [Fe/H]. The decrease of [/M] at all radii during that time suggests the SFE is not high. These tracks place strong constraints on the gas accretion and star formation history at various locations and times.
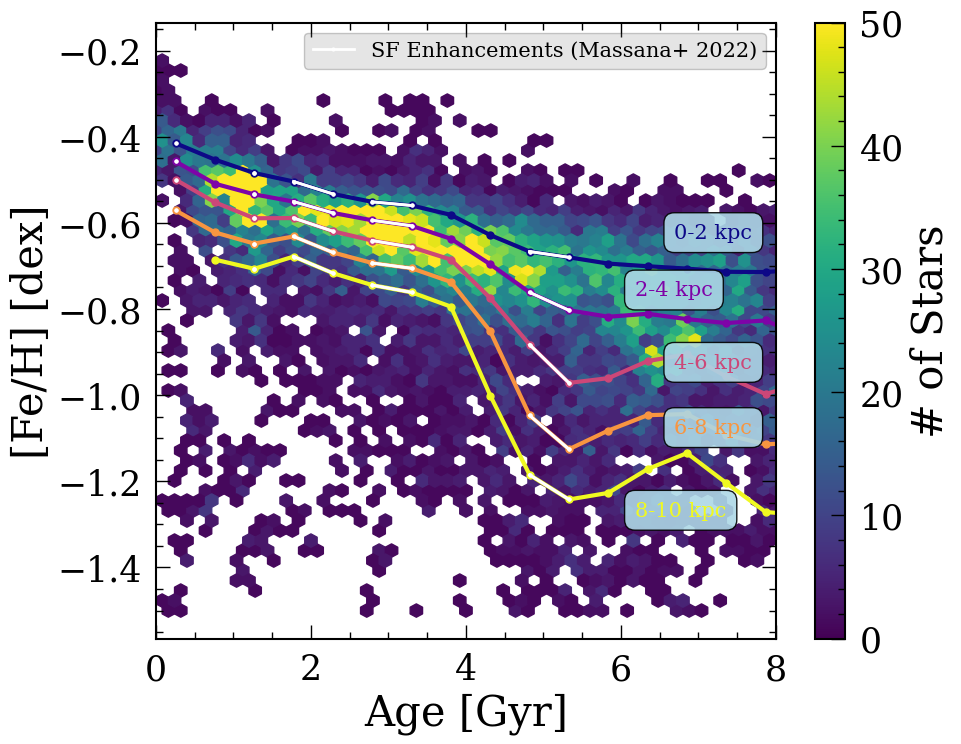
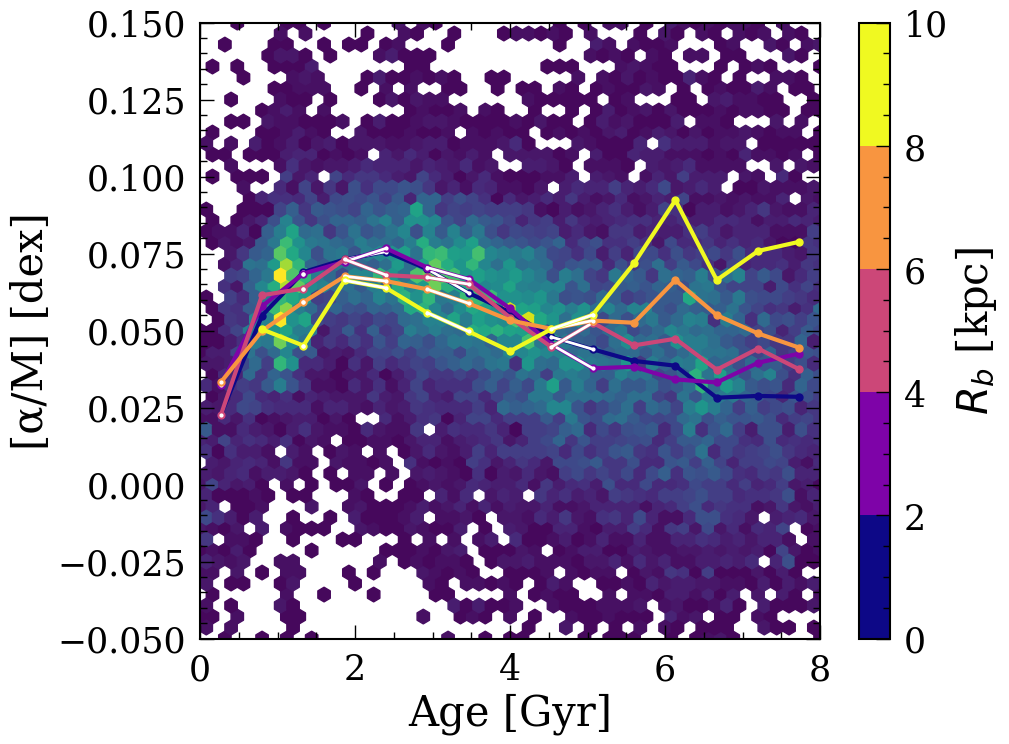
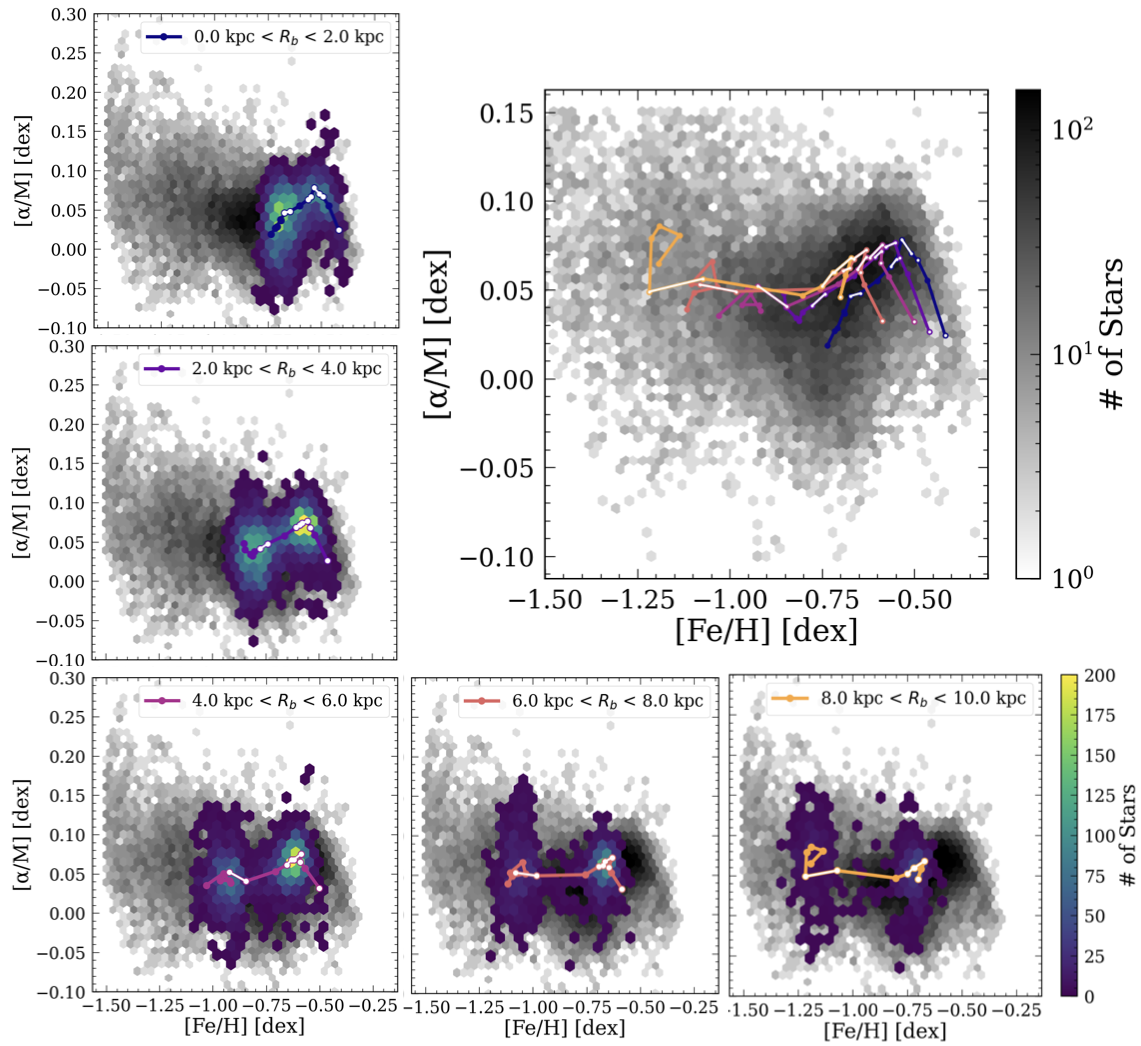
Figure 10 shows the temporal evolution of [/M]-[Fe/H] for various radii. The biggest panel on the top right shows the mono- tracks, similar to what is done in Figure 9. The smaller panels show the density and median abundances for stars in different bins, increasing from the top left to the bottom right. The white lines and points mark the SF enhancements. Similar to what was found in the MW in Lu et al. (2024b), the SF enhancements naturally show up as over-densities in mono- populations. The most -enriched stars are formed during the SF enhancements 3-2 Gyr ago, mostly between 2-4 kpc. This is also the time when most of the stars are formed during the SF enhancement at 3 Gyr.
4 Insight into the lack of [/M]-[Fe/H] bimodality of the LMC
The MW exhibits a distinct gap between the high- and low- disk (e.g., Bensby et al., 2014; Nidever et al., 2014; Hayden et al., 2015), and popular theories include the two-infall model (e.g., Chiappini et al., 1997; Spitoni et al., 2021), clumpy star formation (e.g., Clarke et al., 2019; Garver et al., 2023), radial migration (e.g., Sharma et al., 2020), and quenching in star formation (e.g., Beane et al., 2025). Compared to the MW, the LMC does not show such a signature, which raises questions on whether the bimodality is a common feature in disk galaxies (see also analysis on M31 in Nidever et al., 2024).
What is interesting is that looking at LMC stars in mono- population in Figure 10, overdensities in [/M]-[Fe/H] show up during times of SF enhancements, similar to what is seen in the MW (Lu et al., 2024b). We compare the most prominent steepening of the metallicity gradient in both galaxies — at 5 Gyr ago for the LMC and 8 Gyr ago for the MW — during which the MW developed its low- disk. Examining Figure 7 in Lu et al. (2024b), we suggest that the distinct bimodality observed in the MW’s [/M]–[Fe/H] plane, compared to the LMC, may be attributed to the extended star formation history in the MW’s outskirts. This extended star formation began around 8 Gyr ago and directly produced the most metal-poor low- stars. In contrast, star formation in the outskirts of the LMC appears to have been suppressed during its corresponding gradient-steepening episode at 5 Gyr, preventing the formation of a similarly extended low- sequence. Moreover, the centrally concentrated star formation in the LMC at this time mitigated the typical decline in [/M] caused by delayed SN Ia enrichment. The simultaneous increase in -element production from SN II explosions associated with new star formation counteracts the SN Ia effect, resulting in little net change in [/M] in the inner disk during the 5 Gyr event, preventing any bimodality from forming in the inner disk.
In summary, the lack of bimodality in the [/M]-[Fe/H] plane for the LMC could likely be caused by a combination of the changes in star-forming regions and enrichment history.
5 Limitations
The main caveat is whether we can robustly recover for the LMC, given its recent interaction with the SMC. Tests on the NIHAO simulation suite (Wang et al., 2015) suggest this should be feasible. In Lu et al. (2024a), we showed that an LMC-like galaxy—with an estimated dark matter halo mass of (Shipp et al., 2021) and a current “diskiness” of (Figure B.5 in Gaia Collaboration et al., 2021b)—can be used to infer using the method described in Lu et al. (2024b). In that work, we successfully recovered for a simulated LMC-mass galaxy (halo mass ) that had undergone a merger roughly 1 Gyr ago, similar to the recent interaction between the Magellanic Clouds. Furthermore, the simulation analyzed in this study (Garver et al., 2026, in preparation.), which reproduces the interaction history of the MCs, also indicates that we should be able to robustly recover for the LMC and extract meaningful insights into its migration and star formation history. That said, our ability to validate the method is limited to simulations, and unforeseen effects from the MCs’ interaction could hinder its applicability. Additional assumptions, such as the metallicity gradient being negative and approximately linear during the early formation of the LMC’s stellar disk, may also introduce uncertainties.
6 Conclusion & Future Work
In this paper, we tested a previous method described in Lu et al. (2024b) to infer birth radii () for star particles in a hydrodynamical simulation intended to reproduce the interaction history of the MCs. We then applied this method to infer birth radii for the LMC stars. Combining and age information, we are able to study the chemodynamic history of the LMC in the context of its interaction with the SMC. We found:
-
•
Steepening of the LMC metallicity gradient around 5, 3, and 1 Gyr ago, suggesting accretion of pristine gas. These times coincide with some of the SF enhancements reported by Massana et al. (2022).
-
•
At 5 Gyr, star formation is concentrated in the inner disk. By 3 Gyr, it becomes more widespread, extending from the center to the outer disk. At 1 Gyr, the star formation remains broadly distributed but shows renewed concentration in the inner disk. These differences, if caused by the interactions between the MCs, could be due to different alignments of the disk spin orientations (e.g., Moreno et al., 2015). However, if the SF enhancements do not track the pericenter passages of the SMC to the LMC, and the inferred passages are correct in model 2 from Besla et al. (2012), the SMC and LMC disk spin orientations are likely aligned and has not changed, as the star formations are concentrated in the middle and outer disk for all three predicted pericenter passage times.
-
•
The migration strength for the LMC is found to be 4.4(/8 Gyr)0.4, with significant enhancements around 0.5, 2, and 5 Gyr.
-
•
No strong signature of the SF enhancements is found in the metallicity gradient or preferred star formation location at 0.5 and 2 Gyr, but an increase in migration strength is observed for both.
-
•
SF enhancements show up as clumps in [/M]-[Fe/H] space, as does for the MW in Lu et al. (2024b).
-
•
The most -enriched stars are formed 2-3 Gyr ago, mostly between 2-4 kpc. This is also the only time when the star formation is spread out across the disk.
-
•
The LMC does not exhibit a clear [/M]–[Fe/H] bimodality like that observed in the Milky Way, despite showing similar signatures of significant gas accretion events. This difference is likely due to the centrally concentrated nature of star formation in the LMC during these episodes, in contrast to the more spatially extended star formation that occurred in the outskirts of the MW.
These relations place strong constraints on the formation of the LMC and the interaction history between the MCs. Future work should explore different simulation suites to better understand how merger orbits and gas accretion events (e.g., galactic fountains) can affect the star formation region in the merging galaxies and explore different assumptions, as in this work, we assume stars preferentially migrate outwards as a population.
7 Acknowledgments
Y.L. wants to thank James Johnson for the helpful discussion. B.G. and D.L.N. acknowledge support by NSF grants AST 1908331 and 2408159. We thank V. Debattista for help running the Gasoline simulations. NGC acknowledges support provided by the Heising-Simons Foundation grant # 2022-3927. This work has made use of data from the European Space Agency (ESA) mission Gaia,111https://www.cosmos.esa.int/gaia processed by the Gaia Data Processing and Analysis Consortium (DPAC).222https://www.cosmos.esa.int/web/gaia/dpac/consortium Funding for the DPAC has been provided by national institutions, in particular the institutions participating in the Gaia Multilateral Agreement. This research also made use of public auxiliary data provided by ESA/Gaia/DPAC/CU5 and prepared by Carine Babusiaux. This research has also made use of NASA’s Astrophysics Data System.
References
- Astropy Collaboration et al. (2013) Astropy Collaboration, Robitaille, T. P., Tollerud, E. J., et al. 2013, A&A, 558, A33, doi: 10.1051/0004-6361/201322068
- Astropy Collaboration et al. (2022) Astropy Collaboration, Price-Whelan, A. M., Lim, P. L., et al. 2022, ApJ, 935, 167, doi: 10.3847/1538-4357/ac7c74
- Beane et al. (2025) Beane, A., Johnson, J. W., Semenov, V. A., et al. 2025, ApJ, 985, 221, doi: 10.3847/1538-4357/adceab
- Bensby et al. (2014) Bensby, T., Feltzing, S., & Oey, M. S. 2014, A&A, 562, A71, doi: 10.1051/0004-6361/201322631
- Bernaldez et al. (2025) Bernaldez, J. P., Minchev, I., Ratcliffe, B., et al. 2025, arXiv e-prints, arXiv:2508.19340, doi: 10.48550/arXiv.2508.19340
- Besla et al. (2012) Besla, G., Kallivayalil, N., Hernquist, L., et al. 2012, MNRAS, 421, 2109, doi: 10.1111/j.1365-2966.2012.20466.x
- Bressan et al. (2012) Bressan, A., Marigo, P., Girardi, L., et al. 2012, MNRAS, 427, 127, doi: 10.1111/j.1365-2966.2012.21948.x
- Buck et al. (2023) Buck, T., Obreja, A., Ratcliffe, B., et al. 2023, MNRAS, 523, 1565, doi: 10.1093/mnras/stad1503
- Chiappini et al. (1997) Chiappini, C., Matteucci, F., & Gratton, R. 1997, ApJ, 477, 765, doi: 10.1086/303726
- Choi et al. (2018a) Choi, Y., Nidever, D. L., Olsen, K., et al. 2018a, ApJ, 866, 90, doi: 10.3847/1538-4357/aae083
- Choi et al. (2018b) —. 2018b, ApJ, 869, 125, doi: 10.3847/1538-4357/aaed1f
- Cioni (2016) Cioni, M. R. L. 2016, in Astrophysics and Space Science Proceedings, Vol. 42, The Universe of Digital Sky Surveys, ed. N. R. Napolitano, G. Longo, M. Marconi, M. Paolillo, & E. Iodice, 49, doi: 10.1007/978-3-319-19330-4_6
- Clarke et al. (2019) Clarke, A. J., Debattista, V. P., Nidever, D. L., et al. 2019, MNRAS, 484, 3476, doi: 10.1093/mnras/stz104
- Cross et al. (2012) Cross, N. J. G., Collins, R. S., Mann, R. G., et al. 2012, A&A, 548, A119, doi: 10.1051/0004-6361/201219505
- Frankel et al. (2025) Frankel, N., Andrae, R., Rix, H.-W., Povick, J., & Chandra, V. 2025, ApJ, 979, 136, doi: 10.3847/1538-4357/ad9b17
- Frankel et al. (2019) Frankel, N., Sanders, J., Rix, H.-W., Ting, Y.-S., & Ness, M. 2019, ApJ, 884, 99, doi: 10.3847/1538-4357/ab4254
- Frankel et al. (2020) Frankel, N., Sanders, J., Ting, Y.-S., & Rix, H.-W. 2020, ApJ, 896, 15, doi: 10.3847/1538-4357/ab910c
- Gaia Collaboration et al. (2016) Gaia Collaboration, Prusti, T., de Bruijne, J. H. J., et al. 2016, A&A, 595, A1, doi: 10.1051/0004-6361/201629272
- Gaia Collaboration et al. (2021a) Gaia Collaboration, Brown, A. G. A., Vallenari, A., et al. 2021a, A&A, 649, A1, doi: 10.1051/0004-6361/202039657
- Gaia Collaboration et al. (2021b) Gaia Collaboration, Luri, X., Chemin, L., et al. 2021b, A&A, 649, A7, doi: 10.1051/0004-6361/202039588
- Gallart et al. (2009) Gallart, C., Meschin, I., Aparicio, A., Stetson, P. B., & Hidalgo, S. L. 2009, in IAU Symposium, Vol. 256, The Magellanic System: Stars, Gas, and Galaxies, ed. J. T. Van Loon & J. M. Oliveira, 281–286, doi: 10.1017/S1743921308028585
- Garver et al. (2026, in preparation.) Garver, B., Nidever, D. L., & Debattista, V. 2026, in preparation.
- Garver et al. (2025, in preparation.) Garver, B., Nidever, D. L., Debattista, V., & Deg, N. 2025, in preparation.
- Garver et al. (2023) Garver, B. R., Nidever, D. L., Debattista, V. P., Beraldo e Silva, L., & Khachaturyants, T. 2023, ApJ, 953, 128, doi: 10.3847/1538-4357/acdfc6
- Girardi et al. (2002) Girardi, L., Bertelli, G., Bressan, A., et al. 2002, A&A, 391, 195, doi: 10.1051/0004-6361:20020612
- Harris et al. (2020) Harris, C. R., Millman, K. J., van der Walt, S. J., et al. 2020, Nature, 585, 357, doi: 10.1038/s41586-020-2649-2
- Hayden et al. (2015) Hayden, M. R., Bovy, J., Holtzman, J. A., et al. 2015, ApJ, 808, 132, doi: 10.1088/0004-637X/808/2/132
- Hunter (2007) Hunter, J. D. 2007, Computing In Science & Engineering, 9, 90, doi: 10.1109/MCSE.2007.55
- Lian et al. (2022) Lian, J., Zasowski, G., Hasselquist, S., et al. 2022, MNRAS, 511, 5639, doi: 10.1093/mnras/stac479
- Loebman et al. (2016) Loebman, S. R., Debattista, V. P., Nidever, D. L., et al. 2016, ApJ, 818, L6, doi: 10.3847/2041-8205/818/1/L6
- Lu et al. (2022a) Lu, Y., Buck, T., Minchev, I., & Ness, M. K. 2022a, MNRAS, 515, L34, doi: 10.1093/mnrasl/slac065
- Lu et al. (2024a) Lu, Y., Buck, T., Nidever, D., et al. 2024a, MNRAS, 532, 411, doi: 10.1093/mnras/stae1509
- Lu et al. (2022b) Lu, Y. L., Ness, M. K., Buck, T., & Carr, C. 2022b, MNRAS, 512, 4697, doi: 10.1093/mnras/stac780
- Lu et al. (2024b) Lu, Y. L., Minchev, I., Buck, T., et al. 2024b, MNRAS, 535, 392, doi: 10.1093/mnras/stae2364
- Marigo et al. (2017) Marigo, P., Girardi, L., Bressan, A., et al. 2017, ApJ, 835, 77, doi: 10.3847/1538-4357/835/1/77
- Massana et al. (2022) Massana, P., Ruiz-Lara, T., Noël, N. E. D., et al. 2022, MNRAS, 513, L40, doi: 10.1093/mnrasl/slac030
- Mazzi et al. (2021) Mazzi, A., Girardi, L., Zaggia, S., et al. 2021, MNRAS, 508, 245, doi: 10.1093/mnras/stab2399
- McKinney et al. (2010) McKinney, W., et al. 2010, in Proceedings of the 9th Python in Science Conference, Vol. 445, Austin, TX, 51–56
- Minchev et al. (2013) Minchev, I., Chiappini, C., & Martig, M. 2013, A&A, 558, A9, doi: 10.1051/0004-6361/201220189
- Minchev & Famaey (2010) Minchev, I., & Famaey, B. 2010, ApJ, 722, 112, doi: 10.1088/0004-637X/722/1/112
- Minchev et al. (2018) Minchev, I., Anders, F., Recio-Blanco, A., et al. 2018, MNRAS, 481, 1645, doi: 10.1093/mnras/sty2033
- Minchev et al. (2025) Minchev, I., Attard, K., Ratcliffe, B., et al. 2025, arXiv e-prints, arXiv:2508.18367, doi: 10.48550/arXiv.2508.18367
- Moreno et al. (2015) Moreno, J., Torrey, P., Ellison, S. L., et al. 2015, MNRAS, 448, 1107, doi: 10.1093/mnras/stv094
- Nidever et al. (2014) Nidever, D. L., Bovy, J., Bird, J. C., et al. 2014, ApJ, 796, 38, doi: 10.1088/0004-637X/796/1/38
- Nidever et al. (2017) Nidever, D. L., Olsen, K., Walker, A. R., et al. 2017, AJ, 154, 199, doi: 10.3847/1538-3881/aa8d1c
- Nidever et al. (2020) Nidever, D. L., Hasselquist, S., Hayes, C. R., et al. 2020, ApJ, 895, 88, doi: 10.3847/1538-4357/ab7305
- Nidever et al. (2021) Nidever, D. L., Olsen, K., Choi, Y., et al. 2021, AJ, 161, 74, doi: 10.3847/1538-3881/abceb7
- Nidever et al. (2024) Nidever, D. L., Gilbert, K., Tollerud, E., et al. 2024, in IAU Symposium, Vol. 377, Early Disk-Galaxy Formation from JWST to the Milky Way, ed. F. Tabatabaei, B. Barbuy, & Y.-S. Ting, 115–122, doi: 10.1017/S1743921323002016
- OpenAI (2025) OpenAI. 2025, ChatGPT (July 2025 version), https://chat.openai.com
- Pardy et al. (2018) Pardy, S. A., D’Onghia, E., & Fox, A. J. 2018, ApJ, 857, 101, doi: 10.3847/1538-4357/aab95b
- Povick et al. (2023) Povick, J. T., Nidever, D. L., Majewski, S. R., et al. 2023, arXiv e-prints, arXiv:2309.12503, doi: 10.48550/arXiv.2309.12503
- Povick et al. (2024) Povick, J. T., Nidever, D. L., Massana, P., et al. 2024, MNRAS, 533, 3685, doi: 10.1093/mnras/stae1949
- Price-Whelan et al. (2018) Price-Whelan, A. M., Sipőcz, B. M., Günther, H. M., et al. 2018, AJ, 156, 123, doi: 10.3847/1538-3881/aabc4f
- Quillen et al. (2009) Quillen, A. C., Minchev, I., Bland-Hawthorn, J., & Haywood, M. 2009, MNRAS, 397, 1599, doi: 10.1111/j.1365-2966.2009.15054.x
- Ratcliffe et al. (2024) Ratcliffe, B., Khoperskov, S., Minchev, I., et al. 2024, A&A, 690, A352, doi: 10.1051/0004-6361/202449268
- Ratcliffe et al. (2023) Ratcliffe, B., Minchev, I., Anders, F., et al. 2023, MNRAS, 525, 2208, doi: 10.1093/mnras/stad1573
- Ratcliffe et al. (2025) Ratcliffe, B., Khoperskov, S., Lee, N., et al. 2025, arXiv e-prints, arXiv:2509.02691, doi: 10.48550/arXiv.2509.02691
- Roškar et al. (2008) Roškar, R., Debattista, V. P., Stinson, G. S., et al. 2008, ApJ, 675, L65, doi: 10.1086/586734
- Rubele et al. (2018) Rubele, S., Pastorelli, G., Girardi, L., et al. 2018, MNRAS, 478, 5017, doi: 10.1093/mnras/sty1279
- Ruiz-Lara et al. (2020) Ruiz-Lara, T., Gallart, C., Monelli, M., et al. 2020, A&A, 639, L3, doi: 10.1051/0004-6361/202038392
- Sahlholdt et al. (2022) Sahlholdt, C. L., Feltzing, S., & Feuillet, D. K. 2022, MNRAS, 510, 4669, doi: 10.1093/mnras/stab3681
- Salaris et al. (1993) Salaris, M., Chieffi, A., & Straniero, O. 1993, ApJ, 414, 580, doi: 10.1086/173105
- Saroon et al. (2025) Saroon, S., Dias, B., Tsujimotto, T., et al. 2025, arXiv e-prints, arXiv:2507.16146. https://arxiv.org/abs/2507.16146
- Sellwood & Binney (2002) Sellwood, J. A., & Binney, J. J. 2002, MNRAS, 336, 785, doi: 10.1046/j.1365-8711.2002.05806.x
- Sharma et al. (2020) Sharma, S., Hayden, M. R., Bland-Hawthorn, J., et al. 2020, arXiv e-prints, arXiv:2011.13818. https://arxiv.org/abs/2011.13818
- Shipp et al. (2021) Shipp, N., Erkal, D., Drlica-Wagner, A., et al. 2021, ApJ, 923, 149, doi: 10.3847/1538-4357/ac2e93
- Skrutskie et al. (2006) Skrutskie, M. F., Cutri, R. M., Stiening, R., et al. 2006, AJ, 131, 1163, doi: 10.1086/498708
- Spitoni et al. (2021) Spitoni, E., Verma, K., Silva Aguirre, V., et al. 2021, A&A, 647, A73, doi: 10.1051/0004-6361/202039864
- Torrey et al. (2012) Torrey, P., Cox, T. J., Kewley, L., & Hernquist, L. 2012, ApJ, 746, 108, doi: 10.1088/0004-637X/746/1/108
- Vasiliev (2024) Vasiliev, E. 2024, MNRAS, 527, 437, doi: 10.1093/mnras/stad2612
- Wadsley et al. (2017) Wadsley, J. W., Keller, B. W., & Quinn, T. R. 2017, MNRAS, 471, 2357, doi: 10.1093/mnras/stx1643
- Wadsley et al. (2004) Wadsley, J. W., Stadel, J., & Quinn, T. 2004, New A, 9, 137, doi: 10.1016/j.newast.2003.08.004
- Wang et al. (2015) Wang, L., Dutton, A. A., Stinson, G. S., et al. 2015, MNRAS, 454, 83, doi: 10.1093/mnras/stv1937
- Wilson et al. (2019) Wilson, J. C., Hearty, F. R., Skrutskie, M. F., et al. 2019, PASP, 131, 055001, doi: 10.1088/1538-3873/ab0075
- Zhang et al. (2025) Zhang, H., Belokurov, V., Evans, N. W., et al. 2025, ApJ, 983, L10, doi: 10.3847/2041-8213/adc261