Ultraluminous X-ray sources in the group-centric elliptical galaxy NGC 5813
Abstract
The number of Ultraluminous X-ray Sources (ULXs) is observed to be correlated with the current star formation rate in late-type galaxies and with the stellar mass in early-type galaxies (ETGs). Since there is very little gas, dust or star formation in ETGs, it has been suggested that most of the ULXs associated with them could be high luminosity Low Mass X-ray Binaries (LMXBs) or foreground/background sources. It has been reported that NGC 5813, the central dominant (cD) galaxy in the NGC 5846 group of galaxies, which shows signs of a possible recent merger event, has an unusually high number of ULXs. We have undertaken a multi-epoch spectral study of the persistent ULXs in the galaxy using Chandra and XMM-Newton observations. Of the eight ULXs reported elsewhere, four have been re-identified, two are not consistently detected across all nine Chandra observations, and two are found to be foreground sources. One new persistent ULX has been identified. We present a spectral analysis of the five ULXs with luminosity consistently greater than erg/s in nine Chandra-ACIS observations, and assess their variability, adding data from XMM-Newton. The association of these ULXs with globular clusters was examined: we find one ULX lying within the field of an HST observation within 0.1′ of the centre of a globular cluster. Optical and UV counterparts are found for another ULX. One of the ULXs is found to be variable over the time scale of days, but there is no unambiguous evidence of longer-term variability for the remaining ULXs.
keywords:
X-rays: binaries – X-rays: diffuse background – galaxies: elliptical and lenticular, cD1 Introduction
Ultraluminous X-ray sources (ULXs) are extragalactic non-nuclear point-like sources whose X-ray luminosity is intermediate between the Eddington limit of accreting stellar mass black holes and supermassive black holes. They have been proposed to host neutron stars or stellar-mass black holes, accreting at super-Eddington rates (with a not negligible geometrical beaming) or as Intermediate Mass Black Holes (IMBHs) accreting at sub-Eddington rates (e.g. Feng & Soria, 2011; Kaaret, Feng, & Roberts, 2017; King, Lasota, & Middleton, 2023).
There are persistent as well as transient ULXs. Persistent ULXs have luminosities above 1039 erg/s in all observations, but transient ULXs overpass this luminosity only for limited periods, the estimated recurrence time varying from a few days to a few years (e.g. Strickland et al., 2001; Kong & Di Stefano, 2005; van Haaften et al., 2019; Salvaggio et al., 2022; Brightman et al., 2023). A number of ULXs showing coherent pulsations, and therefore hosting without a doubt a neutron star as the compact object, have been discovered; these are known as ULX Pulsars or Pulsating ULXs (PULXs) (Bachetti et al., 2014; Fürst et al., 2016; Israel et al., 2017a, b; Carpano et al., 2018; Sathyaprakash et al., 2019; Rodríguez Castillo et al., 2020). A number of candidate Neutron Star (NS) ULXs have also been discovered; however, pulsations have not been confirmed in some of them (e.g. Pintore et al., 2017; Koliopanos et al., 2017; Walton et al., 2018; Maitra et al., 2019; Gúrpide et al., 2021; Amato et al., 2023).
ULXs were initially detected in late-type galaxies and their numbers were found to be correlated with the star formation rate (SFR) (e.g. Gilfanov, Grimm, & Sunyaev, 2004) of the galaxy. Subsequent studies (e.g. Mineo et al., 2013), have explored the correlation between the location of the ULX in a galaxy and the local SFR determined using GALEX FUV and Spitzer 24m data. Although ULXs were thought to be rare in early-type galaxies (ETGs), as ellipticals have comparatively lower SFR than late-type galaxies, it became obvious that there are significant ULX populations in ETGs as well (e.g. Raychaudhury et al., 2008). Some of them were associated with the globular clusters (GCs) of the galaxy (Angelini, Loewenstein, & Mushotzky, 2001). Dage et al. (2021) have identified 20 ULXs associated with GCs in ETGs within 20 Mpc. Thygesen et al. (2023) has identified nine additional ULXs associated with GCs in ETGs within a distance of 70 Mpc. Since the SFR in elliptical galaxies is expected to be quite low, it is possible that ULXs associated with them are Low Mass X-Ray Binaries (LMXBs) (King, Schenker, & Hameury, 2002). The number of ULXs in a galaxy is seen to be anti-correlated with the metallicity of the galaxy (e.g. Mapelli, Colpi, & Zampieri, 2009). In the case of ETGs, there is a nonlinear dependence on the stellar mass of the galaxy (Kovlakas et al., 2020).
A stellar-mass compact object accreting at super-Eddington accretion rates is likely to have a thick accretion disk and violent winds can be driven from inner regions (Shakura & Sunyaev, 1973; Poutanen et al., 2007). In general, ULX spectra can be fitted with two thermal components, a soft one and a hard one (Stobbart, Roberts & Wilms, 2006; Pintore et al., 2015; Pinto et al., 2021; Gúrpide et al., 2021; Amato et al., 2023), with an additional non-thermal component (Walton et al., 2018) when high quality NuSTAR observations are available (>10.0 keV). The soft emission originates in the wind and the hard emission from the inner, distorted disk. A quasi-thermal, multicolour disk blackbody is used to account for emission from the wind and a thermally Comptonized continuum to describe the emission from the inner disk and its down-scattered component (e.g. Middleton et al., 2015). The hard non-thermal component is due to the inverse compton scattering of disk photons by hot electrons in the Comptonizing corona (hybrid corona) of BH ULXs (Gladstone, Roberts, & Done, 2009) or the accretion column in NS ULXs (Walton et al., 2018). Sutton, Roberts & Middleton (2013) identified three different spectral states of ULXs, which can be named as "broadened disc", characterised by a broad thermal component and expected to be found at (or slightly above) the Eddington rate, "hard ultraluminous" which shows a two-component spectrum, with the hard one dominating the emission, and accretion is expected to be significantly above Eddington, and a third state "soft ultraluminous" with the highest accretion rate and emission peaking at the softer end of the 0.3–10.0 keV range. It should be noted that the spectral appearance can be driven by the inclination angle of the systems with respect to our line of sight (Middleton et al., 2015).
In the initial, short-exposure XMM Newton and Chandra observations of ULXs, two-component models with a thermal component and a non-thermal component (an accretion disk with a powerlaw and a blackbody with a powerlaw component) were often used to describe the spectra (e.g. Miller et al., 2003; Cropper et al., 2004). For low-quality ULX spectra, single-component models like multi-colour disk black body (MCD) or powerlaw models yield good fits (Roberts et al., 2004; Burke et al., 2013a, b; Jithesh et al., 2014).
ULX spectra can vary with time. Spectral variability of ULXs whose spectra are well fitted with an absorbed powerlaw model, can be explored further by studying the correlation between and luminosity and, the correlation between inner disk temperature and disk luminosity may be examined in the case of ULXs whose spectra are well fitted by an absorbed disk black body (e.g. Kajava & Poutanen, 2009; Kaaret & Feng, 2009). For some of the ULXs, the correlation between and luminosity is positive and for some it is negative. ULXs that become spectrally harder when they are in a brighter state have been found earlier (Roberts et al., 2006; Feng & Kaaret, 2009; Gúrpide et al., 2021). Ghosh & Rana (2022) also have found an anti-correlation between and luminosity for NGC 1042 ULX–1 (a stellar mass super-Eddington accretor). Kajava & Poutanen (2009) have found four ULXs whose spectra can be fitted by a MCD model, showing a positive correlation between luminosity and disk temperature (same as Galactic Black Hole Binaries), with the luminosity-temperature diagram of the soft excess from the powerlaw plus MCD model fits following roughly a relation. Gúrpide et al. (2021) have investigated, the correlation between the bolometric luminosity of the cool disc component and its temperature, for five ULXs from different galaxies, and observed a positive correlation ; values range from 1.27 to 3.55. However, Miller et al. (2013) has obtained results which support a behaviour which indicates a Standard Shakura-Sunyaev Disk (assuming a constant inner radius) which radiates efficiently and the accretion is sub-Eddington (Shakura & Sunyaev, 1973). Watarai, Mizuno, & Mineshige (2001) introduced a slim disk model which provides a more self-consistent explanation for the spectral and temporal properties of ULXs in the super-Eddington accretion regime. When the accretion rate exceeds a critical value, advection becomes significant, and energy is transported inward rather than radiated away locally. In the slim disk, the effective inner radius can appear larger or change with accretion rate, which affects how L varies with T (Straub, Done, & Middleton, 2013). Super-Eddington accretion can drive massive, optically thick winds from the disk. These winds can either obscure the inner disk or truncate the disk resulting in flattening or breaking of the L - T relation (Koliopanos et al., 2017; Barra et al., 2022). NS-ULXs, exhibit distinct behaviors compared to BH ULXs due to their solid surfaces, strong magnetic fields (e.g. Israel et al., 2017a), and boundary layer dynamics (e.g. Bachetti et al., 2014). These factors alter the accretion geometry, radiative efficiency, and spectral properties, leading to deviations in the disk temperature–luminosity relation.
1.1 The ULXs in NGC 5813
NGC 5813 is a central dominant (cD) giant elliptical galaxy with regular morphology, Mpc away (Tully et al., 2013) from us. It is a member of the NGC 5846 group in the Virgo supercluster. It shows evidence for a multiphase interstellar medium (ISM) with significant emission in cooling lines, H alpha, and X rays (Werner et al., 2014). The galaxy harbours a kinematically distinct core (KDC) (Emsellem et al., 2004; Krajnović et al., 2015), and hosts both red and blue GC populations (Hempel et al., 2007).
In the Chandra ACIS observations of the galaxy, within the diffuse X-ray emission, three pairs of nearly collinear cavities at 1 kpc, 8 kpc, and 20 kpc from the central source are visible (Randall et al., 2011, 2015). Two population studies of X-ray point sources have reported ULXs in NGC 5813. Liu J. (2011), in a Chandra ACIS survey of X-ray point sources in 383 nearby galaxies, identified 8 ULXs in NGC 5813; five ULXs within the D25 isophote and three in the area between the D25 and 2D25 isophotes (with the threshold luminosity for ULXs taken as erg/s (0.3 - 8.0 keV)). The five ULXs within the D25 isophote were re-identified by Wang et al. (2016); those with luminosity greater than or equal to erg/s (0.3–8.0 keV) were considered. These detections were based on a single Chandra observation with obs id 5907 (see table 2). With more deep Chandra observations as well as XMM-Newton observations of NGC 5813 at multiple epochs now available, there is good scope for a more detailed spectral and variability study of the ULXs of NGC 5813.
| Source | RA | DEC | Distance from | Remark |
| h:m:s | d:m:s | the centre (arcmin) | ||
| CXOJ150110.877+014142.65 (S7) | 15:01:10.8814 | +1:41:42.823 | 0.430 | re-identified∗ |
| CXOJ150116.555+014133.97 (S5) | 15:01:16.5601 | +1:41:34.072 | 1.453 | re-identified∗ |
| CXOJ150104.927+014136.02 (S6) | 15:01:04.9112 | +1:41:36.138 | 1.656 | re-identified∗ |
| CXOJ150105.592+014330.76 (S24) | 15:01:05.5885 | +1:43:30.824 | 1.967 | re-identified∗ |
| CXOJ150101.11+014119.80 (S4) | 15:01:01.1100 | +1:41:19.802 | 2.649 | newly identified |
2 Data Preparation and Analysis
Chandra observations of NGC 5813 were used to identify the ULXs. Data, from nine Chandra Advanced CCD Imaging Spectrometer (ACIS) pointed observations of NGC 5813, were analyzed to identify the ULXs in the galaxy (details of the data are given in Table 2). Chandra has very good spatial resolution in the 0.3–10.0 keV energy band, which makes Chandra the best instrument to study ULXs in NGC 5813 (because of its distance). CIAO 4.10 was used for data processing. All the Chandra observations were reprocessed using Chandra repro script. Background light curves were produced by the dmextract tool, and background flares were removed using the thread available at http://cxc.harvard.edu/ciao/threads/acisbackground. Point sources were identified by the wavdetect tool with scales from 1 to 16 in steps of , detection threshold sigthresh = , on the cleaned event file of each of the observations. The flux in the 0.3 – 8.0 keV band, from each of these sources, was estimated by fitting an absorbed powerlaw model using the CIAO srcflux tool.
2.1 Sample Selection
Altogether, 132 X-ray point sources, from the nine Chandra observations, have been detected within the 2D25 ellipse of NGC 5813. For the distance of NGC 5813, a flux of erg/cm2/s corresponds to erg/s. Sources, detected in all nine Chandra observations, and having average luminosity greater than or equal to erg/s, were identified first. There are eleven such sources after removing the known foreground and background sources. The sample for the present study was then identified as follows. The spectra of these eleven sources were extracted from the nine Chandra observations, in order to identify the persistent ULXs. Five sources, all of which have luminosity above erg/s in all the nine Chandra observations for all three models used, were identified and constitute the sample for the present study (See §2.2 for details). There were a few sources with luminosity above erg/s for at least one of the nine observations, but not all. Such candidate transient ULXs will be studied in a later paper.
| Obs Id | Detector | Date | Cleaned Exposure |
| Time (ks) | |||
| 5907 | ACIS-S | 2005 April 2 | 48.4 |
| 9517 | ACIS-S | 2008 Jun 5 | 98.8 |
| 12951 | ACIS-S | 2011 March 28 | 72.9 |
| 12952 | ACIS-S | 2011 April 5 | 142.8 |
| 12953 | ACIS-S | 2011 April 7 | 31.7 |
| 13246 | ACIS-S | 2011 March 30 | 45.0 |
| 13247 | ACIS-S | 2011 March 31 | 35.5 |
| 13253 | ACIS-S | 2011 April 8 | 118.0 |
| 13255 | ACIS-S | 2011 April 10 | 43.4 |
2.2 Chandra Data: Spectral Analysis
Cleaned event files of all the Chandra observations listed in Table 2 were used to extract spectra. The diffuse emission present in the galaxy is not spatially uniform; also, there are three pairs of cavities in them. It is necessary therefore to characterize the diffuse emission around each source first, as the emission from the ULX arrives combined with this diffuse emission. The extraction of the spectra is done using the CIAO tool specextract, and modelling and fitting is performed using XSPEC version 12.12.0.
2.2.1 The Diffuse Emission
For each point source, the spectrum of the diffuse emission was extracted, using the flux from an annular region around it with inner radius r7 and outer radius 2 r7, where r7 is the radius of a circle that includes 90 percent of the source flux at 7.0 keV at the position of the source. The background spectrum is extracted from four circular regions (radius = r7) randomly selected outside the 2D25 region of the galaxy but on the same CCD as the galaxy. For the innermost source S5, the diffuse emission spectrum in each observation could be modelled on its own. For the other sources, the surrounding diffuse emission did not have sufficient counts for individual modelling, so the spectrum obtained by stacking the diffuse emission spectra from all the nine observations was used to model the diffuse emission. We used the CIAO tool "combine-spectra", which sums multiple PHA spectra, for this. This task also combines the associated background PHA spectra and source and background ancillary (ARF) and response (RMF) files.
The diffuse emission spectra were fitted in the 0.3 – 3.0 keV band with the Tbabs*Apec model111Apec is an emission spectrum model from collisionally-ionized diffuse gas (https://heasarc.gsfc.nasa.gov/xanadu/xspec/manual/XSmodelApec.html) and Tbabs is the Tuebingen-Boulder ISM absorption model (https://heasarc.gsfc.nasa.gov/xanadu/xspec/manual/node268.html). The value of the absorption column density (nH) is fixed to the Galactic value (nH = 4.37 1020 cm; Kalberla, et al. (2005)). Abundance and plasma temperature values are obtained from the abundance and plasma temperature maps from Randall et al. (2015) and redshift = 0.00653 (Cappellari, et al., 2011). These parameters were fixed and the normalisation parameter of Apec was allowed to vary. The best-fit value of the Apec normalisation for the diffuse emission around each source is given in Table 3.
| Source | Abundance | Plasma Temperature | Normalisation |
| (kT in keV) | ( 10 -6) | ||
| (Literaturea) | (Literaturea) | (Estimated) | |
| CXOJ150110.877+014142.65 (S7) | 0.36 | 0.57 | b7.41 |
| CXOJ150116.555+014133.97 (S5) | 0.5 | 0.66 | 1.16 |
| CXOJ150104.927+014136.02 (S6) | 0.5 | 0.76 | 0.66 |
| CXOJ150105.592+014330.76 (S24) | 0.58 | 0.76 | 0.33 |
| CXOJ150101.10+014119.89 (S4) | 0.47 | 0.76 | 0.38 |
.
2.2.2 The ULXs
Energy spectra of the candidate ULXs were extracted from all the observations. Source regions were demarcated by circles with radius r7 in general. For sources which are very close to each other, circles of radius r2 (radius of a circle that includes 90 percent of the source flux at 2.0 keV at the position of the source) were used to avoid overlapping of the source regions. As mentioned above, background spectra were extracted from circular regions (radius = r7) randomly selected outside the 2D25 region of the galaxy but on the same CCD as the galaxy. The spectra of the candidate ULXs were fitted with models such as:
Model 1 : Tbabs (Apec+powerlaw)
Model 2 : Tbabs (Apec+bbody)
Model 3 : Tbabs (Apec+diskbb).
The parameters of the Apec model are frozen at the values given in Table 3. The absorption column density nH is frozen at Galactic absorption as mentioned in §2.2.1. After this, more complex models, like :
Tbabs (Apec+bbody+powerlaw)
Tbabs (Apec+diskbb+powerlaw)
Tbabs (Apec+bbody+diskbb)
Tbabs (Apec+diskbb+diskbb)
were fitted to the spectra of the ULXs.
| Source | Obs Id | L (10+39erg/s) | Parameter | |||||||
| Model 1 | Model 2 | Model 3 | Model 1 | Model 2 | Model 3 | kT (keV) | Tin (keV) | |||
| S7 | 5907 | 4.65/7 | 9.76/7 | 5.66/7 | 3.02 | 2.13 | 2.62 | 1.30 | 0.86 | 1.99 |
| S7 | 9517 | 17.63/12 | 37.84/12 | 25.32/12 | 2.91 | - | - | 1.80 | - | - |
| S7 | 12951 | 6.30/8 | 12.63/8 | 8.48/8 | 3.71 | 1.80 | 2.26 | 2.16 | 0.37 | 0.59 |
| S7 | 12952 | 23.80/21 | 86.91/21 | 52.38/21 | 4.16 | - | - | 2.07 | - | - |
| S7 | 12953 | 6.76/7 | 21.58/7 | 14.00/7 | 5.69 | - | 3.45 | 2.30 | - | 0.64 |
2.2.3 Luminosity Calculation
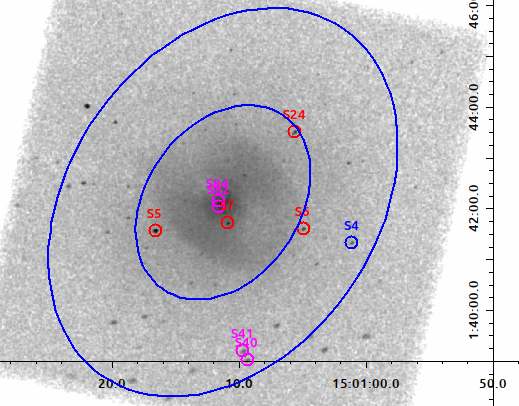
The unabsorbed flux in the 0.3–8.0 keV band was estimated for each ULX using the cflux model. Table 4 gives the parameters of Model 1, Model 2, and Model 3, fitted to the spectra of each of the sources for the nine Chandra observations, along with the luminosity of each source. Sources S4, S5, S6, S7, and S24 have luminosity above 1039 erg/s in all nine Chandra observations for all three models. Hence, they are classified as persistent ULXs. We set this criterion because unabsorbed luminosities from powerlaw model are often overestimated since at lower energies, powerlaw does not have a cut-off. Liu J. (2011) identified eight candidate ULXs with luminosity above 21039 erg/s (0.3–8.0 keV) in the 2005 Chandra ACIS observation of NGC 5813; four of them, S5, S6, S7 and S24, are re-identified as persistent ULXs in this study. Two sources, CXOJ150111.491+014202.74 (S82) and CXOJ150111.645+014207.42 (S84), are not detected consistently in all the nine Chandra observations. The remaining two, CXOJ150109.329+013900.72 (S40) and CXOJ150109.660+013911.63 (S41), were identified as eclipsing binaries (Khrutskaya, Khovritchev, & Bronnikova, 2004) and are foreground sources. S4, is here newly identified as a persistent ULX (Figure 1).
| Obs Id | Instrument and | Date | Live time for |
| Filter | the central CCD (for EPN) | ||
| 0302460101 | EPIC, Medium | 23/07/2005 | 21.06 ks |
| 0554680201 | EPIC, Thin | 11/02/2009 | 38.75 ks |
| 0554680301 | EPIC, Thin | 17/02/2009 | 35.28 ks |
2.3 XMM-Newton Data: Analysis
Archival data from three XMM-EPIC observations of NGC 5813 were included in our study (details are given in Table 5), to obtain the state of the candidate ULXs during three additional time epochs. Data analysis was carried out using the software SAS version 21.0.0. In each case, the observation data file (ODF) was downloaded and the data reprocessed using epproc and emproc commands for EPIC-pn and EPIC-mos instruments, respectively. The EPIC event list was filtered for periods of high background flaring activity 333(https://www.cosmos.esa.int/web/xmm-newton/sas-thread-epic-filterbackground-in-python). A Good Time Interval (GTI) file, where the background count rate is low and steady above 10.0 keV for EMOS, and between 10.0 and 12.0 keV for EPN, was then created. The live time for the central CCD is obtained from the cleaned event file. The SAS source detection script edetect chain was used to simultaneously search for sources in 5 images extracted in the 0.2-0.5 keV, 0.5-1 keV, 1-2 keV, 2-4.5 keV, 4.5-12 keV energy bands. This detection chain was separately run for each of the 3 EPIC cameras444(https://www.cosmos.esa.int/web/xmm-newton/sas-thread-src-find).
We could not detect the source S7 in the XMM-Newton observations 0302460101 and 0554680201. This is probably because S7 is just away from the centre of the galaxy, that is, inside the point spread function (PSF) of the central source of NGC 5813. We could detect S7 in the 0554680301 MOS2 observation, but none of the three spectral models gave a good fit, probably because of heavy contamination from the central source. The source S5 is detected in all observations. S6 is detected in all observations except 0554680201 EPN and 0554680201 EPN where S6 falls in a chip gap. S24 is detected in all observations except 0302460101 EPN, where it falls in a chip gap. Also, in Chandra observations of S24, we can see a nearby bright X-ray point source, which is resolved in Chandra observations but cannot be resolved in XMM-Newton observations. So, we have not included the spectral analysis of XMM-Newton observations of S24 either (Fig. 5) in this study. We could detect S4 in the 0554680301 MOS2 observation only. There is a possibility that this source may be a transient. But, since the PSF of XMM-Newton is comparatively larger and the exposure times of these XMM-Newton observations are short, it is also possible that this source may just not be bright enough to be detected in these observations. In fact, of the remaining six out of the eleven sources selected at stage one of the selection process (§2.1), five are not detected in any of the XMM-Newton observations. The spectral analysis of sources S5, S6 and S4 were done for the observations in which these sources were detected.
2.3.1 Spectral Analysis: The Diffuse Emission
To study the diffuse emission, we extracted spectra of the emission around the ULXs using annular regions of inner radius times and outer radius two times the radius of the region from which the ULX spectrum is extracted: 25.98′′ and 33′′ respectively. When there is a source adjacent to the ULX, a circular region close to the ULX region (the cavities present were avoided), of the same radius as the ULX region and also at the same distance from the centre of the galaxy was used to study the diffuse emission. The source and background region areas used to make the spectral files were calculated using backscale555(https://www.cosmos.esa.int/web/xmm-newton/sas-thread-mos-spectrum). Rmfgen and arfgen were run to create the redistribution matrix and the ancillary file, respectively. To link the spectrum and associated files and to rebin the spectra, the task specgroup was used. The spectrum was rebinned such that there are at least 25 counts for each spectral channel666(https://www.cosmos.esa.int/web/xmm-newton/sas-thread-mos-spectrum). The spectral analysis of diffuse emission is performed as described in §2.2.1, except that we model the spectrum diffuse emission around each ULX separately for each observation and each instrument. Also the plasma temperature parameter and the Apec normalisation for the diffuse emission are allowed to vary, but abundance is fixed to the area averaged value obtained from abundance map of NGC 5813 from Randall et al. (2015).
2.3.2 Spectral Analysis: The ULXs
The spectra of the candidate ULXs were extracted from circular regions of 16.5′′ radius. The background spectra were obtained from circular regions of 32′′ radius in a source-free region on the same CCD as the source region. The ULX spectra were fitted with three different models as outlined in Table 6, with parameters nH, and redshift values the same as mentioned in §2.2.1. Since the source regions and the diffuse emission regions are larger in size for XMM-Newton observations than for Chandra observations, the plasma temperature and abundance parameter values have wider variation across the selected regions, and area averaged values, determined using the plasma temperature and abundance maps of NGC 5813 (Randall et al., 2015), were taken. For the diffuse component, the Apec normalisation is fixed to the value obtained from the diffuse emission fit described above.
In the case of S6, it is seen that the value of the photon index obtained from the powerlaw fit in XMM-Newton observations is higher than the values obtained from Chandra observations; the error bars overlap for some of the observations. In the case of black body temperature, the values obtained are lower compared to Chandra observations; here also, not all error bars overlap. For this source, none of the models tried, including complex models, gave a good fit for 0302460101 (PN) and 0554680301 (MOS) observations. In the case of S5, the black body temperature values obtained are higher than those obtained from the analysis of Chandra data; the error bars mostly overlap. The photon index values obtained are within errors the same. For source S4 only one model yielded a good fit with XMM-Newton data. The value obtained for the black body temperature is lower compared to the results from Chandra observations and it is outside the error bars. For details see Table 6.
| Source | Obs Id | Apec norm | L (10+39erg/s) | Parameter | |||||||
| (10-5) | Model 1 | Model 2 | Model 3 | Model 1 | Model 2 | Model 3 | kT (keV) | Tin (keV) | |||
| S5 | 101(MOS) | 4.53 | 31.68/36 | 56.03/36 | 42.00/36 | 12.32 | 6.71 | 7.82 | 2.09 | 0.28 | 0.50 |
| S5 | 101(PN) | 3.41 | 65.32/26 | 86.74/26 | 79.58/26 | - | - | - | - | - | - |
| S5 | 201(MOS) | 4.42 | 105.78/68 | 237.36/68 | 185.21/68 | 12.37 | - | - | 2.15 | - | - |
| S5 | 201(PN) | 4.25 | 56.03/40 | 165.54/40 | 124.73/40 | 12.99 | - | - | 2.14 | - | - |
| S5 | 301(MOS) | 3.65 | 141.60/65 | 178.17/65 | 168.74/65 | - | - | - | - | - | - |
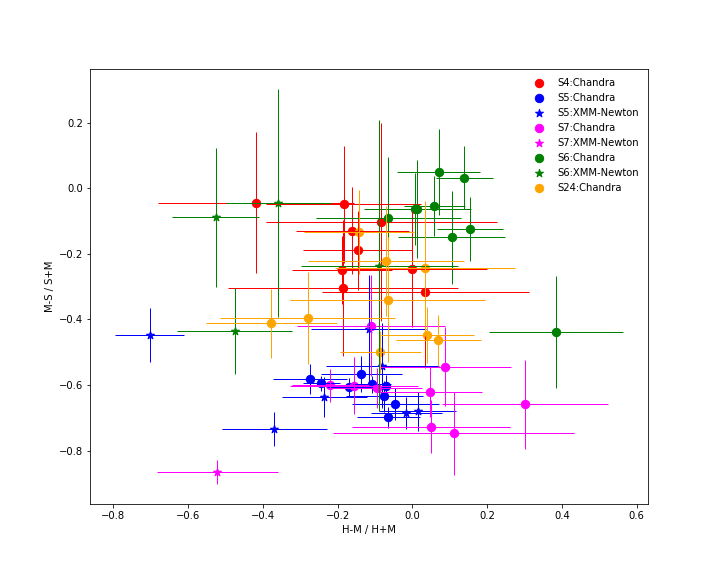
2.4 X-ray Colour-Colour Diagram
X-ray colours provide information about the spectral state of the sources. To calculate colors, photon counts were obtained for each candidate ULX for three energy bands, 0.5 keV – 1.7 keV (Soft), 1.7 keV – 2.8 keV (Medium), and 2.8 keV – 8.0 keV (Hard), denoted as S, M and H respectively (Albacete Colombo et al., 2007). X-ray colours, C1 = (M-S)/(M+S) and C2 = (H-M)/(H+M), and the errors on the colours were estimated (Park et al., 2006). For each source, for each observation (and for each detector separately for XMM-Newton observations), the diffuse emission and the background emission were determined (for details please see §2.2.1 for Chandra observations, and §2.3.1 for XMM-Newton observations), and subtracted from the emission from the source region. The sources S4, S5 and S6 had zero photon counts in M and H bands for observations 0554680301 MOS2, 0302460101 MOS1 and 0554680301 MOS2 respectively. Also, The source S5 had zero counts in H band for 0302460101 MOS2 and source S6 had zero counts in H band for 0302460101 MOS1, 0302460101 MOS2 and 0554680201 MOS2. So, these observations were not included in this analysis. The Colour-Colour diagram is plotted with C1 on Y-axis and C2 on X-axis (Figure 4).
In the Colour-Colour diagram, the relative positions of the sources are seen to follow a trend. Mean value of C1 is comparatively high, for S6 (-0.08), and S4 (-0.18), which are best fitted with Tbabs*(Apec+Bbody) model; their state is determined as ’broadened disc’. Mean value of C1 is comparatively low, for S5 (-0.61), and S7 (-0.64), for which the best fit model includes a powerlaw component; their state is determined as ’hard-ultraluminous’. For details regarding the determination of the states of the sources please see §2.9. In the case of S6, the value of C1 is low for 2009 XMM-Newton observation with obsid 0554680301(MOS2), for which none of the three basic models gives a best fit even though the total count is not low. Again, for S6, the value of C1 obtained is low for 2011 Chandra observation with obsid 13247; the best fit model includes a powerlaw for this observation alone. It was not possible to fit Tbabs*(Apec+Diskbb+Powerlaw) model to examine whether the state of the source had also suffered a change or not, since the number of counts is not enough. For source S24, the best fit model is Tbabs*(Apec+Bbody), and the mean value of C1 is -0.35; the state of the source has been determined as ’broadened disc’.
2.5 Intra-observational Variability
To assess the intra-observational variability of the candidate ULXs, the Gregory-Loredo algorithm (Gregory & Loredo, 1992) implemented as the CIAO tool glvary was used. It splits the events into multiple time bins and looks for significant deviations between bins. The tool assigns a variability index based on the total odds ratio, the corresponding probability of a variable signal, and the fractions of the lightcurve within 3 and 5 of the average count rate. The Gregory-Loredo variability algorithm provides the probability that the calculated flux from the source region is not constant throughout the observation. The algorithm determines variability based on an odds ratio for the inter-arrival times of the photons within the source region being not uniformly distributed in time for each energy band. The appropriate sampling distribution for data from X-ray detectors, some or all of which may be attributed to background events, is the Poisson distribution (Gregory & Loredo, 1992). The variability index obtained was less than or equal to two, for all the candidate ULXs, in all the Chandra observations as well as in the XMM-Newton observations. Hence, none of the candidate ULXs may be considered as variable within the time period of each of the observations as per the interpretation of the Gregory-Loredo variability index. A source is considered to be variable if the variability index is five or above.
2.6 Inter-observational Variability
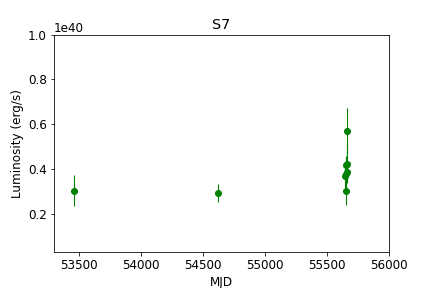
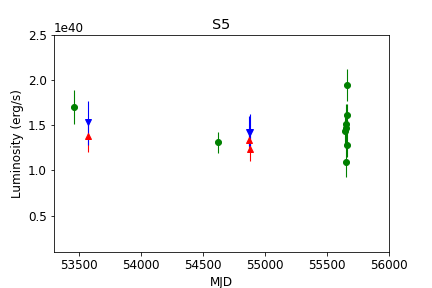
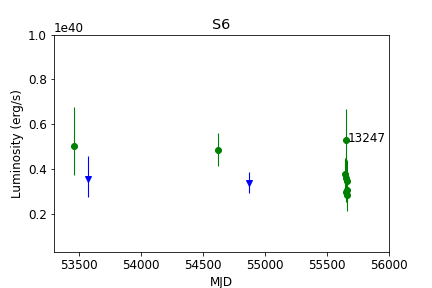
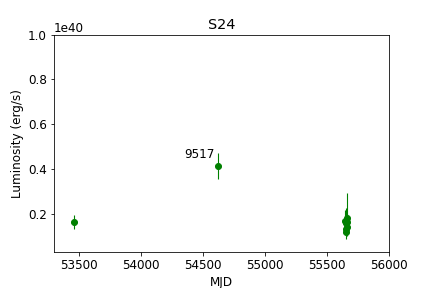
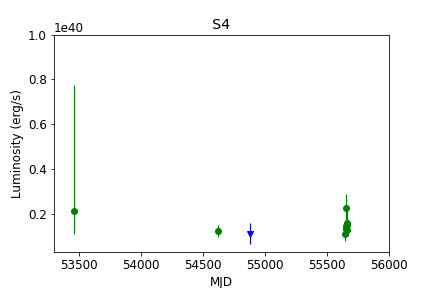
The lightcurves of the candidate ULXs, extracted from Chandra and XMM-Newton observations, are given in Figure 5. To explore the inter-observational variability of the ULXs, the unabsorbed flux (0.3 - 8.0 keV) from the spectrum of each source for each of Chandra and XMM-Newton observations was used. The fractional variability was calculated using the formula :
where S2 is the variance of flux values, is the mean square of errors on flux values, and is the mean of the flux values (Vaughan et al., 2003). The error on the fractional variability was also estimated using the formula given by Edelson et al. (2002). The errors on the estimated are at 68%. We first obtained the fractional variability of the sources, between the seven observations made from 28 March 2011 to 10 April 2011 (seven Chandra observations). For sources S4, S6, and S24, the variance of flux values was smaller than the mean square of errors on the flux values and thus the fractional variability over the time scale of days for these sources could not be ascertained. For S5, the fractional variability over the time scale of days is estimated to be 15.1 and for S7 it is 10.8 which is compatible with absence of variability.
Then we estimated the fractional variability over the time scale of years. We have Chandra observations from 2005, 2008 and 2011 and XMM-Newton observations from 2005 and 2009. There are multiple observations available from 2005, 2009 and 2011 and, for these years, only the data from the longest observation was used for the analysis. For S7, the estimated value of Fvar is 14.4%, for S6 it is 12.5%, for S24 it is 62.0%, and for S5 it is 9.4%. We could not estimate the value for S4 because the variance of flux values was smaller than the mean square of errors on the flux values.
2.7 Luminosity - Correlation
Kajava & Poutanen (2009) and Kaaret & Feng (2009) investigated the relationship between luminosity and photon index (), for ULXs whose spectra are well fitted with an absorbed powerlaw model. ULXs that hardened at high luminosities and those that softened at high luminosities have both been discovered. The relation between and luminosity can give insights into the nature of the source. Here, photon indices and luminosities of the ULXs, at various time epochs are determined. All of the ULXs are well fitted with Model 1 except S24 for the 5907 Chandra observation and S4 for the 0554680301 XMM-Newton EPIC-MOS observation. For S5, we used Tbabs*(Apec+Bbody+Powerlaw) model to get the luminosity and photon index. Kendall’s rank correlation coefficient777(https://www.gigacalculator.com/calculators/correlation-coefficient-calculator.php) was estimated for each source (Table 8). Except S4, no other sources show any significant correlation. For S4, Kendall’s correlation coefficient is 0.50 (p-value = 0.03). This suggests that ULX S4 hardened at high luminosities. For other sources the correlation is not statistically significant. The luminosity and values have rather significant error bars. Deeper observations and more detailed analyses are needed in order to draw significant inferences.
2.8 - Correlation
For the ULXs S4, S6, S7 and S24, Model 3 was fitted to the data to explore the correlation between the luminosity from the disk (LSoft) and the inner disk temperature (kTin). Here, LSoft is obtained as the unabsorbed luminosity estimated from the Diskbb component for the energy range 0.3 - 8.0 keV. Since S5 cannot be fitted well with Model 3, parameters obtained by fitting the Tbabs*(Apec+Diskbb+Powerlaw) model to its spectra was used. Other than in the case of S24, no significant correlation is noted for these ULXs. For S24, Kendall’s correlation coefficient is 0.54 (p-value = 0.02). However, since, the error bars for kTin and LSoft are large for most of the observations, no conclusions may be drawn regarding the correlation between inner disc temperature and luminosity of S24 either.
2.9 The State of the ULXs
Usually, ULXs are observed in three accretion regimes: the Broadened Disc (BD) state, Hard Ultraluminous (HUL) state, and Soft Ultraluminous (SUL) state (Sutton, Roberts & Middleton, 2013). To ascertain the state of the ULXs here, their spectra were fitted with a Tbabs*(Apec+Diskbb+Powerlaw) model and the values for the inner disc temperature (kTin), and the ratio of the unabsorbed flux contribution from the powerlaw component to the unabsorbed flux contribution from the diskbb component, for the energy range 0.3 to 1.0 keV (), were obtained. The different states are delineated by Sutton, Roberts & Middleton (2013) as follows:
kTin > 0.5 keV & < 5 : BD state
kTin > 0.5 keV, > 5, & < 2.0 : HUL state
kTin > 0.5 keV, > 5, & > 2.0 : SUL state
kTin < 0.5 keV & < 2.0 : HUL state
kTin < 0.5 keV & > 2.0 : SUL state
The model fit was effected for the two longest Chandra observations 12952 and 13253. Results are given in Table 7. It is observed that the sources fall into two classes, those in the BD state and those in the HUL state. Sources in these two different states are seen to fall in separate regions in the Colour-Colour diagram (Figure 4).
| Source | Obs Id | kTin | State | ||
| (keV) | (0.3-1.0keV) | ||||
| S4 | 12952 | 1.33 | 1.75 | 0.01 | BD |
| S4 | 13253 | no good fit | |||
| S5 | 12952 | 0.21 | 1.87 | - | HUL |
| S5 | 13253 | 0.19 | 1.80 | - | HUL |
| S6 | 12952 | 1.94 | 0.31 | 0.28 | BD |
| S6 | 13253 | 2.36 | 0.32 | 0.40 | BD |
| S7 | 12952 | 0.27 | 1.63 | - | HUL |
| S7 | 13253 | 0.36 | 1.72 | - | HUL |
| S24 | 12952 | no good fit | |||
| S24 | 13253 | 1.31 | 0.25 | 0.09 | BD |
3 Results
| Source | Best fit modela | Average L | Inter-observational | Lx - Kendall’s b | LSoft - kTin Kendall’s c | Counterpart |
| (1039erg/s) | fractional variability | correlation coefficient | correlation coefficient | (FUV / Optical) | ||
| S7 | Tbabs*(Apec+powerlaw) | 3.82 | 10.8 | +0.28 (p = 0.15) | +0.14 (p = 0.32 ) | Not detected |
| S5 | Tbabs*(Apec+bbody+powerlaw) | 14.5 | 15.1 | +0.14 (p = 0.23) | +0.43 (p = 0.01) | FUV and Optical |
| S6 | Tbabs*(Apec+bbody) | 3.80 | - | +0.16 (p = 0.24) | -0.02 (p = 0.46) | Not detected |
| S24 | Tbabs*(Apec+bbody) | 1.83 | - | -0.26 (p = 0.18) | +0.54 (p = 0.02) | Not detected |
| S4 | Tbabs*(Apec+bbody) | 1.50 | - | -0.50 (p = 0.03) | +0.33 (p = 0.10) | Not detected |
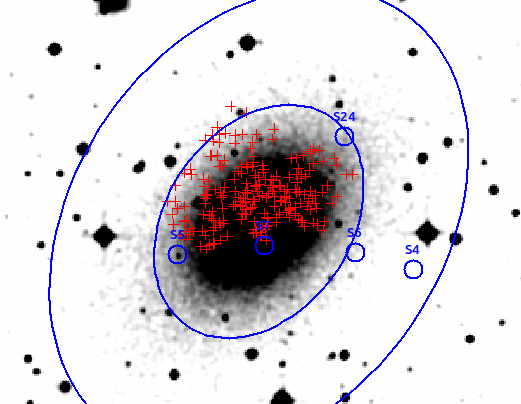
3.1 CXOJ150110.877+014142.65 (S7)
This ULX lies within the D25 ellipse of the galaxy and is the one closest to the centre of the galaxy among the five ULXs. S7 is not visible in FUV. Due to the diffuse emission in the galaxy, for this source, no conclusions can be drawn regarding any probable optical counterpart, from the DSS image (Figure 2). S7 is the only ULX for which a possible association with a globular cluster, in the catalogue prepared by Kundu & Whitmore (2001), may be surmised. The nearest GC is 0.1’ distance away from S7 and this GC has v-magnitude 23.860.093, i magnitude 22.860.17, and V-I Colour 1.00.19. This is typical for GCs in elliptical and S0 galaxies and also indicates that the GC is having high metallicity (Kundu & Whitmore, 2001). The spectrum of the source is quite soft. Spectral analysis yields Tbabs*(Apec + Powerlaw) as the preferred model for this source. Average value of of the source is 1.89 0.30 (Coefficient of variation (CoV) = standard deviation divided by mean is 15.9%). There is no intra-observational or inter-observational variability for S7 (see section §2.5 and §2.6). In the case of XMM-Newton observations, due to its location within the PSF of the central source, this source is detected only in the 0554680301 EMOS2 observation. Augmented models like bbody/diskbb added to Model 1 and Model 3 were also fitted to the spectra of this ULX but they are not statistically requested by the data.
3.2 CXOJ150116.555+014133.97 (S5)
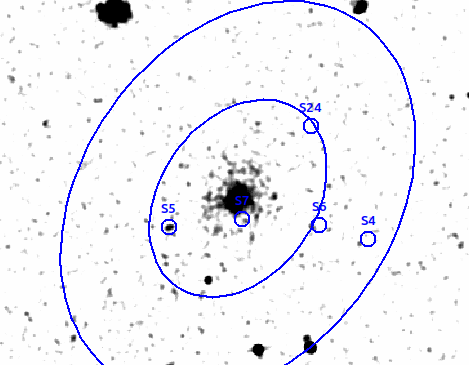
S5 is one of the brightest X-ray sources in NGC 5813. It lies inside the D25 ellipse. The source has an optical (Figure 2) and a FUV counterpart (Figure 3). The optical counterpart has u magnitude=20.520.08, g magnitude=20.900.04, r magnitude=20.620.05, i magnitude=19.510.03, z magnitude=19.190.07. (Abazajian et al., 2009). In the FUV, Gaia magnitude is 20.94 0.02 (Gaia Collaboration, 2020). We have estimated absolute magnitudes in the u, g, r, i, z filters of SDSS and estimated Colours: U-G Colour = -0.43, G-R Colour = +0.24, R-I Colour = +1.07 and I-Z Colour = +0.30 . Negative U-G suggests that the object is brighter in the U band than in the G band, which can be due to either X-ray reprocessing or accretion disk emission (Tao et al., 2011) or the source could be a young early type OB star cluster (e.g. Liu, Bregman, & Seitzer, 2004) or it could be emission from the nebula surrounding the ULX (Pakull & Mirioni, 2003). The red R-I Colour indicates either a Red Supergiant donor or line emission found in ULX nebulae.
The extracted spectra of source S5 are well fitted by Model 1 only. Model 2 and Model 3 give reduced greater than 2 (except for 0302460101 EMOS observation). The average value of is 2.06 0.08 (CoV = 3.9%). Model 1 and Model 3 augmented with bbody/diskbb were fitted to the spectra of this source. We used F-test and Akaike Information Criterion (AIC) to check if the augmented models significantly improve the fit. The value of AIC for the Tbabs*(Apec+Bbody+Powerlaw) model is minimum for five out of fifteen (Chandra and XMM-Newton) observations and AIC < 2 for eight observations and between 2 and 4 for just two observations. If AIC is < 2, it suggests that the alternate model is nearly on par with the best model. If AIC ranges between 4 and 7, the support for the new model is notably weaker. A AIC > 10 implies the new model is unlikely to be the best model (Akaike H., 1974). So, we can say that the addition of bbody to Model 1 really improves the fit. Fitting the spectra of S5 with Model 1 augmented with bbody yields kT in the range 0.10 - 0.20 keV and in the range 0.97 - 1.93. The average apparent emitting radius of the bbody component is 6900 km (excluding outliers). Model Tbabs*(Apec+Diskbb+Diskbb) gave minimum AIC value for Chandra observations 13246, 13253 and 13255 but for eight observations AIC has values ranging from 2 to 16. So we can not say this model is superior to Tbabs*(Apec+Bbody+Powerlaw). The value for soft diskbb varies from 0.13 to 0.32 and that for harder diskbb varies from 1.04 to 4.73. This source exhibits 15.1 inter-observational fractional variability over the time scale of days but there is no intra-observational variability (see §2.5 and §2.6).
3.3 CXOJ150104.927+014136.02 (S6)
ULX S6 lies just outside the D25 ellipse of NGC 5813. Neither optical nor FUV counterparts can be identified in DSS or GALEX FUV images for this ULX. For the deepest Chandra observation, Model 2 and Model 3 are giving good fit and Model 1 is giving a bad fit. Also, the spectrum of S6 is well fitted with Model 2, the absorbed blackbody, for more of the observations than it is with other models. So, we are taking Model 2 as the best fit model for S6. The average value of black body temperature is 0.86 0.24 (CoV = 27.5%). The average apparent emitting radius of the bbody component is 190 km. This ULX is comparatively harder than the other ULXs in NGC 5813 with values less than 1.0 in all nine Chandra observations. Though in XMM-Newton observations, values are greater than 1.5 for most of the observations, the spectrum of S6 is well fitted with Model 2 which is the absorbed Bbody. The hardness of the spectra of this ULX may be an indication of the possibility of this ULX being a PULX (Gúrpide et al., 2021). A detailed study of this source is required to confirm this. Model 1 augmented with bbody/diskbb and Model 3 augmented with a bbody/diskbb do not improve the fit. There is no intra-observational or inter-observational variability for S6 (see §2.5 and §2.6).
3.4 CXOJ150105.592+014330.76 (S24)
S24 lies on the D25 isophotal ellipse. Neither optical nor FUV counterparts could be found in DSS or GALEX observations for this source. In most of the observations Model 2 gives the best fit and for the deepest Chandra observation, Model 2 is giving a good fit. So, we consider Model 2 (absorbed Bbody) as the best-fit model for S24. The average value of blackbody temperature is 0.72 0.12 keV (CoV = 17.4%). The average apparent emitting radius of the black body component is 250 km. Model 1 augmented with bbody/diskbb and Model 3 augmented with bbody/diskbb were also fitted to the spectra of S24. The augmented models are not statistically requested by the data. There is no intra-observational or inter-observatioal variability for this source (see §2.5 and §2.6). There is possibly a moderate positive correlation between inner disk temperature (kTin) and L for this ULX but the error bars are very large and we can not confirm this correlation.
3.5 CXOJ150101.10+014119.89 (S4)
S4 lies outside the D25 ellipse but within the 2D25 ellipse. It is not visible in DSS and GALEX observations. Though the spectrum of the source can be fitted with Model 1, Model 2 and Model 3, for the deepest Chandra observations Model 2 and Model 3 are giving a good fit. Also, for majority of observations Model 2 gives the best fit. So, we consider Model 2 (absorbed Bbody) as the best-fit model for S4. The average value of black body temperature is 0.70 0.17 keV (CoV = 24.5%). The average apparent emitting radius of the bbody component is 200 km. Model 1 augmented with bbody/diskbb and Model 3 augmented with a bbody/diskbb do not improve the statistic. There is possibly a moderate negative correlation between luminosity and for this source; however the error bars are large and we cannot confirm this correlation. There is no intra-observational or inter-observatioal variability for this source (see §2.5 and §2.6).
4 Discussion
From the analysis, five ULXs, each having luminosity consistently greater than 1.0 1039 erg/s across the nine Chandra observations for all the three models fitted have been identified and out of these five sources, CXOJ150116.555+014133.97 (S5), CXOJ150110.877+014142.65 (S7) and CXOJ150105.592+014330.76 (S24) are within the D25 ellipse while CXOJ150104.927+014136.02 (S6) and CXOJ150101.10+014119.89 (S4) are in the region between the D25 and 2D25 ellipses. Out of the five ULXs in NGC 5813, S5 has average luminosity > 1040 erg/s, more than three times the average luminosity of the next brigthest source S7 (average luminosity above 3.0 1039 erg/s). The source S6 has average luminosity above 3.0 1039 erg/s.
None of the ULXs in NGC 5813 show intra-observational variability. Sources S7, S24, S6 and S4 are not significantly variable over the observations separated by days, with only S5 showing an inter observational fractional variability of 15.1. There is no unambiguous evidence of longer term (over years) variability for these ULXs. Generally, ULXs hosted by ETGs are considered less prone to variability, compared to ULXs hosted by late-type galaxies which tend to undergo more extreme inter-observational variability (Bernadich et al., 2022).
The ULX candidate S5 stands out because of identifiable optical and FUV counterparts which is very rare for a ULX in a giant elliptical galaxy. Point-like, compact optical emission in a galaxy can be a knot of star formation or a stellar cluster or a nebula possibly related to supernova remnant and/or photoionized by the ULX similar to Holmberg II X-I (Dewangan et al., 2004). Star formation knots (which can be bright in UV due to emission from hot OB stars) are not expected in elliptical galaxies; therefore, the optical emission might be from a globular cluster. Then, the FUV emission could be from hot HB stars in the globular cluster (Peacock et al., 2017). The optical emission can be from a nebula surrounding the ULX (Pakull & Mirioni, 2003). The FUV emission could be indicative of a strong accretion disk system also. To understand more, a detailed study of the UV spectrum is needed. S5 could be a HMXB because of the FUV counterpart; the spectrum is well fitted with an absorbed powerlaw augmented with bbody model for majority of the observations. For S5, the average black body temperature is 0.15 keV and average is . The powerlaw component may have resulted from Comptonization in a hot corona or accretion column over a NS surface. The remaining ULXs in NGC 5813 (S4, S6, S7, and S24) do not show any such counterparts in DSS or GALEX FUV images. The best fit model for S4, S6 and S24 is absorbed Bbody, while for S7 it is absorbed Powerlaw.
The emitting radius of a source indicates the size of the region emitting X-rays, which in these cases is usually the accretion disk. The emitting radius of S5 is of the order of 7,000 km which is around 30 times that of S4, S6 and S24, whose emitting radii lie in the range 190–250 km. This could be either because the emitting surface is the photosphere of an extended outflow or because the compact object is an IMBH which will have a comparatively larger accretion disk.
Table 8 gives the best-fit models and average luminosities of all the ULXs. S6 has an average less than 1. It is the hardest among these ULXs. The spectra of ULX pulsars are the hardest among the ULXs (e.g. Pintore et al., 2017; Bachetti et al., 2020; Gúrpide et al., 2021; Amato et al., 2023). So, S6 might be a possible candidate ULX pulsar, and may be hosting a neutron star (e.g. Carpano et al., 2018). S6 shows shifts in position in colour space (Figure 4).
Sources with luminosities above 1039 erg/s appear to be present in about 30% of galaxies across all morphological types but, there is slightly higher incidence of ULXs (nearly 40%) in elliptical galaxies (Kovlakas et al., 2020). One ULX was detected in NGC 4697 by Sarazin, Irwin, & Bregman (2000, 2001). Blanton, Sarazin, & Irwin (2001) has studied the S0 galaxy NGC 1553, which has strong diffuse emission, and detected 3 ULXs. NGC 1399 hosts eight ULXs; one of them is variable at a confidence level of 90% (Angelini, Loewenstein, & Mushotzky, 2001; Feng & Kaaret, 2006). Seven ULXs were detected in NGC 720 by Jeltema et al. (2003). NGC 1407 is reported to have six ULXs with luminosity exceeding 1039 erg/s (Zhang & Xu, 2004). Humphrey & Buote (2004) had identified two ULX candidates within the D25 radius of NGC 1332 but with luminosities below 2.01039 erg/s and they may simply be considered as the high-LX tail of LMXBs. NGC 1600 is a central elliptical galaxy in a group. It hosts 21 X-ray point sources with luminosities above 2.01039 erg/s – approximately of those sources are expected to be unrelated foreground or background sources (Sivakoff, Sarazin, & Carlin, 2004). The detection of five ULXs in NGC 5813 is not surprising compared to the detections in NGC 1407, NGC 1600, NGC 1399 and NGC 720. The detections in NGC 1407 and NGC 720 are based on a single observation but detections in NGC 1600 and NGC 1399 are based on multiple observations. The ULX candidates (luminosity above 1.01039 erg/s) in NGC 5813 reported here, are detected in all the available nine Chandra observations.
Since ULXs are generally considered to be HMXBs and hence to be found in young stellar populations, the presence of ULXs in elliptical galaxies, that usually contain older stars and LMXBs, was somewhat puzzling. Swartz et al. (2004), David et al. (2005) and Plotkin et al. (2014) state that bright LMXBs can be ULXs as well. We could not find any optical or UV counterparts for the ULXs S7, S6, S24 and S4. So, there is a possibility that these ULXs are LMXBs.
ULXs in ETGs can be hosted by globular clusters also. Two of the ULXs in NGC 1399 are hosted by GCs (Angelini, Loewenstein, & Mushotzky, 2001; Feng & Kaaret, 2006). Dage et al. (2019) has identified five GCULXs in NGC 4472, two in NGC 4649, and three in NGC 1399 (of which one GCULX faded beyond detection by 2005). M 87 hosts seven GCULXs (Dage et al., 2020). NGC 1316 hosts three ULXs that are associated with GCs (Dage et al., 2021). Thygesen et al. (2023) has identified two GCULXs in NGC 1600, two in NGC 708, one in NGC 890, one in NGC 1060 and three in NGC 7619. For NGC 5813, the association with GCs was checked (GC data from (Kundu & Whitmore, 2001)) (Figure 2). It may be noted that Kundu & Whitmore (2001) concentrated on the HST - WFPC2 field of view (2.7’) and only S7 is within this field. The closest GC is at 0.1’ distance from S7. Also, S5 is coinciding with an optical point source from the DSS observation; with a possible FUV counterpart also present in the GALEX image, it could be a GCULX.
Another possibility, to explain the presence of ULXs in elliptical galaxies, is that galaxy mergers can induce star formation in elliptical galaxies and create young stellar populations, which eventually give rise to ULXs (Raychaudhury et al., 2008). There is no evidence of any recent mergers in NGC 5813; still there are evidences of a past merger event. There are both metal poor and metal rich GCs in NGC 5813, which results in a significant optical Colour gradient of the GC population (Hargis & Rhode, 2014). The GCs have a significant age spread also (Hempel et al., 2007). The dynamically de-coupled core and dust filaments in the inner regions of NGC 5813 were noted as reminiscent of a merger by Kormendy (1984). So, there is a possibility that merger event/s might have induced a star formation event earlier in this galaxy and the ULXs might be the end products of the high mass stars formed during that phase. There are evidences for AGN feedback with regular outbursts at an interval of 107 years in NGC 5813 (Randall et al., 2011). This might have subsequently quenched the star formation in the galaxy.
NGC 5813 has SFR less than 0.003 Msolar/yr (McDonald et al., 2021) and < 0.49 x 10⁸ Msolar (McDonald et al., 2021). This clearly shows that NGC 5813 is a red galaxy with no recent star formation and little molecular gas. The presence of ULXs in ETGs is correlated more with the metallicity of the galaxy than with their SFR. Metallicity in NGC 5813 falls from [Fe/H]>0 in the central regions to [Fe/H] < -0.7 at radii > 60" (Efstathiou & Gorgas, 1985). All the five ULXs are in the region with [Fe/H] < -0.7. This is in agreement with the anti-correlation of ULXs with local metallicity of the galaxy (Kovlakas et al., 2020).
Acknowledgements
The authors are very grateful to the anonymous referee for valuable comments which significantly improved the manuscript. The scientific results reported in this article are mostly based on data obtained from the Chandra Data Archive. This research has made use of software provided by the Chandra X-ray Center (CXC) in the application packages CIAO, ChIPS, and Sherpa. We extend our gratitude to Arunav Kundu, Principal Investigator, Eureka Scientific Inc. for providing the Globular Cluster catalogue of NGC 5813. We would like to thank Scott W. Randall, Harvard-Smithsonian Center for Astrophysics for providing the metal abundance map and plasma temperature map of NGC 5813. The scientific results are based partly on observations obtained with XMM-Newton, an ESA science mission with instruments and contributions directly funded by ESA Member States and NASA. The library facilities, ASSC server facility and the hospitality of Inter-University Centre for Astronomy and Astrophysics, Pune helped in the successful completion of this work. Rajalakshmi T. R. acknowledges support for this work from DST-INSPIRE Fellowship grant, IF170751, under Ministry of Science and Technology, India.
Data Availability
We have made use of Chandra data and CIAO software for this work which are publicly available at Chandra X-ray Centre’s Chandra Data Archive888https://cxc.cfa.harvard.edu/cda/ and CIAO web page999https://cxc.cfa.harvard.edu/ciao/. The XMM-Newton data used for this work are also publicly available at ESA’s XMM-Newton Science Archive101010http://nxsa.esac.esa.int/nxsa-web/.
References
- Abazajian et al. (2009) Abazajian K. N., Adelman-McCarthy J. K., Agüeros M. A., Allam S. S., Allende Prieto C., An D., Anderson K. S. J., et al., 2009, ApJS, 182, 543.
- Akaike H. (1974) Akaike H., 1974, A New Look at the Statistical Model Identification, first edn. Springer, New York, NY
- Albacete Colombo et al. (2007) Albacete Colombo J. F., Flaccomio E., Micela G., Sciortino S., Damiani F., 2007, A&A, 464, 211.
- Amato et al. (2023) Amato R., Gúrpide A., Webb N. A., Godet O., Middleton M. J., 2023, A&A, 669, A130.
- Angelini, Loewenstein, & Mushotzky (2001) Angelini L., Loewenstein M., Mushotzky R. F., 2001, ApJL, 557, L35.
- Bachetti et al. (2014) Bachetti M., Harrison F. A., Walton D. J., Grefenstette B. W., Chakrabarty D., Fürst F., Barret D., et al., 2014, Natur, 514, 202.
- Bachetti et al. (2020) Bachetti M., Maccarone T. J., Brightman M., Brumback M. C., Fürst F., Harrison F. A., Heida M., et al., 2020, ApJ, 891, 44.
- Bachetti et al. (2013) Bachetti M., Rana V., Walton D. J., Barret D., Harrison F. A., Boggs S. E., Christensen F. E., et al., 2013, ApJ, 778, 163.
- Barra et al. (2022) Barra F., Pinto C., Walton D. J., Kosec P., D’Aì A., Di Salvo T., Del Santo M., et al., 2022, MNRAS, 516, 3972.
- Bernadich et al. (2022) Bernadich M. C. i ., Schwope A. D., Kovlakas K., Zezas A., Traulsen I., 2022, A&A, 659, A188.
- Blanton, Sarazin, & Irwin (2001) Blanton E. L., Sarazin C. L., Irwin J. A., 2001, ApJ, 552, 106.
- Brightman et al. (2023) Brightman M., Hameury J.-M., Lasota J.-P., Baldi R. D., Bruni G., Cann J. M., Earnshaw H., et al., 2023, ApJ, 951, 51.
- Burke et al. (2013b) Burke M. J., Kraft R. P., Soria R., Maccarone T. J., Raychaudhury S., Sivakoff G. R., Birkinshaw M., et al., 2013, ApJ, 775, 21.
- Burke et al. (2013a) Burke M. J., Raychaudhury S., Kraft R. P., Maccarone T. J., Brassington N. J., Hardcastle M. J., Kainulainen J., et al., 2013, ApJ, 766, 88.
- Cappellari, et al. (2011) Cappellari M., et al., 2011, MNRAS, 413, 813.
- Carollo et al. (1997) Carollo C. M., Franx M., Illingworth G. D., Forbes D. A., 1997, ApJ, 481, 710.
- Carpano et al. (2018) Carpano S., Haberl F., Maitra C., Vasilopoulos G., 2018, MNRAS, 476, L45.
- Cropper et al. (2004) Cropper M., Soria R., Mushotzky R. F., Wu K., Markwardt C. B., Pakull M., 2004, MNRAS, 349, 39.
- David et al. (2005) David L. P., Jones C., Forman W., Murray S. S., 2005, ApJ, 635, 1053.
- Dage et al. (2019) Dage K. C., Zepf S. E., Peacock M. B., Bahramian A., Noroozi O., Kundu A., Maccarone T. J., 2019, MNRAS, 485, 1694.
- Dage et al. (2020) Dage K. C., Zepf S. E., Thygesen E., Bahramian A., Kundu A., Maccarone T. J., Peacock M. B., et al., 2020, MNRAS, 497, 596.
- Dage et al. (2021) Dage K. C., Kundu A., Thygesen E., Bahramian A., Haggard D., Irwin J. A., Maccarone T. J., et al., 2021, MNRAS, 504, 1545.
- Dewangan, Griffiths, & Rao (2005) Dewangan G. C., Griffiths R. E., Rao A. R., 2005, arXiv, astro-ph/0511112.
- Dewangan et al. (2004) Dewangan G. C., Miyaji T., Griffiths R. E., Lehmann I., 2004, ApJL, 608, L57.
- Earnshaw et al. (2019) Earnshaw H. P., Roberts T. P., Middleton M. J., Walton D. J., Mateos S., 2019, MNRAS, 483, 5554.
- Edelson et al. (2002) Edelson R., Turner T. J., Pounds K., Vaughan S., Markowitz A., Marshall H., Dobbie P., et al., 2002, ApJ, 568, 610.
- Efstathiou & Gorgas (1985) Efstathiou G., Gorgas J., 1985, MNRAS, 215, 37P.
- Emsellem et al. (2004) Emsellem E., Cappellari M., Peletier R. F., McDermid R. M., Bacon R., Bureau M., Copin Y., et al., 2004, MNRAS, 352, 721.
- Feng & Kaaret (2006) Feng H., Kaaret P., 2006, ApJ, 653, 536.
- Feng & Kaaret (2009) Feng H., Kaaret P., 2009, ApJ, 696, 1712.
- Feng & Soria (2011) Feng H., Soria R., 2011, NewAR, 55, 166.
- Fürst et al. (2016) Fürst F., Walton D. J., Harrison F. A., Stern D., Barret D., Brightman M., Fabian A. C., et al., 2016, ApJL, 831, L14.
- Gaia Collaboration (2020) Gaia Collaboration, 2020, yCat, 1350
- Giacintucci et al. (2011) Giacintucci S., O’Sullivan E., Vrtilek J., David L. P., Raychaudhury S., Venturi T., Athreya R. M., et al., 2011, ApJ, 732, 95.
- Gilfanov, Grimm, & Sunyaev (2004) Gilfanov M., Grimm H.-J., Sunyaev R., 2004, NuPhS, 132, 369.
- Gladstone & Roberts (2009) Gladstone J. C., Roberts T. P., 2009, MNRAS, 397, 124.
- Gladstone, Roberts, & Done (2009) Gladstone J. C., Roberts T. P., Done C., 2009, MNRAS, 397, 1836.
- Ghosh & Rana (2022) Ghosh T., Rana V., 2022, MNRAS, 517, 4247.
- Ghosh, Rana, & Bachetti (2022) Ghosh T., Rana V., Bachetti M., 2022, ApJ, 938, 76.
- Gregory & Loredo (1992) Gregory P. C., Loredo T. J., 1992, ApJ, 398, 146.
- Gúrpide et al. (2021) Gúrpide A., Godet O., Koliopanos F., Webb N., Olive J.-F., 2021, A&A, 649, A104.
- Gúrpide et al. (2021) Gúrpide A., Godet O., Vasilopoulos G., Webb N. A., Olive J.-F., 2021, A&A, 654, A10.
- Hargis & Rhode (2014) Hargis J. R., Rhode K. L., 2014, ApJ, 796, 62.
- Hempel et al. (2007) Hempel M., Zepf S., Kundu A., Geisler D., Maccarone T. J., 2007, ApJ, 661, 768.
- Humphrey & Buote (2004) Humphrey P. J., Buote D. A., 2004, ApJ, 612, 848.
- Israel et al. (2017a) Israel G. L., Belfiore A., Stella L., Esposito P., Casella P., De Luca A., Marelli M., et al., 2017, Sci, 355, 817.
- Israel et al. (2017b) Israel G. L., Papitto A., Esposito P., Stella L., Zampieri L., Belfiore A., Rodríguez Castillo G. A., et al., 2017, MNRAS, 466, L48.
- Jeltema et al. (2003) Jeltema T. E., Canizares C. R., Buote D. A., Garmire G. P., 2003, ApJ, 585, 756.
- Jithesh et al. (2014) Jithesh V., Misra R., Shalima P., Jeena K., Ravikumar C. D., Babu B. R. S., 2014, RAA, 14, 1251-1263.
- Kaaret et al. (2003) Kaaret P., Corbel S., Prestwich A. H., Zezas A., 2003, Sci, 299, 365.
- Kaaret & Feng (2009) Kaaret P., Feng H., 2009, ApJ, 702, 1679.
- Kaaret, Feng, & Roberts (2017) Kaaret, P. & Feng, H. & Roberts, T.,2017, Annual Review of Astronomy and Astrophysics. 55.
- Kajava & Poutanen (2009) Kajava J. J. E., Poutanen J., 2009, MNRAS, 398, 1450.
- Kalberla, et al. (2005) Kalberla P. M. W., Burton W. B., Hartmann D., Arnal E. M., Bajaja E., Morras R., Pöppel W. G. L., 2005, A&A, 440, 775.
- Khrutskaya, Khovritchev, & Bronnikova (2004) Khrutskaya E. V., Khovritchev M. Y., Bronnikova N. M., 2004, A&A, 418, 357.
- King, Lasota, & Middleton (2023) King A., Lasota J.-P., Middleton M., 2023, NewAR, 96, 101672.
- King, Schenker, & Hameury (2002) King A. R., Schenker K., Hameury J. M., 2002, MNRAS, 335, 513.
- Kitaki et al. (2017) Kitaki T., Mineshige S., Ohsuga K., Kawashima T., 2017, PASJ, 69, 92.
- Koliopanos et al. (2017) Koliopanos F., Vasilopoulos G., Godet O., Bachetti M., Webb N. A., Barret D., 2017, A&A, 608, A47.
- Kong & Di Stefano (2005) Kong A. K. H., Di Stefano R., 2005, ApJL, 632, L107.
- Kormendy (1984) Kormendy J., 1984, ApJ, 287, 577.
- Kovlakas et al. (2020) Kovlakas K., Zezas A., Andrews J. J., Basu-Zych A., Fragos T., Hornschemeier A., Lehmer B., et al., 2020, MNRAS, 498, 4790.
- Krajnović et al. (2015) Krajnović D., Weilbacher P. M., Urrutia T., Emsellem E., Carollo C. M., Shirazi M., Bacon R., et al., 2015, MNRAS, 452, 2.
- Kundu & Whitmore (2001) Kundu A., Whitmore B. C., 2001, AJ, 121, 2950.
- Kundu & Whitmore (2001) Kundu A., Whitmore B. C., 2001, AJ, 122, 1251.
- Lasota & King (2023) Lasota J.-P., King A., 2023, MNRAS, 526, 2506.
- Liu, Bregman, & Seitzer (2004) Liu J.-F., Bregman J. N., Seitzer P., 2004, ApJ, 602, 249.
- Liu J. (2011) Liu J., 2011, ApJS, 192, 10.
- Mapelli, Colpi, & Zampieri (2009) Mapelli M., Colpi M., Zampieri L., 2009, MNRAS, 395, L71.
- McDonald et al. (2021) McDonald M., McNamara B. R., Calzadilla M. S., Chen C.-T., Gaspari M., Hickox R. C., Kara E., et al., 2021, ApJ, 908, 85.
- Middleton et al. (2015) Middleton M. J., Heil L., Pintore F., Walton D. J., Roberts T. P., 2015, MNRAS, 447, 3243.
- Miller et al. (2003) Miller J. M., Fabbiano G., Miller M. C., Fabian A. C., 2003, ApJL, 585, L37.
- Miller et al. (2013) Miller J. M., Walton D. J., King A. L., Reynolds M. T., Fabian A. C., Miller M. C., Reis R. C., 2013, ApJL, 776, L36.
- Mineo et al. (2013) Mineo S., Rappaport S., Steinhorn B., Levine A., Gilfanov M., Pooley D., 2013, ApJ, 771, 133.
- Maitra et al. (2019) Maitra C., Carpano S., Haberl F., Vasilopoulos G., 2019, IAUS, 346, 242.
- Mondal et al. (2020) Mondal S., Różańska A., Lai E. V., De Marco B., 2020, A&A, 642, A94.
- Mondal et al. (2021) Mondal S., Różańska A., Bagińska P., Markowitz A., De Marco B., 2021, A&A, 651, A54.
- Peacock et al. (2017) Peacock M. B., Zepf S. E., Kundu A., Chael J., 2017, MNRAS, 464, 713.
- Pakull & Mirioni (2003) Pakull M. W., Mirioni L., 2003, RMxAC, 15, 197
- Park et al. (2006) Park T., Kashyap V. L., Siemiginowska A., van Dyk D. A., Zezas A., Heinke C., Wargelin B. J., 2006, ApJ, 652, 610.
- Pinto et al. (2017) Pinto C., Alston W., Soria R., Middleton M. J., Walton D. J., Sutton A. D., Fabian A. C., et al., 2017, MNRAS, 468, 2865.
- Pinto et al. (2021) Pinto C., Soria R., Walton D. J., D’Aì A., Pintore F., Kosec P., Alston W. N., et al., 2021, MNRAS, 505, 5058.
- Pintore et al. (2015) Pintore F., Esposito P., Zampieri L., Motta S., Wolter A., 2015, MNRAS, 448, 1153.
- Pintore et al. (2017) Pintore F., Zampieri L., Stella L., Wolter A., Mereghetti S., Israel G. L., 2017, ApJ, 836, 113.
- Plotkin et al. (2014) Plotkin R. M., Gallo E., Miller B. P., Baldassare V. F., Treu T., Woo J.-H., 2014, ApJ, 780, 6.
- Poutanen et al. (2007) Poutanen J., Lipunova G., Fabrika S., Butkevich A. G., Abolmasov P., 2007, MNRAS, 377, 1187.
- Randall et al. (2015) Randall S. W., Nulsen P. E. J., Jones C., Forman W. R., Clarke T. E., Blanton E. L., 2015, IAUS, 313, 277, IAUS..313
- Randall et al. (2011) Randall S. W., Forman W. R., Giacintucci S., Nulsen P. E. J., Sun M., Jones C., Churazov E., et al., 2011, ApJ, 726, 86.
- Raychaudhury et al. (2008) Raychaudhury S., Vargas I. M., Jones C., Forman W. R., Vikhlinin A., Murray S. S., 2008, AIPC, 1053, 111.
- Robba et al. (2021) Robba A., Pinto C., Walton D. J., Soria R., Kosec P., Pintore F., Roberts T. P., et al., 2021, A&A, 652, A118.
- Roberts et al. (2006) Roberts T. P., Kilgard R. E., Warwick R. S., Goad M. R., Ward M. J., 2006, MNRAS, 371, 1877.
- Roberts et al. (2016) Roberts T. P., Middleton M. J., Sutton A. D., Mezcua M., Walton D. J., Heil L. M., 2016, AN, 337, 534.
- Roberts et al. (2004) Roberts T. P., Warwick R. S., Ward M. J., Goad M. R., 2004, MNRAS, 349, 1193.
- Rodríguez Castillo et al. (2020) Rodríguez Castillo G. A., Israel G. L., Belfiore A., Bernardini F., Esposito P., Pintore F., De Luca A., et al., 2020, ApJ, 895, 60.
- Salvaggio et al. (2022) Salvaggio C., Wolter A., Pintore F., Pinto C., Ambrosi E., Israel G. L., Marino A., et al., 2022, MNRAS, 512, 1814.
- Sarazin, Irwin, & Bregman (2000) Sarazin C. L., Irwin J. A., Bregman J. N., 2000, ApJL, 544, L101.
- Sarazin, Irwin, & Bregman (2001) Sarazin C. L., Irwin J. A., Bregman J. N., 2001, ApJ, 556, 533.
- Sathyaprakash et al. (2019) Sathyaprakash R., Roberts T. P., Walton D. J., Fuerst F., Bachetti M., Pinto C., Alston W. N., et al., 2019, MNRAS, 488, L35.
- Shakura & Sunyaev (1973) Shakura N. I., Sunyaev R. A., 1973, A&A, 24, 337
- Sivakoff, Sarazin, & Carlin (2004) Sivakoff G. R., Sarazin C. L., Carlin J. L., 2004, ApJ, 617, 262.
- Stobbart, Roberts & Wilms (2006) Stobbart A. -M., Roberts T. P. and Wilms J., 2006, MNRAS, 368, 397S.
- Straub, Done, & Middleton (2013) Straub O., Done C., Middleton M., 2013, A&A, 553, A61.
- Strickland et al. (2001) Strickland D. K., Colbert E. J. M., Heckman T. M., Weaver K. A., Dahlem M., Stevens I. R., 2001, ApJ, 560, 707.
- Soria (2011) Soria R., 2011, AN, 332, 330.
- Sutton, Roberts & Middleton (2013) Sutton A. D., Roberts T. P., Middleton M. J., 2013, MNRAS, 435, 1758.
- Swartz et al. (2011) Swartz D. A., Soria R., Tennant A. F., Yukita M., 2011, ApJ, 741, 49.
- Swartz et al. (2004) Swartz D. A., Ghosh K. K., Tennant A. F., Wu K., 2004, ApJS, 154, 519.
- Tao et al. (2011) Tao L., Feng H., Grisé F., Kaaret P., 2011, ApJ, 737, 81.
- Thygesen et al. (2023) Thygesen E., Sun Y., Huang J., Dage K. C., Zepf S. E., Kundu A., Haggard D., et al., 2023, MNRAS, 518, 3386.
- Tully et al. (2013) Tully R. B., Courtois H. M., Dolphin A. E., Fisher J. R., Héraudeau P., Jacobs B. A., Karachentsev I. D., et al., 2013, AJ, 146, 86.
- van Haaften et al. (2019) van Haaften L. M., Maccarone T. J., Rhode K. L., Kundu A., Zepf S. E., 2019, MNRAS, 483, 3566.
- Vaughan et al. (2003) Vaughan S., Edelson R., Warwick R. S., Uttley P., 2003, MNRAS, 345, 1271.
- Walton et al. (2018) Walton D. J., Fürst F., Harrison F. A., Stern D., Bachetti M., Barret D., Brightman M., et al., 2018, MNRAS, 473, 4360.
- Wang et al. (2016) Wang S., Qiu Y., Liu J., Bregman J. N., 2016, ApJ, 829, 20
- Watarai, Mizuno, & Mineshige (2001) Watarai K.-. ya ., Mizuno T., Mineshige S., 2001, ApJL, 549, L77
- Webb et al. (2020) Webb N. A., Coriat M., Traulsen I., Ballet J., Motch C., Carrera F. J., Koliopanos F., et al., 2020, A&A, 641, A136.
- Werner et al. (2014) Werner N., Oonk J. B. R., Sun M., Nulsen P. E. J., Allen S. W., Canning R. E. A., Simionescu A., et al., 2014, MNRAS, 439, 2291.
- Zhang & Xu (2004) Zhang Z.-L., Xu H.-G., 2004, ChJAA, 4, 221.