COS-EDGES: Co-rotation and Kinematic Stratification of the Multi-Phase CGM Around Edge-On Galaxies
Abstract
We present the first results from the COS-EDGES survey, targeting the kinematic connection between the interstellar medium and multi-phase circumgalactic medium (CGM) in nine isolated, near-edge-on galaxies at , each probed along its major axis by a background quasar at impact parameters of kpc. Using VLT/UVES and HST/COS quasar spectra, we analyse Mg i, Mg ii, H i, C ii, C iii, and O vi absorption relative to galaxy rotation curves from Keck/LRIS and Magellan/MagE spectra. We find that low ionisation absorption for 8/9 galaxies lies below the halo escape velocity, indicating bound inflow or recycling gas, while 6/9 galaxies have high ionisation gas reaching above the halo escape velocity, suggesting some unbound material. We find that at lower (), over of absorption in all ions lies on the side of systemic velocity matching disk rotation, and the optical-depth–weighted median velocity () is consistent with the peak rotation speed. At higher (), the kinematics diverge by ionisation state: For the low ionisation gas, the amount of co-rotating absorption remains above 80%, yet drops to roughly 60% of the galaxy rotation speed. For the high ionisation gas (O vi), only 60% of the absorption is consistent with co-rotation and drops to 20% of the galaxy rotation speed. Furthermore, the velocity widths, corresponding to 50% of the total optical depth () for low ionisation gas is up to 1.8 times larger in the inner halo than at larger radii, while for C iii and O vi remains unchanged with distance. The 90% optical-depth width () shows a modest decline with radius for low ionisation gas but remains constant C iii and O vi. At high both and increase with ionization potential. These results suggest a radially dependent CGM kinematic structure: the inner halo hosts cool, dynamically broad gas tightly coupled to disk rotation, whereas beyond , particularly traced by O vi and H i, the CGM shows weaker rotational alignment and lower relative velocity dispersion. Therefore, low-ionisation gas likely traces extended co-rotating gas, inflows and/or recycled accretion, while high-ionisation gas reflects a mixture of co-rotating, lagging, discrete collisionally ionised structures and volume-filling warm halo, indicating a complex kinematic stratification of the multi-phase CGM.
keywords:
circumgalactic medium, quasar-galaxy pairs, emission line galaxies, interstellar mediumCentre for Astrophysics and Supercomputing, Swinburne University of Technology, Hawthorn, Victoria 3122, Australia Glenn Kacprzak]gkacprzak@swin.edu.au
1 Introduction
In 1986, a galaxy near a quasar sightline was determined to have a redshift matching Mg ii absorption found in the quasar’s spectrum bergeron86, providing a key observational link between a galaxy and its circumgalactic medium (CGM) (haschick75; boksenberg78, also see). Since Jacqueline Bergeron’s finding, significant efforts have been made to understand the connection between the CGM and its host galaxy and its role in influencing galaxy evolution.
The kinematics of the CGM (velocity centroids, dispersions, and systemic redshifts) can be directly measured from absorption profiles and provide powerful insights into the origins of this gas. Early studies showed that Mg ii absorption systems typically exhibited velocity structures where clouds clustered together, occasionally with higher-velocity clouds offset from the main groupings. These coherent motions were proposed to arise from rotating halos weisheit78; lanzetta92 or from a combination of extended disk rotation and infalling accretion charlton98. Additionally, prochaska97 determined that the metal-line kinematics of Damped Ly systems (DLAs) strongly favoured a cold, disk-like origin. These early results highlighted the need to understand how absorption kinematics relate to their host galaxies, while further determining if the gas is co-rotating or infalling.
Further insights into the connections between the CGM and their galaxies came with the morphological modelling of Mg ii host galaxy properties using high resolution images kacprzak07. Since then, studies have shown that the spatial distribution of the CGM of intermediate redshift galaxies is bimodal; gas is more frequently detected along the major and minor axes of galaxies for ions such as Mg ii bordoloi11; bouche12; kacprzak12; lan14; martin19; zabl19; lundgren21, O vi kacprzak15; beckett21 and H i beckett21. These results support the idea that gas flows out of galaxies along their minor axes, while gas accretes along the disk plane, which is the picture supported by simulations peroux20; defilippis21; pillepich21; hafen22; trapp22; yang24. Thus, to fully understand the gas flow processes found in the CGM, both kinematics and the galaxy-quasar geometry should be examined.
Simulations show that the low-ionisation CGM most likely corotates with the galaxy disk as it accretes onto galaxies stewart13; stewart17; ho19. This is confirmed by Mg ii absorption found along the major axes of galaxies, which typically aligns with the direction of galaxy rotation out to 100 kpc steidel02; kacprzak10; kacprzak11kin; bouche13; bouche16; diamond-stanic16; ho17; rahmani18; martin19; lopez20. Similar co-rotating signatures have been found for Ly barcons95; french20; nateghi24GFI, which is expected since H i can trace the low ionisation phase. Furthermore, the kinematic consistency between the galaxy and Ly is at its highest within the galaxy virial radius and decreases with increasing distance nateghi24GFI. This kinematic consistency further decreases with decreasing H i column density nateghi24GFI.
While H i mostly traces the cool low ionisation gas phase, it is associated with warmer gas phases as well. Thus, it is important to address whether all ions are tracing the same kinematics or arising from different structures from the CGM. kacprzak19kine reported that O vi, found along the major axes of ten galaxies with impact parameters ranging between kpc (), appears to be less kinematically connected to the rotation of the galaxy, with O vi mostly spanning the galaxy systemic velocities. Using cosmological simulations, they showed that while O vi did exhibit signatures of accretion along the major axis, they concluded that the observational inflow signatures were obscured by the broad distribution of the O vi velocities across the halo. Other studies further showed that a significant fraction of O vi detected in absorption systems associated with galaxies actually resides outside of the galaxy halo ho21; bromberg24. Yet, signatures of O vi co-rotation do exist, and when O vi is consistent with a co-rotation model, these absorbers primarily reside along the galaxies’ major axis nateghi24GFII. ho25, in a sample of 18 edge-on galaxies probed along their major axes with impact parameters ranging between kpc (), showed that although O vi clouds at large radii can display complex kinematics, the majority of the warm–hot halo gas nevertheless co-rotates with the galaxy and seldom exhibits retrograde motion. This implies that even O vi retains a substantial fraction of the galaxy’s angular momentum. Thus, addressing how O vi and other ions are kinematically connected to their galaxies will shed light on the physical processes within the CGM.
A recent study by nateghi24GFII inspected 27 galaxies () associated with multi-phase absorption at impact parameters ranging between kpc () and found that the amount of co-rotating gas decreases with increasing ionisation potential. This showed that the low-ionisation CGM is more kinematically coupled to the galaxy compared to the high-ionisation CGM. They further reported that the fraction of corotating low and high ionisation potential species likely increases with increasing H i column density, but this correlation is likely shallower for higher ionisation gas. They further showed that the co-rotation of lower ionisation gas decreases with increasing distance away from the galaxy (klimenko23, also consistent with) while O vi was consistent with being flat. These studies have provided useful information regarding the kinematic connection between galaxies and their multi-phase CGM, yet their samples contain a range of galaxy properties, redshifts and orientations, which could result in probing a range of CGM phenomena and masking stronger correlations. In order to target specific CGM processes, such as gas accretion, more focused samples are required.
The aim of our program is to address how gas flows towards galaxies via an analysis of the galaxies and their multi-phase CGM. To do this, we have selected a sample of , isolated, edge-on galaxies with the quasar located along their major axis at projected distances of kpc. In this first paper, we compare the galaxies’ rotation velocities to the CGM absorption kinematics across different ions, assessing the presence or absence of co-rotation as a function of gas phase and distance. The paper is organised as follows: In Section 2 we present galaxy properties and the data used in our analysis. In Section 3 we present a kinematic analysis of the ISM and the CGM. We discuss our results in Section 4 and present our concluding remarks in Section 5. The Appendices include the individual galaxy-CGM kinematic comparisons for reference. Throughout this paper, we adopt an km s-1 Mpc-1, , cosmology.
2 Data and Analysis
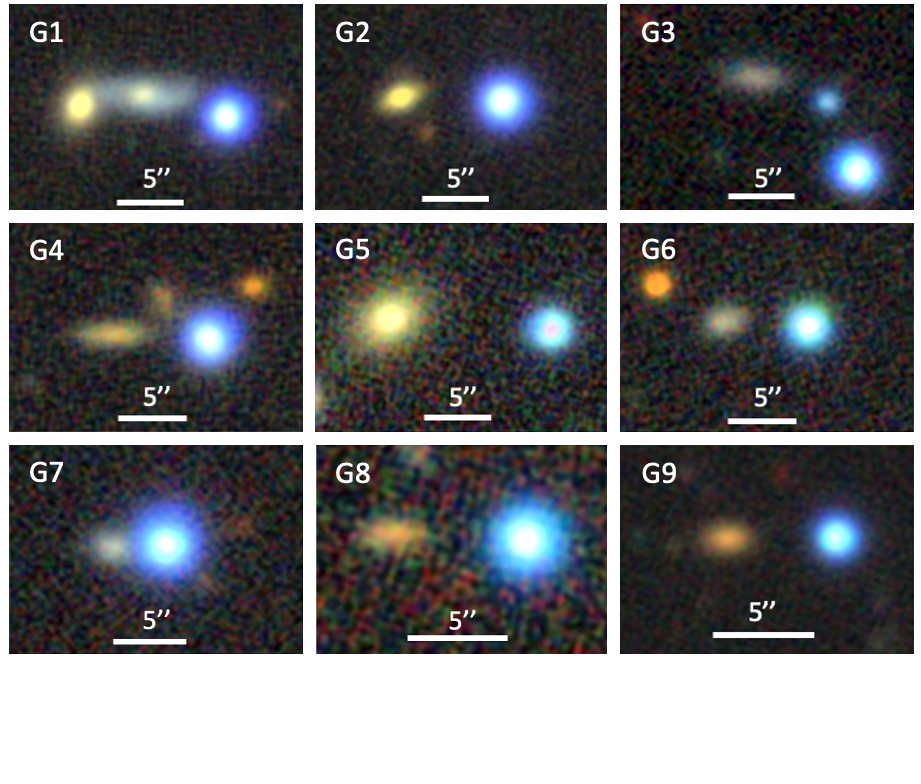
The following section presents the COS-EDGES survey and data obtained for this sample of nine galaxies. The galaxies were selected from chen10a and huang21 and were chosen to be moderately inclined ( degrees) with the major axis closely aligned with the quasar sightline (1 35 degrees) with detected Mg ii absorption. The galaxies have a stellar mass range of and are within 38 kpc, or 0.31, of the background quasars. We selected targets with low galaxy-quasar separations in order to examine how gas transitions from the CGM to the ISM. Images of the nine galaxies are presented in Figure 1 and the galaxy properties are shown in Table 1.
2.1 VLT/UVES Quasar Spectra
The Mg ii absorption associated with these galaxies was already identified using low/moderate resolution spectra chen10a; huang21. However, in order to examine the individual kinematic components of each absorption system, high resolution spectra are required. These data were obtained using UVES dekker-uves which is a dual-arm, grating cross-dispersed high resolution optical echelle spectrograph mounted on the Nasmyth B focus of Unit Telescope 2 of the VLT. The program IDs for these data are 105.20FN.001, 105.20FN.002 and 108.22F4.002. The data were taken between 2020 and 2022 using a slit width of 1.2′′ and using the Blue CCD1 setting in order to capture Mg ii, Mg i and Fe ii over the wavelength range of 3000-4000 Å. The exposure times were based on quasar brightness in the U-band and range in exposure times between seconds. The UVES spectra were reduced using a combination of the standard ESO pipeline and the UVES Post–Pipeline Echelle Reduction (uvespopler; murphy2019, uves popler;). The spectra were both vacuum and heliocentric corrected and have a final velocity dispersion of 2.5 km s-1 pixel-1. Analysis of the Mg ii and Mg i absorption profiles was performed using our own interactive software (cv01; churchill20, see) for local continuum fitting, objective feature identification, and measuring absorption properties.
2.2 HST/COS Quasar Spectra
The Hubble Space Telescope (HST) Cosmic Origins Spectrograph (green12, COS;) was used to obtain the ultraviolet spectra of each background quasar (PID 17541). We optimised the G130M grating (, (FWHM km s-1) central wavelength for each target, given the galaxy redshift, to maximise coverage of a range of ions (C ii, C iii, N ii, N iii, O i, O vi, Si ii and Fe ii) and coverage of the Lyman series from Ly onwards, using the 1091, 1222 and 1291 settings. Data111The data described here may be obtained from http://dx.doi.org/10.17909/bcdb-6c02 were retrieved from the Barbara A. Mikulski Archive for Space Telescopes (MAST). We binned the spectra by three pixels to increase the signal-to-noise ratio (S/N) and our analysis was performed on the binned spectra. Analysis of the absorption systems was performed using our own interactive software (cv01, see) for local continuum fitting, objective feature identification, and measuring absorption properties.
2.3 Galaxy Spectra
We obtained spectra of the nine galaxies using either Magellan/MagE or Keck/LRIS.
Galaxies G1, G8 and G9 were obtained using the MagE spectrograph marshall08 mounted on the Magellan I Baade Telescope (6.5 m) at the Las Campanas Observatory in Chile on 17 and 18 of August 2018. MagE covers the observed-frame optical ( Å) wavelengths. We used a 0.7′′ slit with binning, resulted in a spectral resolution of . The spatial resolution is pixel. Exposure times ranged between 2400 and 4200 seconds. Data was reduced using the PypeIt reduction pipeline prochaska20pypit, using standard stars and arc lamps taken during the night. The spectra were vacuum and heliocentric corrected.
Spectra for the remaining six galaxies were obtained using the LRIS spectrograph oke95; mccarthy98 mounted on the Keck I Telescope (10 m) at the Keck Observatory in Hawaii on 20 January 2023. We used the B600/4000 grism () for LRIS Blue and R1200/7500 grating () for LRIS Red with a 1′′ wide slit with binning. The spatial resolution is pixel. The data were reduced using IRAF, with standard stars and arc lamps taken during the night. The spectra were vacuum and heliocentric corrected.
We extracted the galaxy rotation curves by employing a three-pixel-wide aperture size and shifted it at one-pixel intervals along the spatial direction to extract a sequence of spectra along the galaxy major axis (vogt96; steidel02; kacprzak10, see). Gaussian profiles were fitted to the galaxy emission lines using H, or [O ii] when H was blended with skylines, to determine their wavelengths and line-of-sight velocity centroids within an accuracy of less than 6 km s-1. These centroids were then utilized to determine the galaxy systemic redshifts and rotation curves.
Star formation rates (SFRs) were computed using H line fluxes, or [O ii] line fluxes when H was blended with skylines, using the relations from kewley04. We corrected the lines fluxes for slit loss by using the -band DECaLS imaging to compute the ratio of the total galaxy flux to the fraction of flux captured by the slit. No dust corrections were applied to the SFRs. The SFRs are listed in Table 1.
| Name | RA | DEC | SFR | ||||||||
|---|---|---|---|---|---|---|---|---|---|---|---|
| (J2000) | (J2000) | (kpc) | (kpc) | () | () | ( yr-1) | (degree) | (degree) | |||
| (1) | (2) | (3) | (4) | (5) | (6) | (7) | (8) | (9) | (10) | (11) | (12) |
| G1 | 00:33:40 | 00:55:22 | 0.2124 | 21.9 | 110 | 0.20 | 9.8 | 11.3 | 0.25‡ | 81 | 10 |
| G2 | 00:34:13 | 01:00:20 | 0.2565 | 30.4 | 142 | 0.21 | 10.3 | 11.6 | 0.10† | 85 | 29 |
| G3 | 01:01:56 | 08:44:09 | 0.1583 | 28.4 | 91 | 0.31 | 9.4 | 11.1 | 0.31† | 67 | 35 |
| G4 | 12:13:09 | 14:08:37 | 0.2903 | 31.0 | 152 | 0.20 | 10.4 | 11.7 | 0.56‡ | 73 | 9 |
| G5 | 08:23:41 | 07:47:51 | 0.1866 | 37.5 | 171 | 0.22 | 10.6 | 11.9 | 0.39‡ | 60 | 25 |
| G6 | 13:27:57 | 10:11:36 | 0.2554 | 25.3 | 106 | 0.24 | 9.7 | 11.3 | 1.17‡ | 63 | 1 |
| G7 | 12:16:41 | 07:12:24 | 0.2366 | 13.0 | 106 | 0.12 | 9.7 | 11.3 | 0.67‡ | 61 | 19 |
| G8 | 21:29:39 | 06:37:59 | 0.2780 | 27.7 | 117 | 0.24 | 9.9 | 11.4 | 0.72‡ | 66 | 9 |
| G9 | 23:49:49 | 00:35:42 | 0.2782 | 31.6 | 163 | 0.19 | 10.5 | 11.8 | 0.59‡ | 78 | 6 |
2.4 Galaxy Morphologies
The galaxy properties were measured using GALFIT peng10 on DECaLS dey19 band images. Point spread functions were modelled using unsaturated, nearby stars in the field. Galaxies were modelled in the band image. The galaxy inclination was computed from the GALFIT values using , where for late type spirals (guthrie92; favaro25, e.g,). The galaxies are modestly inclined ( degrees, with a mean of degrees) and have their major axes aligned with the quasar sightlines (1 35 degrees, with a mean of degrees). The galaxy properties are shown in Table 1. Given the assumption of , which can range from (favaro25, see summary from) and the low spatial resolution images, the errors in the inclination values are of the order of ten degrees, while the azimuthal angle errors are of the order of five degrees. The galaxy orientation is not directly used in this study, but is used to emphasise that our galaxies are near edge-on with the quasar near their major axis. We are in the process of obtaining higher spatial resolution images to further address in the future how the CGM behaves relative to the disks of galaxies.
3 Results
In the next subsections, we present the properties of the sample, the kinematic comparison between the galaxy ISM and multi-phase CGM detected in absorption, and general statistical kinematic trends.
3.1 Sample Properties
Figure 1 shows the DECaLS dey19 colour images of the nine galaxies. The quasars are the bright blue point sources and the targeted galaxies are the largest galaxy next to them. The unoriginal nicknames for each of these galaxies are labelled in the upper-corner of the figure and are used throughout the manuscript. All of these galaxies are found to be isolated to at least with 130 kpc, based on the spectroscopic survey of chen10a and huang21. G1 has a bright nearby galaxy, but it is at an unrelated redshift.
The galaxies have H or [O ii] derived star-formation rates ranging between SFR M⊙ yr-1. The galaxies are edge-on, with a mean inclination angle of degrees and a range of degrees. The quasar sightlines are located at azimuthal angles ranging between 1 35 degrees, with a mean of degrees.
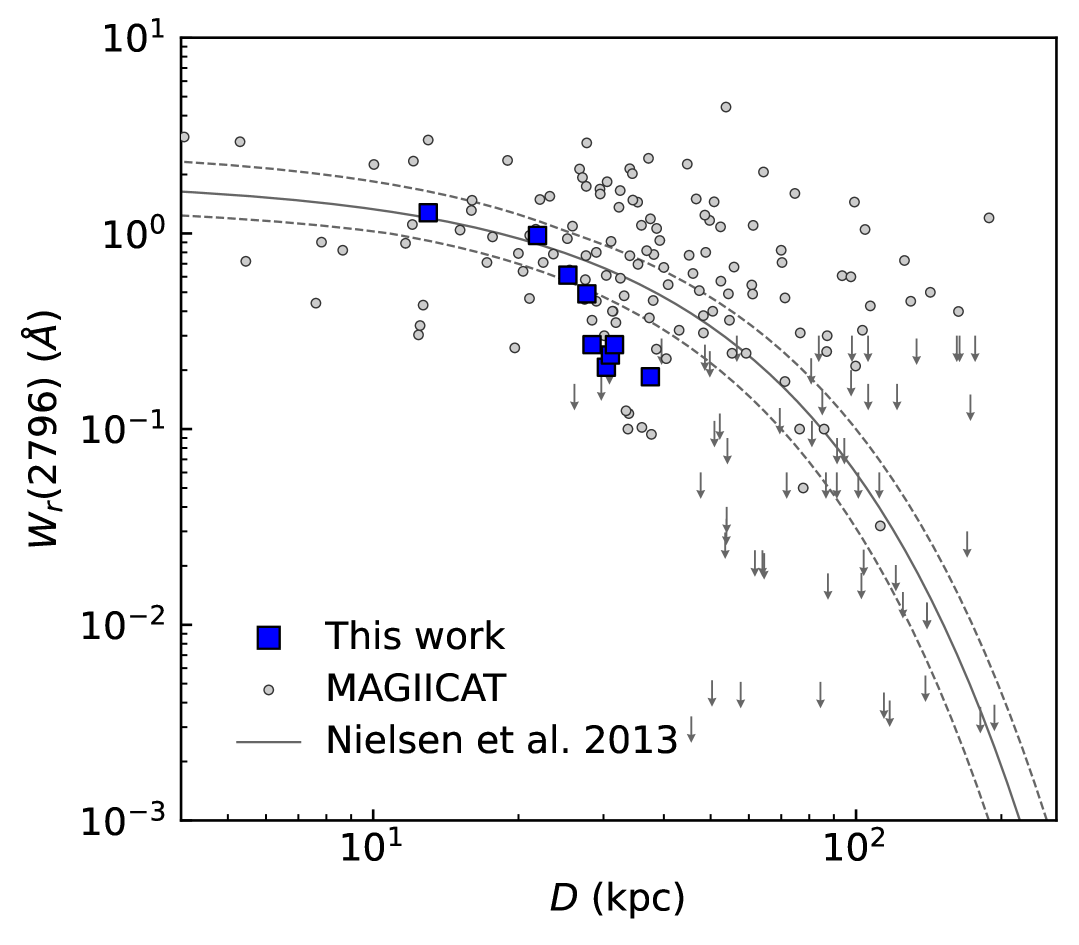
Figure 1 further shows the Mg ii absorption strength for the 9 galaxies (). For reference we also show the MAGiiCAT magiicat2; magiicat1 catalogue along with their fit to the data. Our sample shows the similar trend of decreased Mg ii rest-frame equivalent width with increasing projected galaxy-quasar separation (). The sample is consistent within the scatter of the MAGiiCAT data. Some of the larger impact parameter systems seem to reside below the MAGiiCAT data, but this may likely be attributed our sample being major axis systems, where weaker absorption tends to reside bordoloi11; lan18. We will present cloud properties of all the multi-phase absorption in future works, which will focus on the detailed analysis of the absorption properties.
3.2 Galaxy Gas–CGM Kinematic Comparison
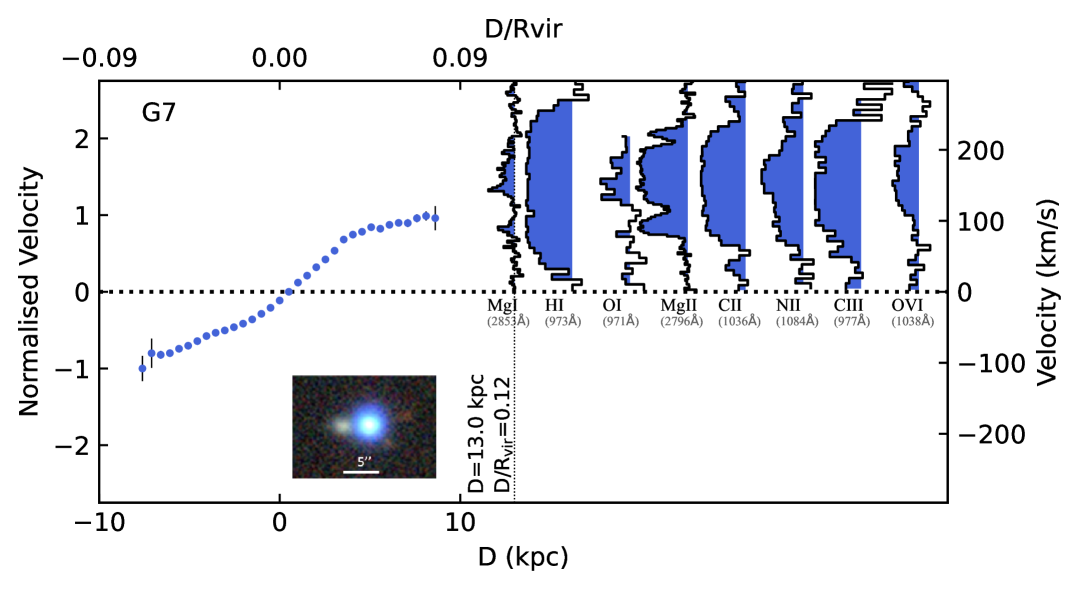
Here we explore how the galaxy’s ISM rotation direction and speed corresponds to the kinematics of the CGM found along the quasar sightlines. Figure 2 shows an example of this kinematic comparison for galaxy G7. The colour image of G7 and the quasar is shown in the lower left of the figure. The blue circle data points show the rotation curve of G7 with the y-axes showing both the line-of-sight velocity in km s-1 (right-side) as well as the peak rotation-normalised velocity (left side). The x-axes show the projected distance from the galaxy towards the quasar in kpc (; lower axis) and in virial radius-normalised distance (; top axis). The halo virial radius are calculated following the formalism of bryan98. The direction towards the quasar is in the positive x-axis direction and the direction of galaxy rotation towards the quasar is in the positive y-axis direction above the horizontal dashed line; e.g., the top half of the panel. This relative galaxy-quasar orientation applies to all figures for all the other galaxies (Figures 3, 10, 11, 12, 13 14, 15, 16). The vertical dotted line shows the projected distance of the quasar, which is also labelled. At the projected distance of the quasar, the spectra of individual CGM absorption lines are shown vertically in order of increasing ionisation potential (the ionisation energy required to remove an electron from the neutral atom to create the ion) and are offset for clarity. Not all of the absorption lines detected in the quasar spectra are shown, but we have chosen to display a subset that are common for each galaxy (Mg i, H i, O i, Mg ii, C ii, N ii, C iii and O vi). Mg i and Mg ii are from UVES data and have higher spectral resolution ( km s-1) compared to the other ions obtained with COS ( km s-1). Example galaxies G7 and G8 are shown in Figures 23, with the remaining galaxies shown in Figures 1016.
Directly comparing the ISM to the CGM, Figure 2 shows galaxy G7 rotating at km s-1 in the direction of the quasar. G7 is located at kpc, or , from the quasar sightline. The CGM is detected in all ions displayed. Given the full Lyman series is covered in the COS spectra, from Ly blueward, we select a higher-order Lyman transition to display (Ly) to further show velocities that the larger optical depths reside at and the kinematic spread of the H i. The CGM is found to be rotating in the same direction as the galaxy, regardless of the ion selected, and all of the CGM is found to one side of the galaxy systemic velocity. The Mg i absorption exhibits two main velocity components; one slightly lower than the rotation speed of the galaxy and another component at velocities higher than the rotation speed. Future ionisation modelling work will aim to determine whether the physical properties of those different components differ or not. The Mg ii absorption is broader with additional velocity components and has a velocity range of km s-1. This is similar to what is found for other ions, with C ii and C iii having larger velocity spreads and are all in the same direction of rotation of the galaxy.
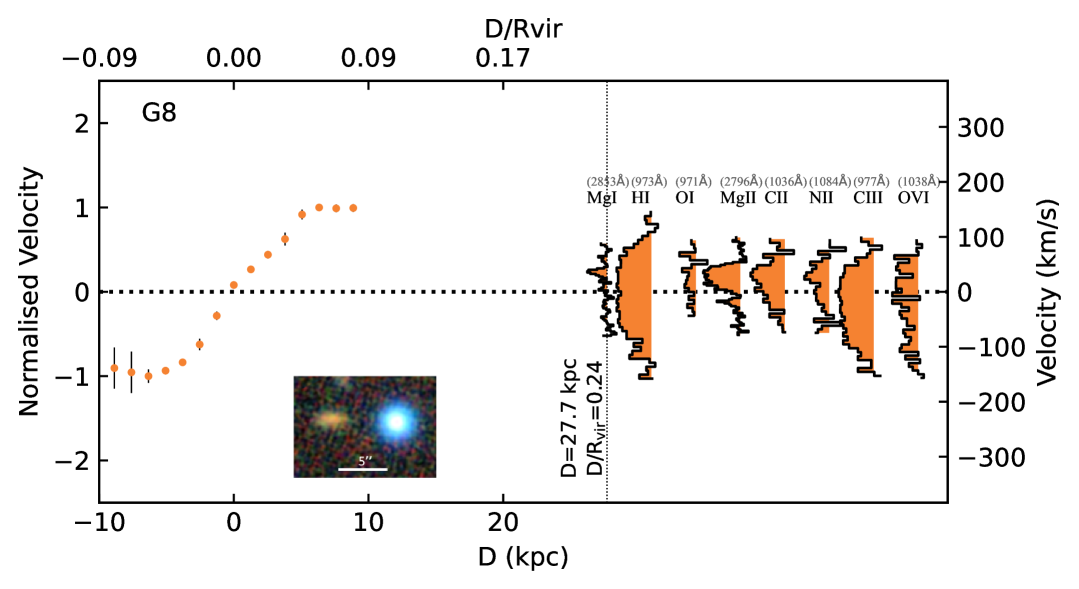
Figure 3 shows the higher impact parameter galaxy G8, located at kpc () from the quasar sightline, rotating at km s-1 in the direction of the quasar. Again, the direction of rotation towards the quasar is in the upper half of the figure.
Although the quasar sightline is at a larger impact parameter compared to G7, all the ions are detected. However, the CGM absorption associated with G8 is weaker than G7, which is consistent with the general anti-correlation between equivalent width and impact parameter.
For G8, we find that velocities of Mg i and O i are in the same direction of the galaxy rotation with velocities lower than the galaxy rotation speed. The Mg ii, C ii, and N ii have at least two components; the largest optical depth component is consistent with the rotation direction of the galaxy towards the quasar sightline, while the lower column density component is inconsistent with rotation. The H i, C iii and O vi span the systemic velocity on both sides, with a preference to being opposite to the direction of rotation. Thus, in this example, while the highest optical depth gas is consistent with the rotation direction of the galaxy, there is some absorption that is disconnected with the rotation of the galaxy and this is most apparent in the high ions.
Similar trends are seen for the remaining galaxies shown in Figures 1016 in the Appendix with a discussion of each individual galaxy and CGM. In the remainder of the paper, global kinematic trends will be discussed.
3.3 Escaping or bound?
While studies have shown that the majority of multi-phase CGM appears to be gravitationally bound to galaxies, there are a small fraction of absorption systems that do have optical depth-weighted velocity centroids, or higher velocity absorption wings, exceeding the escape velocity (tumlinson11; bordoloi14; kacprzak19kine; huang21; dutta25, e.g.,). Here we explore the kinematics of major axis absorption relative to the escape velocity.
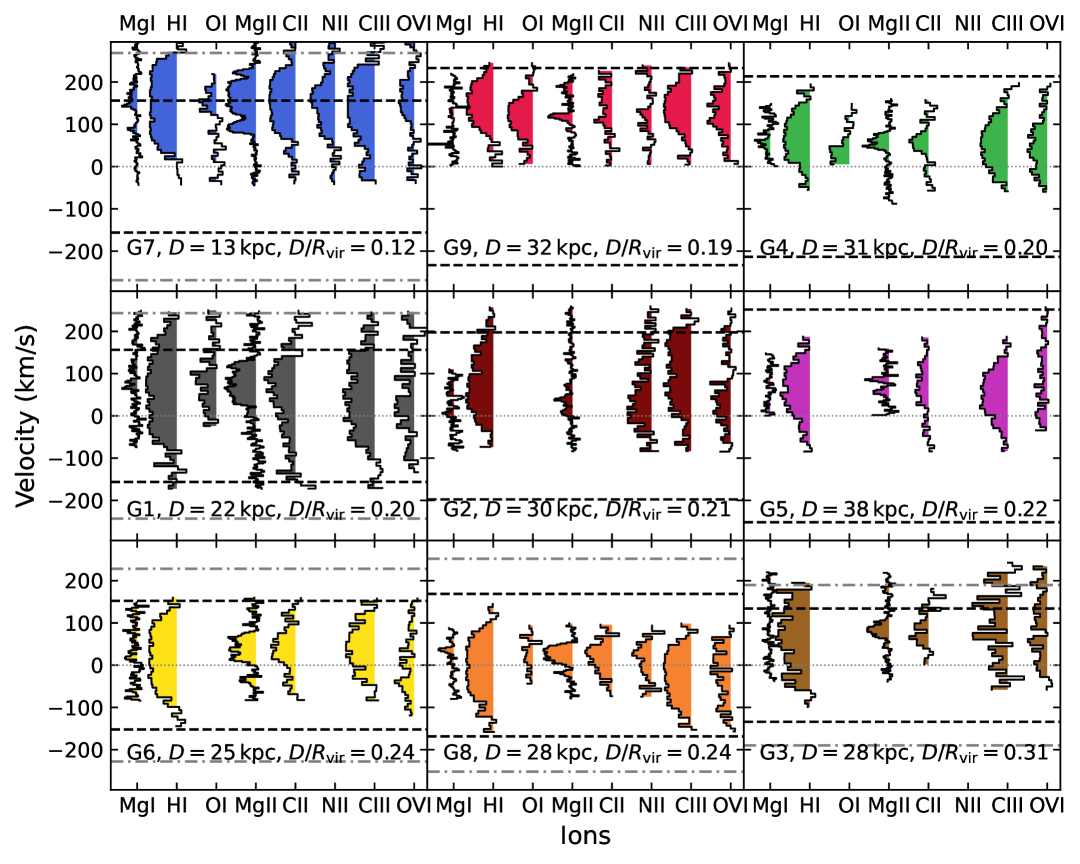
Figure 4 shows the escape velocities for each galaxy, calculated both at the virial radius (black dashed lines) and at the impact parameter distance (grey dashed-dotted lines). The nine panels show different galaxies, labelled G1 to G9, with galaxies ordered in increasing from left to right, top to bottom. Galaxies in the figure without grey dashed lines have escape velocities at exceeding the plotted range of km s-1 (G2, G4, G5, and G9). The vertical axis represents the line of sight velocity in km s-1, and the x-axis corresponds to ions observed. Positive velocities are in the direction of galaxy rotation towards the quasar.
First we examine the CGM relative to the escape velocity at the virial radius. Eight out of nine galaxies have all their low ionisation CGM (Mg i to C ii) below the escape velocity. The one exception is G7, which has a large fraction of the absorption above the escape velocity (this is also the lowest impact parameter system with kpc, ). For the higher ionisation CGM (C iii and O vi) and H i, three out of nine galaxies (G7, G1 and G3) have absorption velocities slightly above the escape velocity. Thus except for G7, 8/9 (89%) all of the low ionisation gas is bound to the halo while higher ionisation gas is bound to the halo for 6/9 (67%) galaxies.
We further compare the CGM to the escape velocity at for each galaxy, which is indicated by the grey dashed line. If this gas is in an extended disk or accreting co-planar filament, then the assumption of the CGM being near or at is not unrealistic. Assuming that the CGM is at or near within the halo, then Figure 4 demonstrates that all of the gas is bound to the galaxy in all cases and for all gas phases. Thus, it seems likely that all of the detected CGM absorbers are bound to the galaxy in each case.

3.4 Co-rotation Statistics as a Function of
3.4.1 Stacked spectra
We investigate the general kinematic trends as a function of . We split the sample into lower (G1, G4, G7, G9) and higher (G2, G3, G5, G6, G8) subsamples, having mean and standard error in the mean values of () and (), respectively.
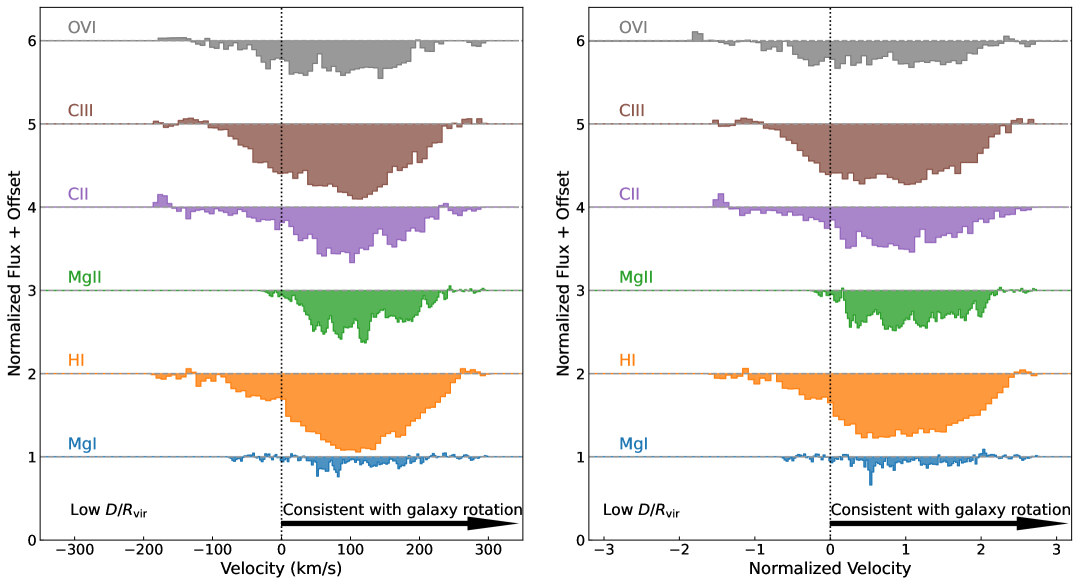
Figure 5 shows the stacked spectra of the Mg i, H i, Mg ii, C ii, C iii and O vi absorption lines for the low sample. The spectra are arbitrarily offset from each other along the y-axis in order to compare their kinematic structure. Positive velocities align with the galaxy’s rotation direction, where the left panel shows the line-of-sight velocity and the right panel shows velocities relative to the maximum galaxy rotation speed. In this latter case, each spectrum was normalized to its own galaxy rotation velocity and then combined afterwards, making for a fairer comparison between objects. At low , the Mg i and Mg ii are fully aligned with the direction of rotation of the galaxy, while spanning up to two times the maximum rotation speed of the galaxy.
It appears as if HI comprises multiple components based on the low ionisation absorption structure, with the strongest component centred at km s-1 (or a normalized velocity of unity), while the weaker one is in the opposite direction, counter-rotating at km s-1 (or a normalized velocity of 0.25). However, another possible scenario is that there is a broader, weaker component at the systemic velocity ( km s-1) that is overlapped by the stronger co-rotating components. This similar spectral shape is also seen for C ii, C iii and O vi, as these ions have a minority of their absorption in the opposite direction of rotation.
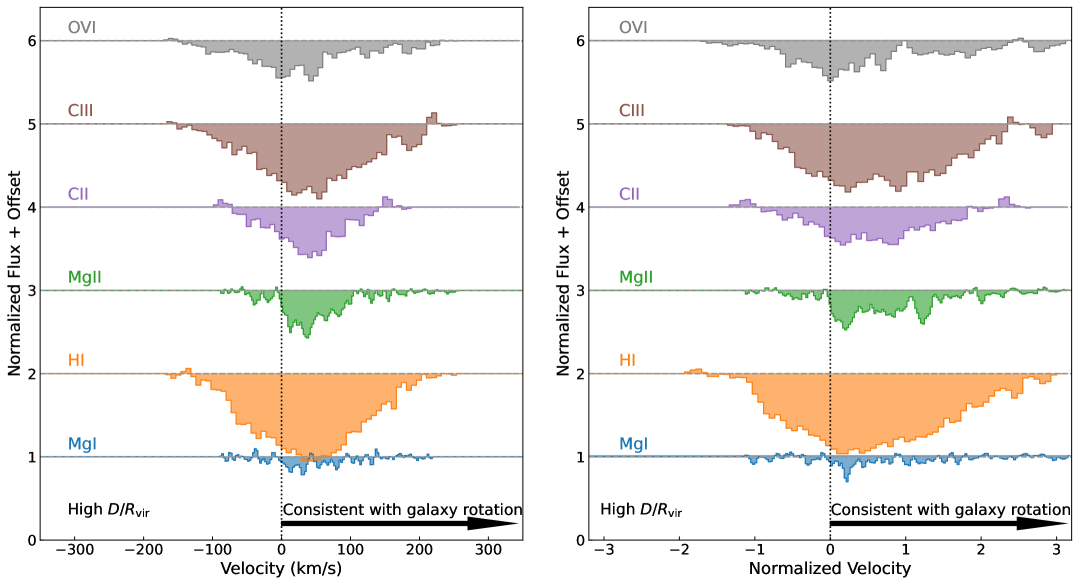
Figure 6 is the same as Figure 5, except the data are for the galaxies at larger . In contrast to the low sample, Mg ii and possibly Mg i have a small fraction of absorption in the opposite direction of rotation. Furthermore, most of their optical depth is located at lower velocities closer to systemic. H i exhibits a broad single absorption profile centred around 50 km s-1 and has more absorption on the opposite side of the galaxy rotation direction compared to the low sample. C iii and O vi follow the same kinematic spread and centroid trends as the H i.
Overall, we find that most absorption is consistent with the direction of rotation of the galaxy along the quasar sightline. However, sightlines at larger impact parameters tend to be less aligned with the direction of rotation, and this is most apparent for H i, C iii and O vi. We next quantify the absorption profile centroids and widths in Section 3.4.2 and the absorption co-rotation fraction in Section 3.4.3.
3.4.2 Velocity centroids and widths
We compute the optical depth weighted velocity centroids and the velocity widths corresponding to 50% () and 90% () of the total optical depth for each ion in the stacked low and high bins. To compute the uncertainties in our measurements and to account for sample variations, we employed a bootstrap resampling approach. We generated 1000 resampled stacked spectra for each of the low and high bins, then measured the velocity centroid and velocity width of each stacked spectrum for each ion. From the resulting bootstrap distributions, we computed the median and adopted the 16th and 84th percentiles of the bootstrap distributions as the uncertainties.
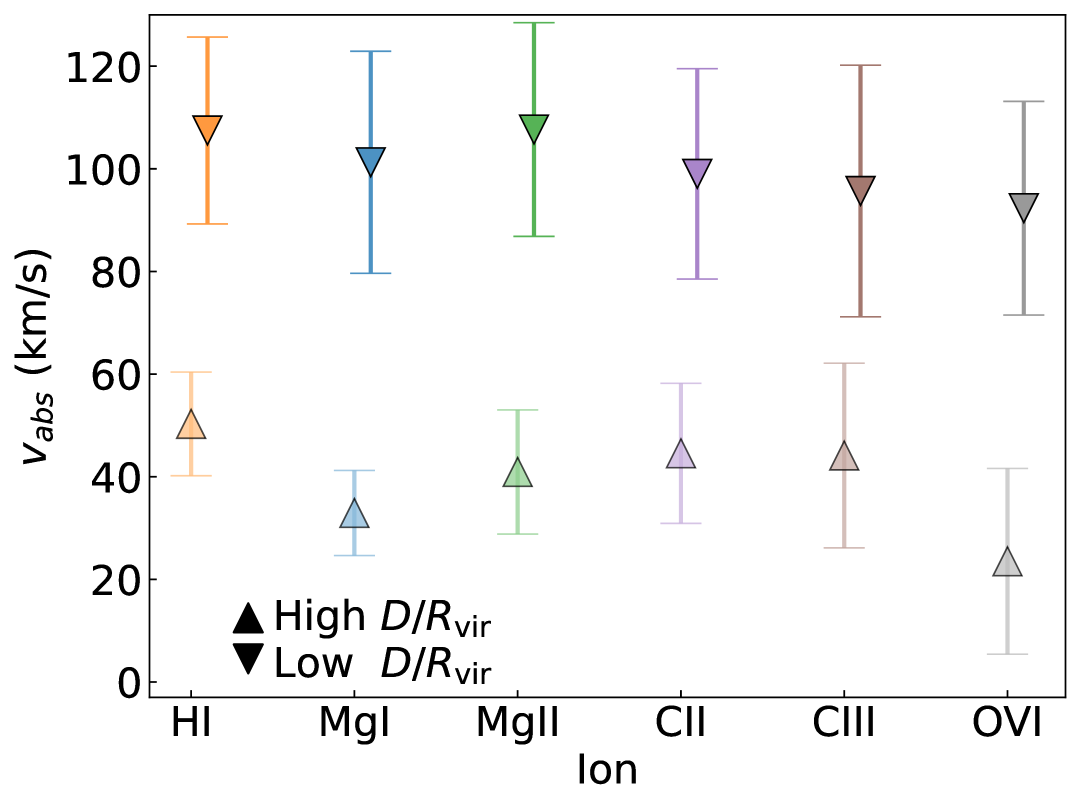
Figure 7 shows the optical depth weighted velocity (left) and the optical depth weighted normalized velocity, based on the maximum rotation speed of each galaxy, (right) for each ion for low () and high () bins obtained from the bootstrap analysis. At low , the optical depth weighted velocity for all ions is consistent with 110 km s-1 with no apparent shift between ions. For high , the optical depth weighted velocity decreases by a factor of 2.75 to 40 km s-1. O vi is found at a lower velocity of km s-1, which is a decrease of a factor of 4.8 compared to O vi at low .
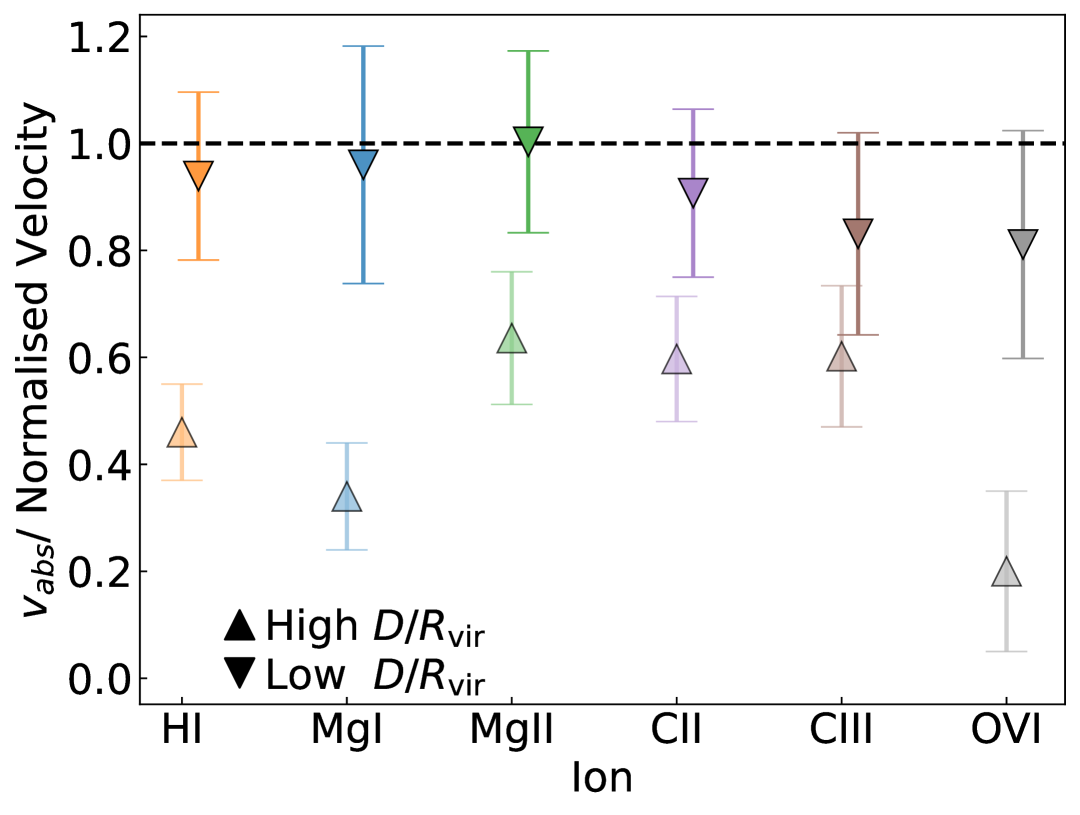
Figure 7 (right) shows the the optical depth weighted normalized velocity with the dashed line indicating the maximum normalized rotation velocity of the galaxies. At low , the bootstrapped optical depth weighted velocity for all ions is consistent with the rotation speed of the galaxy, exhibiting the strongest connection between the galaxy rotation and the CGM absorption, although C iii and O vi could potentially be at lower velocities. For high , the normalised velocity decreases to , within O vi having the lowest value at . Thus, overall, we find that the kinematic connection between the CGM and galaxy can drop as much as a factor 2.75 in velocity, or by a factor of 1.7 when considering the normalised velocity between low and high .
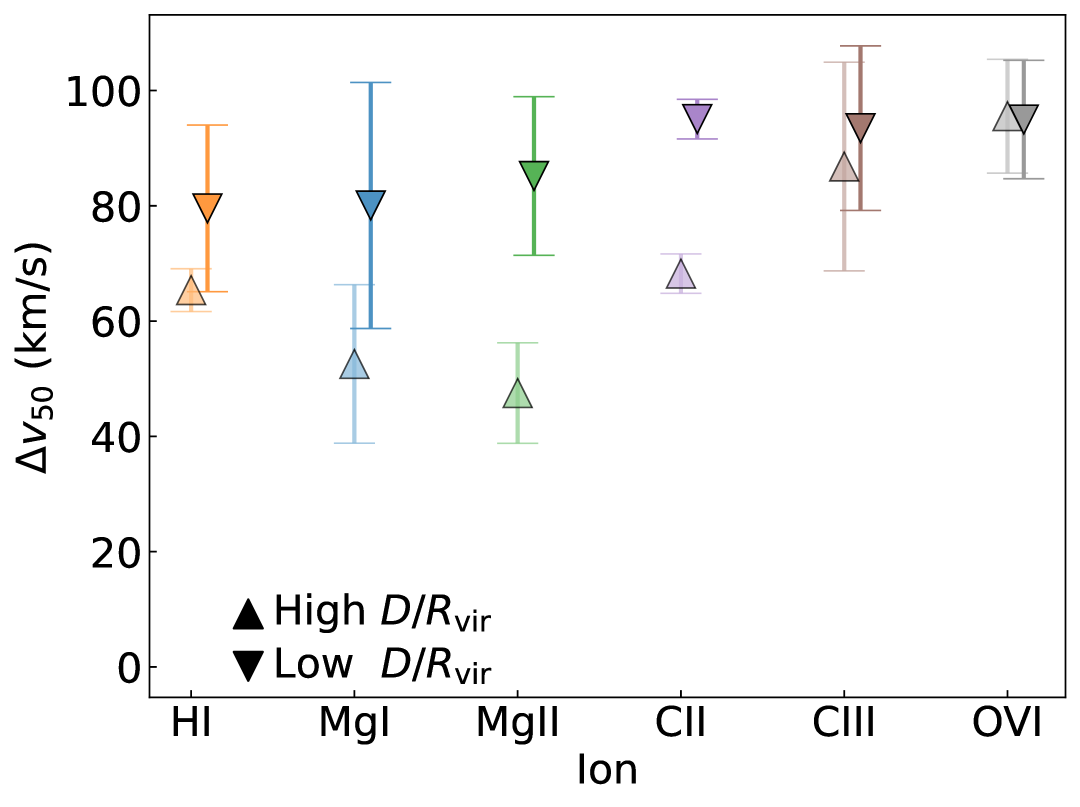
While the optical depth weighted velocity is informative on the alignment of the bulk of the CGM with the galaxy, the and better quantify the kinematic spread of the absorption. Figure 8 shows the (left) and (right) for the bootstrapped stacked spectra as a function of and ionisation. Both Mg ii and C ii point to the larger closer to the galaxies. At low , the Mg ii km s-1 while at high its km s-1, which is a factor of 1.8 decrease from low to high . It also appears that the increases with increasing ionisation Mg i to O vi, indicating the higher ionisation gas has larger velocity dispersions. This increase is strongest in the high bin. We find no change for both C iii and O vi with distance, where remains large for these highest ionisation gas tracers.
Figure 8 shows the (right) for the bootstrapped stacked spectra as a function of and ionisation. exhibits a similar trend to that seen for . appears to be broader at low with a flat or shallow slope with increasing ionisation. This slope becomes steeper at high , with no change for both C iii and O vi with distance.
Overall, we find that the CGM closer to the galaxy more closely follows the rotation of the galaxy for all ions, while having larger and values compared to gas found further from galaxies. O vi appears to show the most disconnect from the galaxy kinematics.
3.4.3 Co-rotation fraction
To further quantify how much absorption is consistent with the rotation of the galaxy, we employ the method developed by nateghi24GFI and nateghi24GFII. The equivalent width co-rotation fraction is defined as the fraction of the total equivalent width in the direction of the galaxy rotation such that:
where is the continuum‐normalized flux at velocity relative to the systemic velocity , and and are the minimum and maximum velocities over which significant absorption is detected. All absorption with (i.e. sharing the sign of the galaxy’s rotation) is counted in the numerator, while the denominator includes the full velocity range of the line profile. By construction, , since any counter‐rotating absorption () contributes only to the denominator. Thus indicates that 100 percent of the absorption lies on the co‐rotating side, and indicates none does.
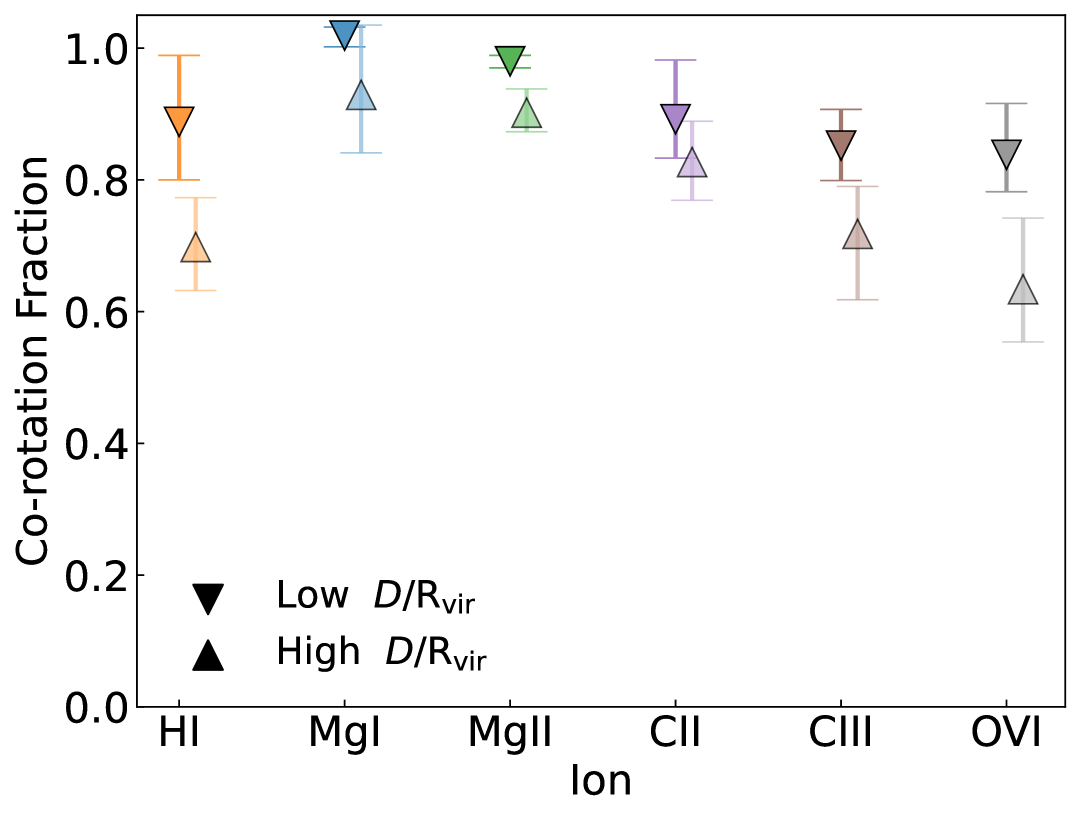
Figure 9 (left) shows the bootstrapped co-rotation fractions on the stacked absorption for the low () and high () bins. Again, to compute the 1 uncertainties in our measurements and to account for sample variations, we generated 1000 resampled stacked spectra for each of the low and high bins.
For low , the co-rotation is above 0.8 for all ions. There is an anti-correlation between the co-rotation fraction and ionisation energy, where Mg i and Mg ii are the highest and consistent with a unity co-rotation fraction, while O vi has a co-rotation fraction of 0.84. This results in a (Mg ii–O vi) change of nearly 16% from the cool to the warmer phases. For the high bin, the co-rotation fraction for each ion drops relative to the low bin. Mg ii decreases from unity to 0.90 when going to larger . The other ions show similar decreasing trends, with O vi decreasing to 0.63. This results in a (Mg ii–O vi) change of 26% from the cool to the warmer phase.
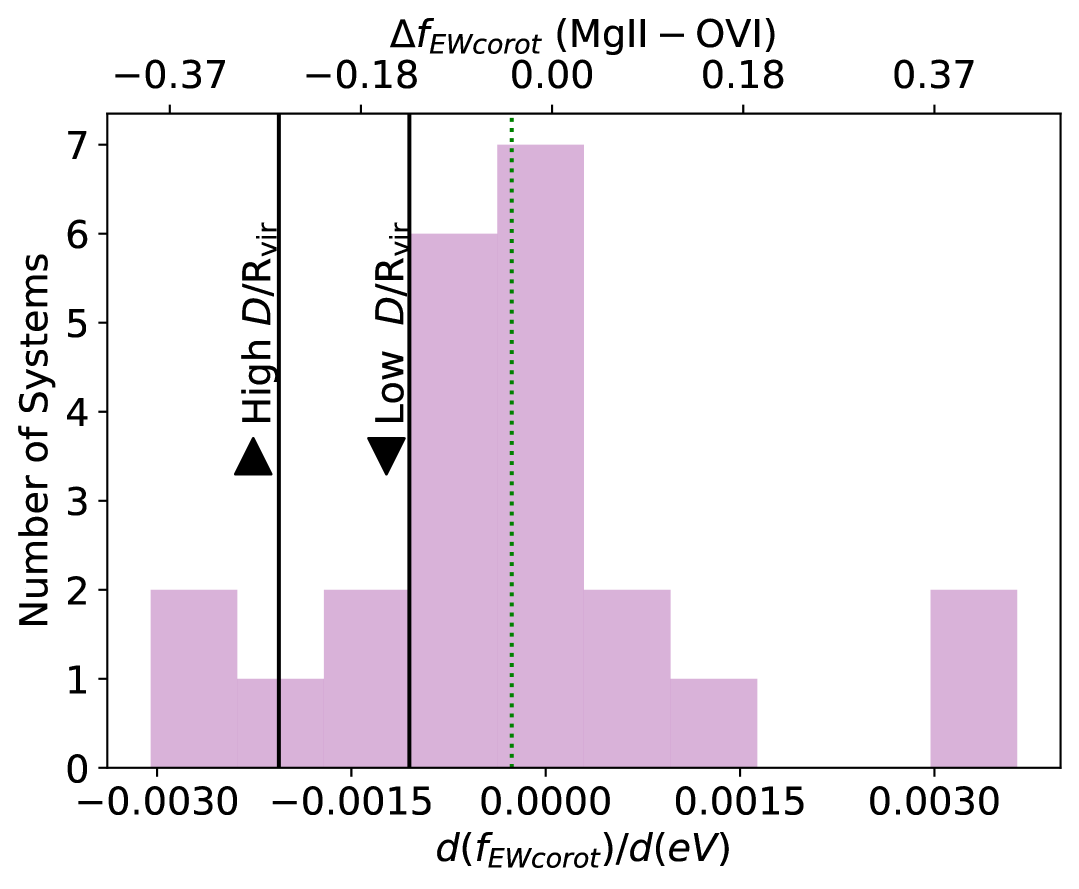
We compare our (Mg ii–O vi) to those reported by nateghi24GFII. Figure 9 (right) shows the distribution of (Mg ii–O vi) of all the galaxies from nateghi24GFII as a pink histogram. Their galaxies span a range of azimuthal and inclination angles. They reported that on average, galaxies tend to have a decreasing correlation (negative slope) of the co-rotation fraction with increasing ionisation, i.e., Mg ii is more coupled to the galaxy rotation compared to O vi. Here we find the same trend for our stacked sample and further note that (Mg ii–O vi) decreases with distance from the galaxy. Also shown in Figure 9 is the slope measured for the low and high bins indicated by the vertical lines and labels. While low is more consistent with the mean of their distribution (vertical green dotted line), the high sample is consistent with the more extreme systems in their sample. This is consistent with the previous subsection where O vi becomes less kinematically coupled to the galaxy at larger distances.
4 Discussion
Our results support a kinematic connection between the multi-phase CGM gas and host-galaxy disk rotation, with that coupling decreasing for higher-ionisation gas and at larger distances. In the low regime Mg i, Mg ii, C ii, C iii and O vi absorption are predominantly consistent with a co-rotation model, matching galaxy rotation speeds, tracing an extended, rotating gaseous structure beyond the ISM. At larger distances, this connection weakens for all ions with the largest change noted for O vi and H i absorption, with O vi having velocities 4.8 times slower than the rotation speed of the galaxy, whereas Mg ii is slower by a factor of 2.75. This indicates that while the low-ionisation CGM remains more kinematically coupled to the galactic disk, with some decrease with distance, the high-ionisation phase decouples faster with . It must be noted that the optical depth weighted median absorption velocity for all ions is still consistent with the rotation direction of the galaxy, indicating that most of the multi-phase gas is consistent with a co-rotation/accretion model. However, for O vi and H i we find larger fractions of absorption at velocities in the opposite direction of rotation.
We observe a pronounced kinematic transition in the CGM over a narrow range of from 0.1 to 0.3. magiicat3 demonstrated that the mean Mg ii equivalent width is essentially invariant with halo mass for . In their MAGiiCAT sample, the drop in Mg ii equivalent width at is more pronounced in lower mass halos () and shallower in higher mass systems, implying inner CGM self-similarity across mass and an outer halo cool gas depletion that scales with halo mass. Project AMIGA observations of M31 further show that within (corresponding to 30 kpc) low and intermediate ionisation column densities remain high and co-rotating, while beyond low ionisation column densities fall steeply while O vi declines more gradually lehner25. This is similar to our results showing strong low ionisation co-rotation to and an O vi decoupling beyond.
Theory predicts these scales naturally. Inflows shock to the virial temperature once a stable virial shock forms, expected for , leading to suppressed cold-mode accretion beyond as cooling times lengthen birnboim03; dekel06. Filamentary cold streams dominate the inner halo but diminish in mass flux with both increasing radius and halo mass keres05; vandevoort11. FIRE-2 zoom-in simulations pin down the cooling flow radius at , where hot (K) inflow rapidly cools and becomes rotationally supported hafen22. trapp22 showed that, within this cooling radius, the co-rotational support dominates ( km s-1), whereas radial transport is negligible ( km s-1). Beyond the hot, pressure-supported CGM fails to corotate fully hafen22; trapp22. Similarly, stern21 show that the CGM first virialises outside‐in, achieving hot, quasi-static conditions from inward to , with the inner CGM only becoming long-lived and pressure-supported once .
In COS–EDGES, our low and high samples have identical mean halo masses log and log, confirming that the observed drop in co-rotation fraction and at reflects a radial dependence and not a mass dependence. Anchoring our kinematic boundary at to the self-similar MAGiiCAT results and AMIGA’s inner-CGM mapping yields a unified picture: the inner halo is fed by high angular momentum cold flows and recycled fountains, while beyond , diminished cold supply and the rise of a hot, pressure-supported phase produce the weakened rotation signatures, especially in O vi.
Our results further contribute to low ionisation Mg ii kinematic studies that show the CGM commonly co-rotates along the major axes of galaxies, even extending to angles well beyond the major axis plane, out to impact parameters of kpc steidel02; kacprzak10; kacprzak11kin; bouche13; bouche16; diamond-stanic16; ho17; rahmani18; martin19; lopez20; nateghi24GFII. nateghi24GFII further examined the multi-phase CGM around 27 galaxies and found that low-ionisation CGM is more kinematically consistent with the galaxy rotation than high-ionisation gas and showed a monotonic decline in the fraction of co-rotating gas with increasing ionisation potential. However, these results were based on a range of galaxy properties and galaxy-quasar geometries. Here, for our more restrictive edge-on major axis sample, we also find a drop of % in equivalent width co-rotation fraction between Mg ii and O vi, consistent with those reported by nateghi24GFII.
We find that the velocity widths corresponding to 50% of the total optical depth () increase with increasing ionisation potential at high . The values also increase as the gas is found closer to the galaxy, with the exception of O vi, which has a constant (and ) regardless of distance. This is consistent with nielsen17 who showed that velocity widths of Mg ii absorption are narrower and dependant on properties such as azimuthal angle and galaxy colour, compared to O vi which exhibits similar velocity widths with no dependencies. These results suggest that O vi likely probes an outlying, dynamically hot component of the halo that does not participate in the disk’s rotation at large radii and traces the galaxy mass better, since the O vi ion fraction peaks near K, close to the virial temperature of systems, making it a sensitive tracer of the halo potential oppenheimer16; ng19; dutta25. This was further demonstrated in simulations, where O vi was found to trace both accreting/co-rotating gas as well as the diffuse component within the halo kacprzak19kine or even residing in the IGM ho21; bromberg24.
werk16 showed that O vi absorbers separate into two distinct kinematic families. The first, the narrow/low ionisation–aligned class, contains O vi absorption that has Doppler parameters km s-1 and centroid offsets km s-1 from the low-ion absorption. The second, the broad/no low ionisation class, contains O vi components with no accompanying low ions, with km s-1 and velocity offsets up to km s-1. werk16 interpret the former as multi-phase material moving coherently with the cool gas as either planar inflow or recycled fountain flow, whereas the latter traces hotter, turbulent coronal gas ( K) that is kinematically decoupled from the disk. Our COS–EDGES sight-lines at , where O vi is narrow and more closely velocity-matched to Mg ii/C ii, match well with the narrow/low–aligned population. In contrast, the broader, more symmetric O vi wings that dominate beyond are consistent with their broad/no–low population.
Our results agree with earlier work by kacprzak19kine, who found that O vi detected along galaxy major axes shows little correlation with disk rotation; indeed, most of their sight-lines were at larger radii (), where we see a weaker kinematic coupling to the galaxy. More recently, ho25 demonstrated that while individual O vi components need not trace the exact disk rotation curve, the bulk of the O vi gas almost never counter-rotates. In their sample, O vi tied to low-ion gas (Si ii/Si iii), typically probing the inner CGM, was almost exclusively co-rotating, whereas O vi without low-ion counterparts (typically tracing more distant gas) shows a much higher incidence of counter-rotation and random motions. Up to of low-ion absorbers lack sufficient angular momentum for a stable orbit, compared to only of O vi absorbers. Together, these results extend and reinforce our picture of a co-rotating, inflowing inner CGM and a more turbulent, kinematically decoupled outer halo. In addition, detailed cloud-by-cloud analyses indicate that broad O vi at large radii arises in discrete, collisionally ionised structures embedded within a hotter, more tenuous medium; in lower-mass halos, this ambient medium may be too hot or diffuse to produce strong O vi by itself sameer24. This is supported by simulations that predict that for systems, O vi is produced in localised warm-hot clouds or interface layers, while the volume-filling phase is hotter ( K) and traced by higher ions or X-rays oppenheimer16; nelson18; bradley22.
These previous works support our radius–dependent results where O vi likely originates from two distinct environments: narrow, low-ion-aligned gas that co-rotates with the disk, and broad, low-ion–free gas that is hotter, kinematically decoupled, arises in discrete collisionally ionised structures embedded within a hotter halo. The fact that we observe O vi co-rotation fraction of %, with a optical depth-weighted median velocity matching the rotation speed of the galaxy, at low suggests that near the galaxy, even this hot/warm medium can be partially entrained by the disk’s gravitational potential or by mixing with inflow. However, at larger radii, O vi becomes increasingly decoupled and could arise in discrete, collisionally ionised substructures, warm volume-filling gas, and/or from the IGM.
Overall, the kinematic signatures detected in our sample, combined with the major axis geometry, favour a cold‐accretion scenario in the inner halo. Cosmological simulations consistently show that filamentary inflows carry high specific angular momentum into galaxy halos and settle into extended, rotating structures. In zoom‐in simulations, cold‐mode gas delivers three to four times the dark‐matter angular momentum and forms coherent cold‐flow disks tens of kiloparsecs across stewart11; stewart13; stewart17; oppenheimer18b. The EAGLE simulations demonstrated that this cool inflow remains confined to the galaxy plane, co‐rotating with the disk out to kpc ho19, and TNG50 simulations reproduce inspiralling streams around halos nelson20. FIRE particle‐tracking further reveals that freshly accreted IGM gas enters the outer disk already in rotation, confirming that pristine filaments directly feed galactic disks hafen19; hafen22; trapp22. Cosmological zoom-in simulations further indicate that inflowing gas approaches Milky Way–mass disks with angular momentum comparable to that at the disk edge and low radial velocities, settling into extended, co-rotating structures tens of kiloparsecs across before slowly transporting inward at km s-1 to fuel star formation trapp22. Such extended cold-flow disks naturally produce the strong co-rotation signatures at seen in COS–EDGES, where optical-depth–weighted velocities match disk rotation. The slow radial inflow implies that beyond , gas retains only partial kinematic coupling, consistent with the observed drop in and co-rotation fraction. In addition, feedback-driven torques and spiral-arm oscillations in simulations generate multi-component, turbulent profiles in the inner halo trapp22, matching the broader widths we observe close to galaxies. While we do detect these kinematic signatures, galactic fountains enrich and recycle CGM gas in a similarly co‐rotating fashion (marinacci10; marasco2012; fraternali17; armillotta16; grand19, e.g.,).
In FIRE and Auriga simulations, star‐formation–driven outflows launched along the minor axis cool and fall back toward the disk, spinning up as they reaccrete and forming metal‐rich, planar inflows angles17; muratov17; marinacci19. Idealized models of hot‐mode accretion show that mixing between fountain ejecta and ambient corona can transfer angular momentum back into the returning gas stern24, so that even recycled material rejoins the disk with significant rotation. These fountain flows complement the cold filaments by sustaining a multi‐phase, co‐rotating inner halo. If some of the detected low-ion gas originates from past outflows that have cooled and re-accreted, it would likely be metal-enriched peroux20; weng24. Simulations also predict that co-rotating inflow near the disk should exhibit lower metallicities compared to recycled fountain gas hafen19; hafen22; trapp22, suggesting future metallicity measurements of co-rotating CGM absorbers could distinguish between pristine and recycled channels feeding galaxies. Interestingly, recent work by nateghi24GFII identified major axis co-rotating low-ion gas with lower metallicity, which may trace more pristine inflow along cosmic filaments, whereas co-rotating gas with higher metallicity may signify recycled, co-planar accretion of prior outflows. Thus, it is possible that both scenarios may be occurring in our sample and our future works will address these key questions by quantifying the cloud-by-cloud properties (sameer24, e.g.,), including metallicities and by performing detailed kinematic modelling.
5 Conclusions
We introduce the COS-EDGES survey, which presents a new sample of absorption line systems observed with COS/HST and VLT/UVES to address how multi-phase gas flows toward galaxies from the CGM. Our selected sample consists of , isolated, edge-on, emission-line galaxies with a background quasar located along their major axis between kpc and . In paper introducing this sample, we examine the kinematic connection between the galaxies and their multiphase CGM, with a focus on how the kinematics change with increasing . Our results can be summarised as follows:
-
•
For individual systems, most of the absorption is consistent with the galaxy’s direction of rotation. Low ionisation absorbers appear to more consistently align with disk rotation, but several galaxies (e.g., G1, G2, G4, G6, G8) show high-ion absorption that are misaligned or counter-rotating. Misalignment appears to increases with increasing distance from the host galaxies.
-
•
The multiphase CGM gas appears to be gravitationally bound. Low ionisation gas in eight of nine galaxies, and high ionisation absorption in six of nine galaxies, occurs below the escape velocities calculated at the virial radii. For all ions, the CGM is within the escape velocities calculated at the impact parameter for each system, showing that all of the CGM appears to be retained by the halo potential.
-
•
At low (, ) the stacked profiles Mg i and Mg ii exhibits single-sided, rotation-matched profiles, while H i, C ii, C iii and O vi have a small amount of absorption in the opposite direction of rotation.
-
•
At high (, ) the stacked profiles broaden and become more symmetric about systemic velocity, but Mg ii and Mg i still show a dominant co-rotating component. In contrast, O vi and H i exhibit substantial absorption on both sides of the galaxy systemic velocity, indicating a weaker rotational connection to the disk.
-
•
The optical depth weighted median velocity, , is 110 km s-1 for all ions within the inner halo, but drops to 40 km s-1 at larger , with the largest drop for O vi at km s-1. When normalised to the maximum rotation of the galaxy, all ions are consistent with that velocity at low , but decrease to about 60% of the maximum rotation speed for the low ionisation gas and 20% for O vi.
-
•
The 50%-optical-depth width () for low ions (e.g., Mg ii, C ii) is up to times larger in the inner halo compared to the outer, indicating a more turbulent or multi-component medium near the galaxy. The does not change with distance for the high ions (C iii and O vi). The 90%-optical-depth width () shows a modest decline with radius for low ions while C iii and O vi remain unchanged. At high , and increases with increasing ionisation potential.
-
•
The equivalent width co-rotation fraction declines systematically with both ionisation potential and radius: from unity to 0.93 for Mg ii from the inner to outer halo and from 0.84 to to 0.63 for O vi. We find that the slope, , becomes steeper at large , which further supports the picture of a radially-stratified, multi-phase CGM.
These results are suggestive of a picture in which dynamically broad co-rotating multi-phase gas dominates the inner CGM, possibly tracing extended inflow or recycled accretion streams, whereas the outer CGM is characterised by a lower relative velocity dispersion component that is more weakly aligned with the rotation of the galaxy. The warm phase (O vi) lags the most and could be composed of co-rotating, lagging and volume-filling components. This program sheds light on these radial differences and the complex pathways by which galaxies exchange mass and angular momentum with their CGM. Future work will examine a comparison between the galaxy ISM and CGM metallicities, gas flow models using higher resolution imaging and CGM mapping in emission to further address how galaxies acquire their gas.
Acknowledgments
This work is dedicated to the memory of Jacqueline Bergeron, whose pioneering research on the galaxy-CGM absorption connection inspired and paved the way for a multitude of studies such as ours. Some of the data presented herein were obtained at the W. M. Keck Observatory, which is operated as a scientific partnership among the California Institute of Technology, the University of California, and the National Aeronautics and Space Administration. The Observatory was made possible by the generous financial support of the W. M. Keck Foundation. Observations were supported by Swinburne Keck program 2022B_W200. The authors wish to recognize and acknowledge the very significant cultural role and reverence that the summit of Maunakea has always had within the indigenous Hawaiian community. We are most fortunate to have the opportunity to conduct observations from this mountain. Some of the data presented herein were based on observations collected at the European Organisation for Astronomical Research in the Southern Hemisphere under ESO programmes 105.20FN.001, 105.20FN.002 and 108.22F4.002. This paper includes data gathered with the 6.5 meter Magellan Telescopes located at Las Campanas Observatory, Chile.
Funding Statement
This work was supported by Space Telescope Science Institute grant HST-GO-17541, which funded BDO and CWC.
Data Availability Statement
The data underlying this paper will be shared following mutually agreeable arrangements with the corresponding authors.
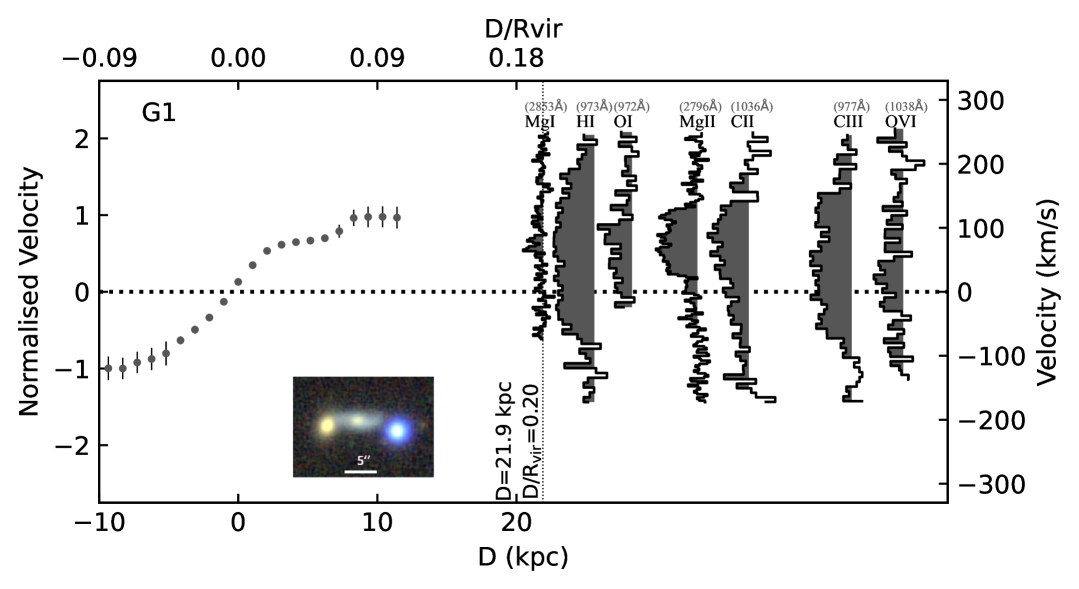
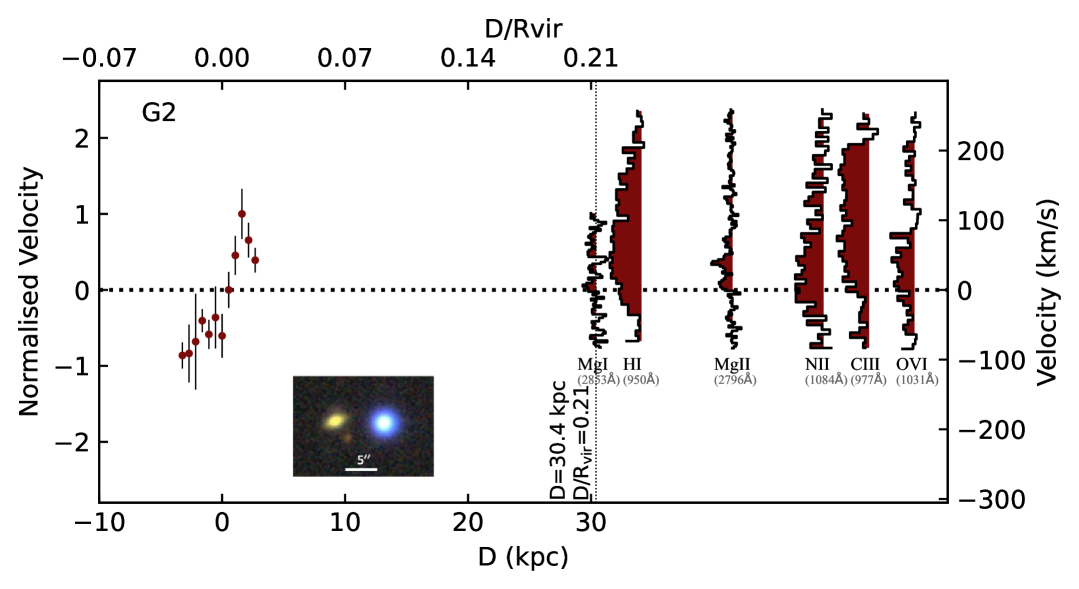
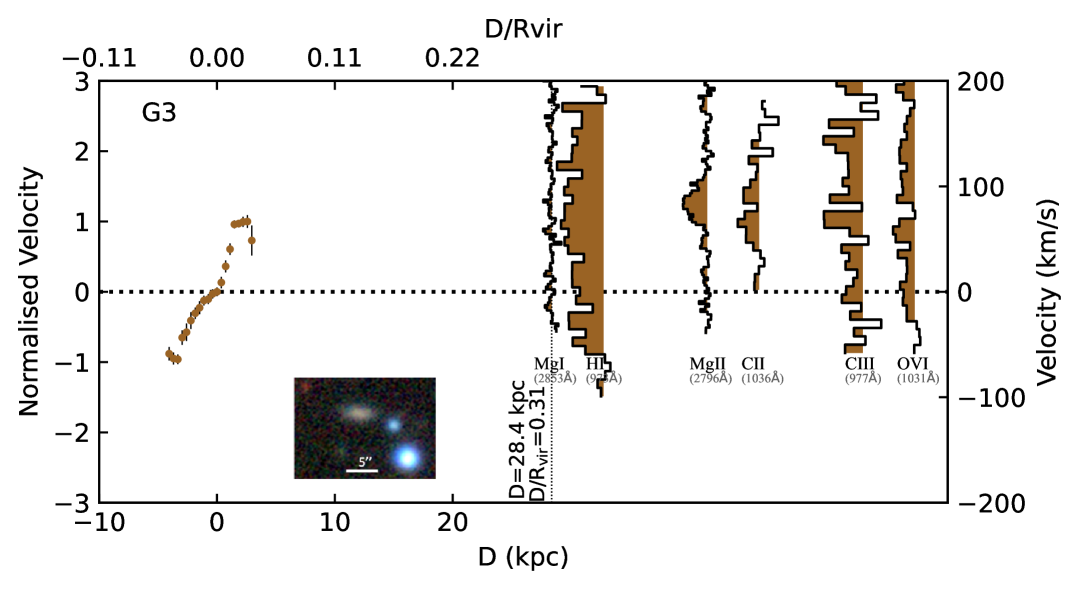
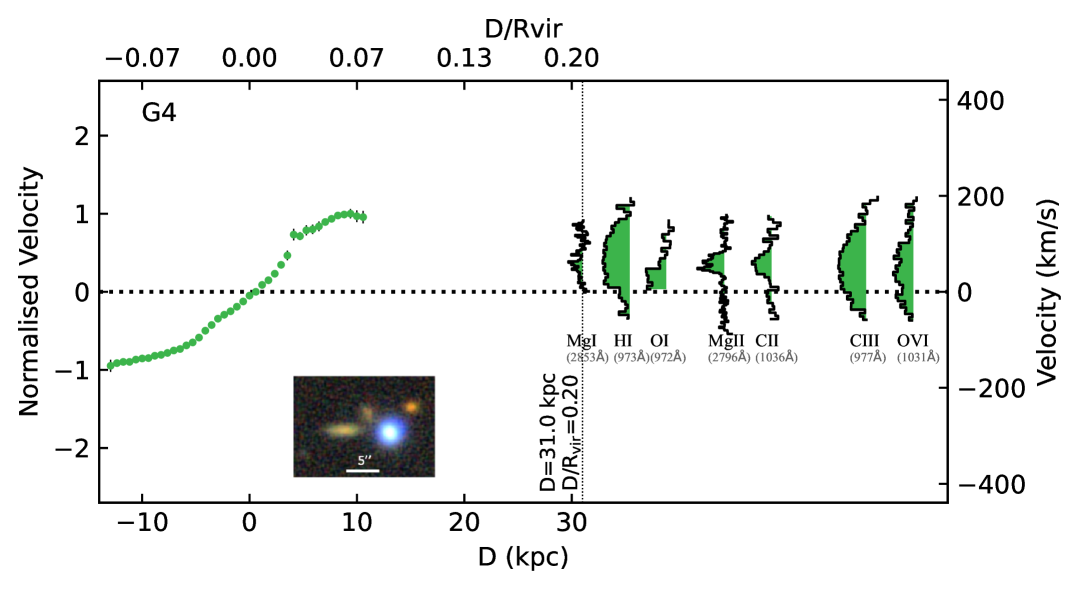
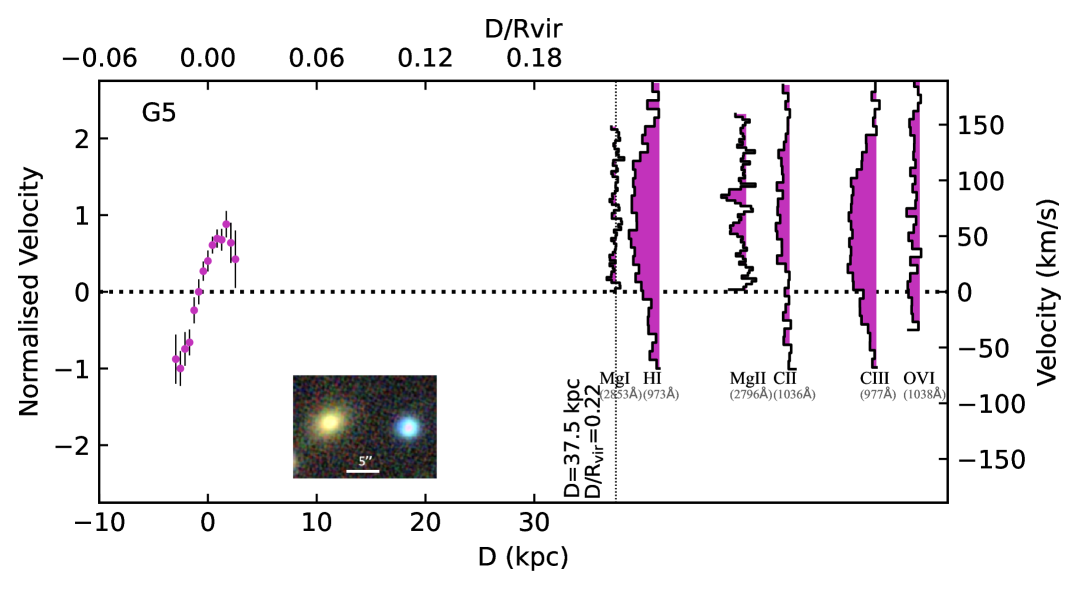
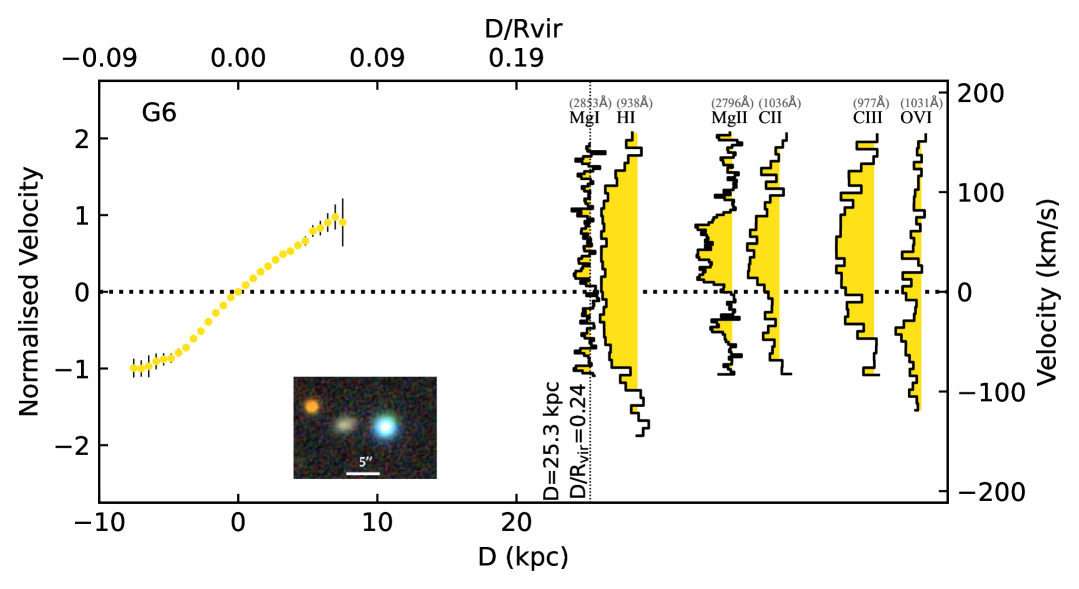
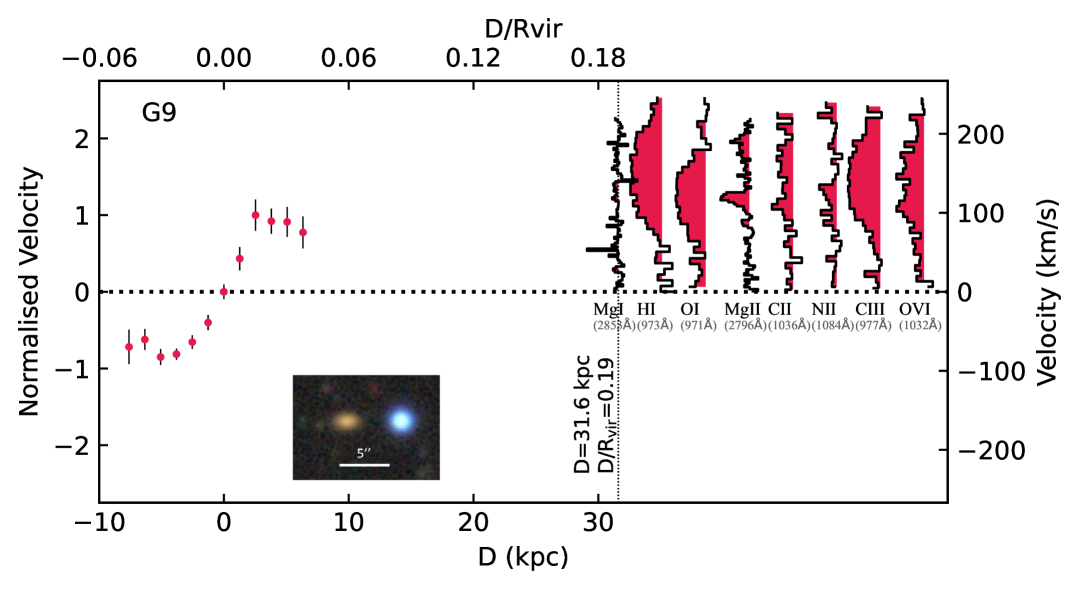
Appendix A Individual Galaxy Gas–CGM Kinematic Comparisons
In this section, we show the remaining galaxies not shown in the manuscript (G1, G2, G3, G4, G5, G6 and G9).
For each figure, the DECaLS colour image of galaxy (left) and quasar (right) are shown. The coloured circle data points show the galaxy rotation curves derived from nebular emission lines. The y-axes show both the line-of-sight velocity in km s-1 (right-side) as well as the peak rotation-normalised velocity (left side). The x-axes show the projected distance from the galaxy towards the quasar in kpc (; lower axis) and in virial radius-normalised distance (; top axis). The direction towards the quasar is in the positive x-axis direction and the direction of galaxy rotation towards the quasar is in the positive y-axis direction above the horizontal dashed line. The vertical dotted line shows the projected distance of the quasar, which is also labelled. At the projected distance of the quasar, the spectra of individual CGM absorption lines are shown horizontally in order of increasing ionisation potential and are offset for clarity. Not all of the absorption lines detected in the quasar spectra are shown, but we have chosen to display a subset that are common for each galaxy (Mg i, H i, O i, Mg ii, C ii, N ii, C iii and O vi). See figure captions for a discussion of each system.