Synchronization of lasers with complex spatio-temporal dynamics
Abstract
Synchronization is among the most fascinating dynamical behaviors through which oscillators like lasers align their temporal dynamics under weak coupling. So far, experimental studies have been restricted to lasers exhibiting structured temporal dynamics, such as periodic, mode-locked, or chaotic regimes, the latter usually induced by feedback or optical injection. We now successfully achieve synchronization of two spatially extended lasers with intrinsically chaotic dynamics. We observe synchronization when a dominant transverse mode of the master laser becomes spectrally aligned with a mode of the slave, without requiring matching between the spatial field profiles. Several dynamical regimes are identified, including synchronization of fast chaotic fluctuations and low-frequency polarization hopping, along with switching between normal and inverse synchronization. These results show that the presence of complex dynamics in space and time does not hinder synchronization; instead, it enables a variety of synchronization regimes. Our findings offer new insights into how multimode chaotic lasers can self-organize through weak coupling, highlighting the role of spectral alignment and dominant modes in the emergence of synchronized behavior. In addition, synchronizing lasers that are chaotic without feedback enables simpler and more compact systems in view of applications such as physical cryptography or optical computing.
I Introduction
Synchronization between coupled oscillators is a phenomenon encountered in a variety of fields including electronics [1, 2], chemical reactions [3], biological networks [4], and lasers [5, 6, 7]. In the simplest case of two coupled harmonic oscillators, synchronization means the two oscillators are frequency- and phase-locked, which was first observed for two coupled pendula [8], and is usually described by the Adler equation [9]. Synchronization of clocks is of immense practical importance for time and frequency metrology.
More generally, synchronization means the ability of weakly coupled systems to develop correlated temporal dynamics. Synchronization can also occur between coupled chaotic systems, in spite of their inherent sensitivity to initial conditions [10]. Semiconductor lasers are an outstanding platform to study chaos synchronization due to their rich dynamical behavior under optical injection and feedback [11, 12, 13, 14, 15, 16]. Over the past decades, numerous forms of synchronization, such as complete, phase, frequency, generalized, and even anticipatory synchronization, have been explored [17, 18, 19, 20, 21]. Investigations into the coupling mechanisms have revealed the critical roles of both local and global interactions in shaping the stability and diversity of synchronization regimes, leading to applications like secure communication based on chaos encryption [17, 22, 23] and photonic computing schemes exploiting collective dynamics for information processing [24].
While temporal synchronization has been thoroughly explored, the extension to spatio-temporal systems remains largely unexplored. Systems with significant transverse extent can exhibit complex space- and time-dependent dynamics, and the spatial dimension introduces new challenges for achieving synchronization. Unlike purely temporal oscillators, spatially extended systems are prone to pattern formation, filamentation [25, 26], and modal competition [27], which can destabilize synchronization. Theoretical studies have addressed synchronization in multimode and distributed optical systems [28, 29], but despite its potential for parallel chaotic information processing and multichannel transmission [30, 31], spatio-temporal chaos synchronization has seen limited experimental validation. So far, synchronization of complex spatio-temporal dynamics has been experimentally demonstrated only using a liquid crystal light valve with feedback [32].
In order to address these fundamental questions experimentally, we take advantage of the intrinsically complex spatio-temporal dynamics of broad-area vertical-cavity surface-emitting lasers (BA-VCSELs) [33, 34, 35, 36, 37]. The mode competition in these devices naturally results in sustained high-frequency fluctuations and chaos without requiring external perturbations like feedback [38, 39]. The main question is if chaotic broad-area lasers can achieve synchronization through weak optical coupling.
Specifically, we investigate two coupled BA-VCSELs which exhibit chaotic dynamics in free-running operation (see Fig. 1). Via the pump current, we can change the number of transverse lasing modes and the dynamical regimes [38, 39]. Synchronization of chaotic dynamics is demonstrated for weak coupling via unidirectional optical injection. Remarkably, synchronization emerges despite significant differences in the spatial mode structures. It is mediated by spectral alignment between strong transverse modes, establishing a mechanism where frequency alignment prevails over spatial matching in enabling chaos synchronization in multimode systems.
Our results open new perspectives for spatially extended optical systems with chaotic dynamics, with implications for high-capacity secure communications and massively-parallel chaotic information processing. They establish that spatial complexity, instead of preventing synchronization, can coexist with robust collective dynamics under appropriate coupling conditions.
The paper is organized as follows. We first describe the experimental setup used for unidirectional coupling between two BA-VCSELs. We then characterize the spontaneous chaotic dynamics of these lasers in free-running operation. Synchronization results are subsequently presented for two distinct regimes: a first regime involving slow polarization-hopping dynamics, and a second regime featuring broadband chaotic dynamics. We conclude by discussing the implications of these results and the perspectives they open for the study of complex spatio-temporal systems.
II Results
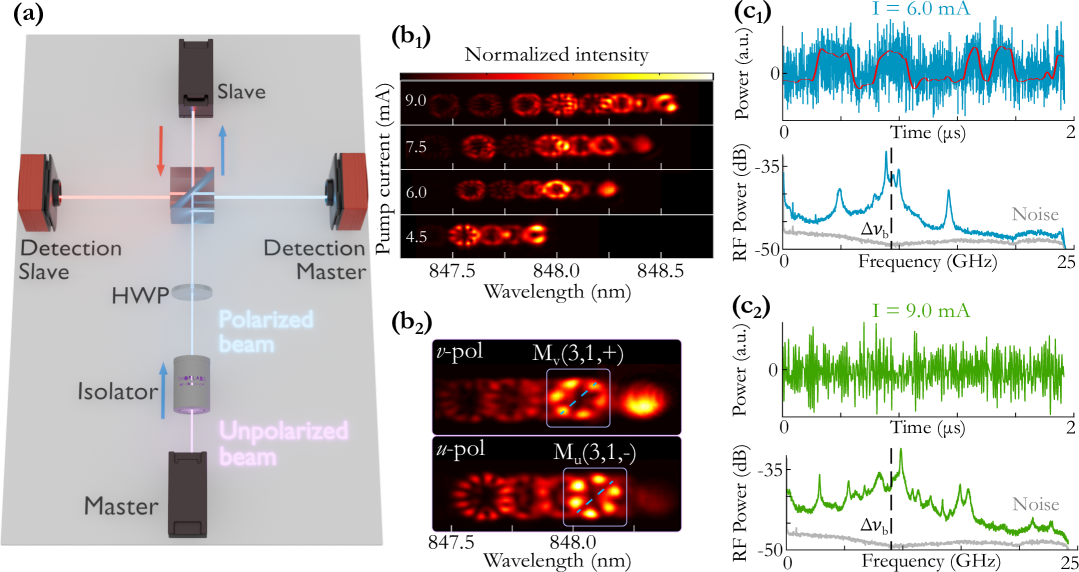
We experimentally study unidirectional optical injection of one BA-VCSEL into another BA-VCSEL of the same model and analyze the dynamical response of the slave laser to the signal of the master laser. A simplified schematic of the experimental setup is shown in Fig. 1(a), and a detailed description is provided in Appendix 1. We begin with a summary of the properties of the master laser (see also Refs. [38, 39]), and a comparison to the slave laser is presented in Appendix 3.
The free-running BA-VCSELs lase in several transverse modes and two linear orthogonal polarization states, denoted by and . The dominant polarization depends on the pump current and changes at several polarization-switching points (PSPs, see Appendix Fig. A5) [38]. The birefringence splitting between - and - polarization modes is around GHz (see Appendix 3), and we refer to ”red” () and ”blue” () polarization according to their relative position in the optical spectrum.
Figure 1(b) shows spatio-spectral images measured with an imaging spectrometer (see Appendix 1) for different pump currents. With increasing pump current, more transverse modes are progressively excited. A transverse mode with mode indices has intensity maxima in azimuthal direction and maxima in radial direction. Furthermore, for , two distinct spatial orientations are possible, which we denote with () when they are (anti-) symmetric with respect to a symmetry axis as shown in Fig. 1(b2). In the following we denote the modes with where refers to the master and slave laser, respectively. It should be noted that modes and are not necessarily degenerate [40], but can exhibit a splitting of the order of several GHz (see Appendix A.4). The actual splitting seems to depend on the transverse mode. Typically, only one of the orientations is excited for a given polarization, and the corresponding mode in the other polarization has the opposite orientation due to gain competition [41, 42, 43, 38]. This is exemplified in Fig. 1(b2) with the modes and . However, in some cases both orientations of a transverse mode lase in the same polarizations as shown in Appendix Fig. A8.
The competition of lasing modes with different spatial profiles and polarizations results in rich nonlinear dynamics, as shown in Fig. 1(c). As the pump current increases, the system undergoes a sequence of bifurcations that progressively enrich the temporal behavior [38, 39]: initially periodic oscillations transition to quasi-periodic regimes, and eventually to chaotic dynamics (see Appendix Fig. A9). These bifurcations are usually accompanied by a redistribution of power between different transverse modes and in some cases polarization switching points [38]. We restrict our analysis to parameter regions in which the master laser features chaotic dynamics for a focused investigation of synchronization in the presence of intrinsic multimode chaos.
The lasing dynamics features different time scales: the dominant frequencies are around the birefringence [see Fig. 1(c)]. However, in some current regimes like around mA, this fast dynamics coexists with a slower polarization-hopping dynamics with frequencies of the order of MHz [see Fig. 1(c1) and Appendix Fig. A7], similar to observations for single-mode VCSELs [44, 45, 46, 47].
Next, we implement optical injection between two BA-VCSELs to investigate synchronization between them. Although the two lasers are of the same model, some differences in their spectral and dynamical properties inevitably remain. The comparison of their optical spectra and dynamics in Appendix B shows that spectral alignment can be achieved by adjusting the detuning via the temperature or the pump current of the slave (see Appendix C). The two distinct dynamical regimes in Fig. 1(c) are injected into the slave laser in order to analyze the synchronization quality for both high frequency chaos and slower mode-hopping dynamics. Different synchronization mechanisms emerge depending on the properties of the injected dynamics. The response of the slave laser strongly depends on the temporal and spectral structure of the injected signal, highlighting the richness of coupling phenomena in chaotic multimode systems.
The first case we study is when the master laser operates at mA and exhibits a dynamics characterized by both high-frequency components and slow polarization-hopping (typically around MHz). The master laser current and temperature are fixed to keep its dynamical properties constant. The slave laser current is varied between mA and mA at a fixed temperature of C. The slave laser modes are red-shifted due to Joule heating as its current increases [see Appendix C]. Furthermore, its output power increases, thereby reducing the optical injection ratio (see Appendix A). We study parallel injection, meaning that the -polarization component of the master laser, which is its dominant polarization for this pump current, is injected into the -polarization of the slave laser using a HWP. The slave laser has several PSPs in this current range, but its red polarization () remains mostly dominant (see Appendix Fig. A5).
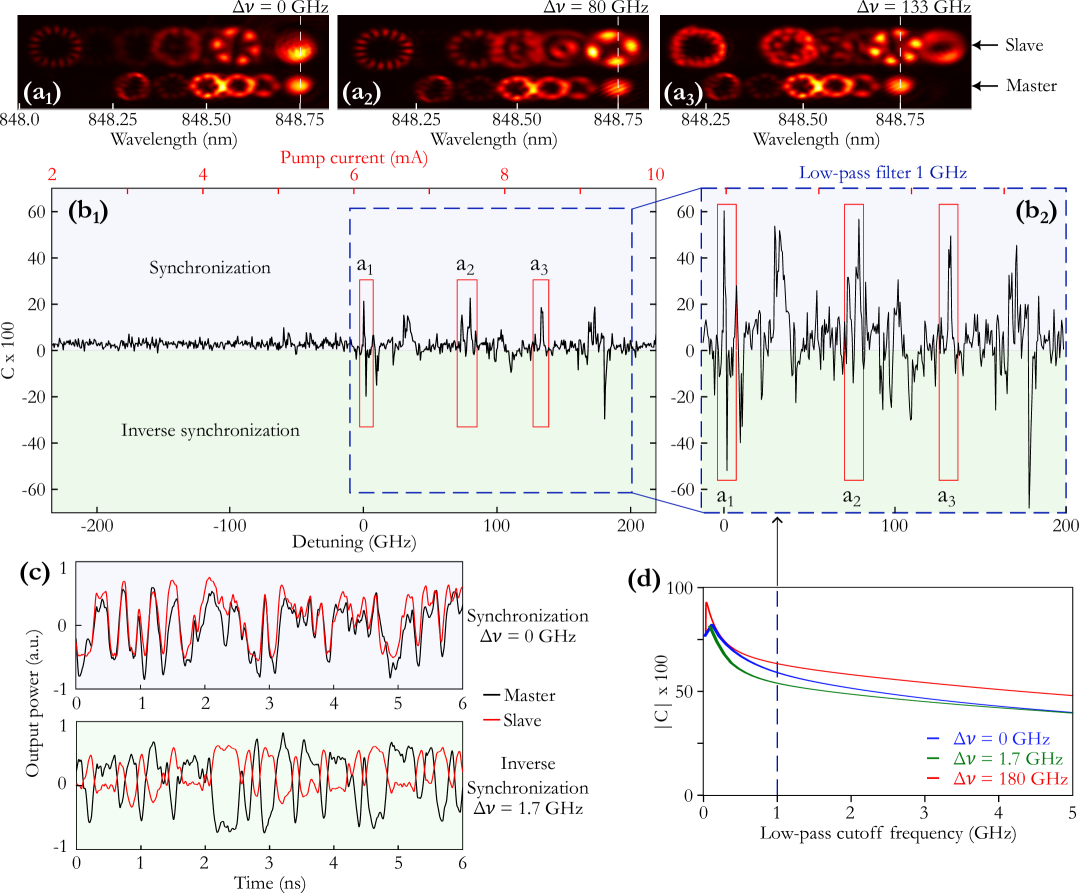
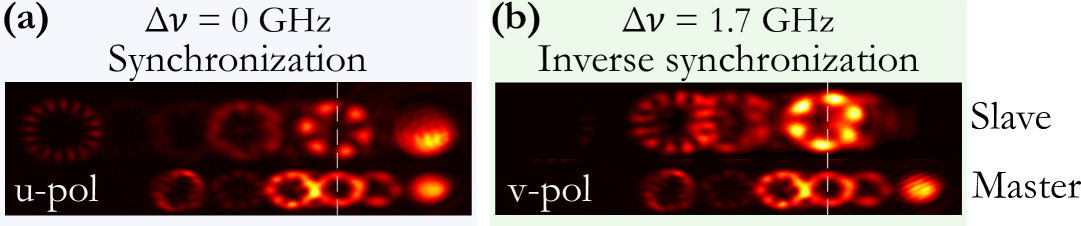
Figure 2(b1) shows the correlation between the time traces (see Appendix A) of -polarized emissions of master and slave laser as function of the frequency detuning between the two lasers, which is defined here as the frequency of mode minus the frequency of as illustrated in Fig. 2(a1). We observe several cases of significant positive and negative values of correlation, corresponding to synchronization and inverse synchronization respectively, which are discussed in the following.
The positive correlation peaks are related to spectral alignment between transverse modes of the master and the slave laser with high power. For , the spatio-spectral image in Fig. 2(a1) shows that both the and the modes emit strongly and are spectrally aligned with the and modes, respectively. We originally expected this to yield the best synchronization since theoretically each transverse mode of the master laser would be aligned with its counterpart of the slave, but in practice perfect matching of all transverse mode frequencies is not achievable due to small differences in modal spacings between the two lasers. We also observe that for , when the mode aligns with the mode, its power significantly increases while neighboring modes become weaker, as discussed in Appendix Fig. A13. This highlights the strong interaction of these two modes as their frequencies align.
Similar observations are made for the other positive correlation peaks. At GHz, a weak synchronization peak appears, associated with the alignment of with . The peak at GHz corresponds to the alignment between and [see Fig. 2(a2) and Appendix Fig. A13]. Similarly, at GHz, another peak emerges from the alignment between modes and [see Fig. 2(a2)]. These examples demonstrate that synchronization can be achieved when a strong transverse mode of the master laser spectrally aligns with a transverse mode of the slave, however, it need not be the same transverse modes: spectral alignment appears to be more important than spatial alignment for successful synchronization. It should also be emphasized that the other transverse modes of the slave laser remain active and are different from those of the master laser [see Fig. 2(a)], meaning that synchronizing the temporal dynamics of the lasers does not require synchronizing the optical spectrum or the spatial intensity distribution.
We also observe inverse synchronization, that is negative correlation between the time traces of the -polarized emission of master and slave, with the most significant examples at GHz and at GHz. Synchronization in antiphase for coupled oscillators has been known since early studies of coupled pendula and has also been observed in coupled lasers with feedback, for example in the low-frequency fluctuation regime [48]. Polarization dynamics was identified as a key factor in the emergence of inverse synchronization in Refs. [49, 50].
The first example at GHz happens right after the alignment of the mode with the mode when the former approaches the frequency of the mode, as shown by the time traces of the master and slave, low-pass filtered at 0.1 GHz cutoff, in Fig. 2(c). Indeed, Appendix Fig. A11(a) shows that the mode is strongly excited at GHz. We surmise that when injecting light into the -polarization at a frequency near a -polarized mode of the slave, it can create a synchronization of the -polarized emission with the mode-hopping dynamics of the -polarized injection signal from the master, though this is evidently not always the case. Since the emission in - and -polarization is highly anticorrelated in the polarization-hopping regime [see Appendix Fig. A7], the -polarized emission of the slave becomes anti-correlated to the -polarized master signal since the latter is synchronized with the -polarized emission of the slave. At GHz detuning, we observe that the mode is enhanced when its frequency comes close to the mode.
These examples demonstrate that coupling of two multimode VCSELs can create different types of synchronization depending on system parameters, and that moreover strong dynamic correlations can be established even for detunings as large as GHz.
Finally we analyze the master-slave correlation across different timescales by applying spectral filtering (see Appendix B). Figure 2(d) shows the evolution of the correlation as function of the low-pass filter cutoff frequency for three examples. The correlation significantly improves with correlations of up to 90% for MHz cutoff at = 180 GHz. Furthermore, Fig. 2(b2) shows the correlation of the low-pass filtered time traces with 1 GHz cutoff as a function of detuning. A global increase is observed across all correlation regions. These low-frequency components represent the relatively slow polarization-hopping dynamics which appears to synchronize much better than the high-frequency components of the dynamics as demonstrated by the low-pass filtered time traces of master and slave laser at and GHz in Fig. 2(c). This demonstrates that it is the polarization-hopping dynamics which is synchronized, and that one can achieve very high synchronization quality even though the BA-VCSELs are not perfectly identical.
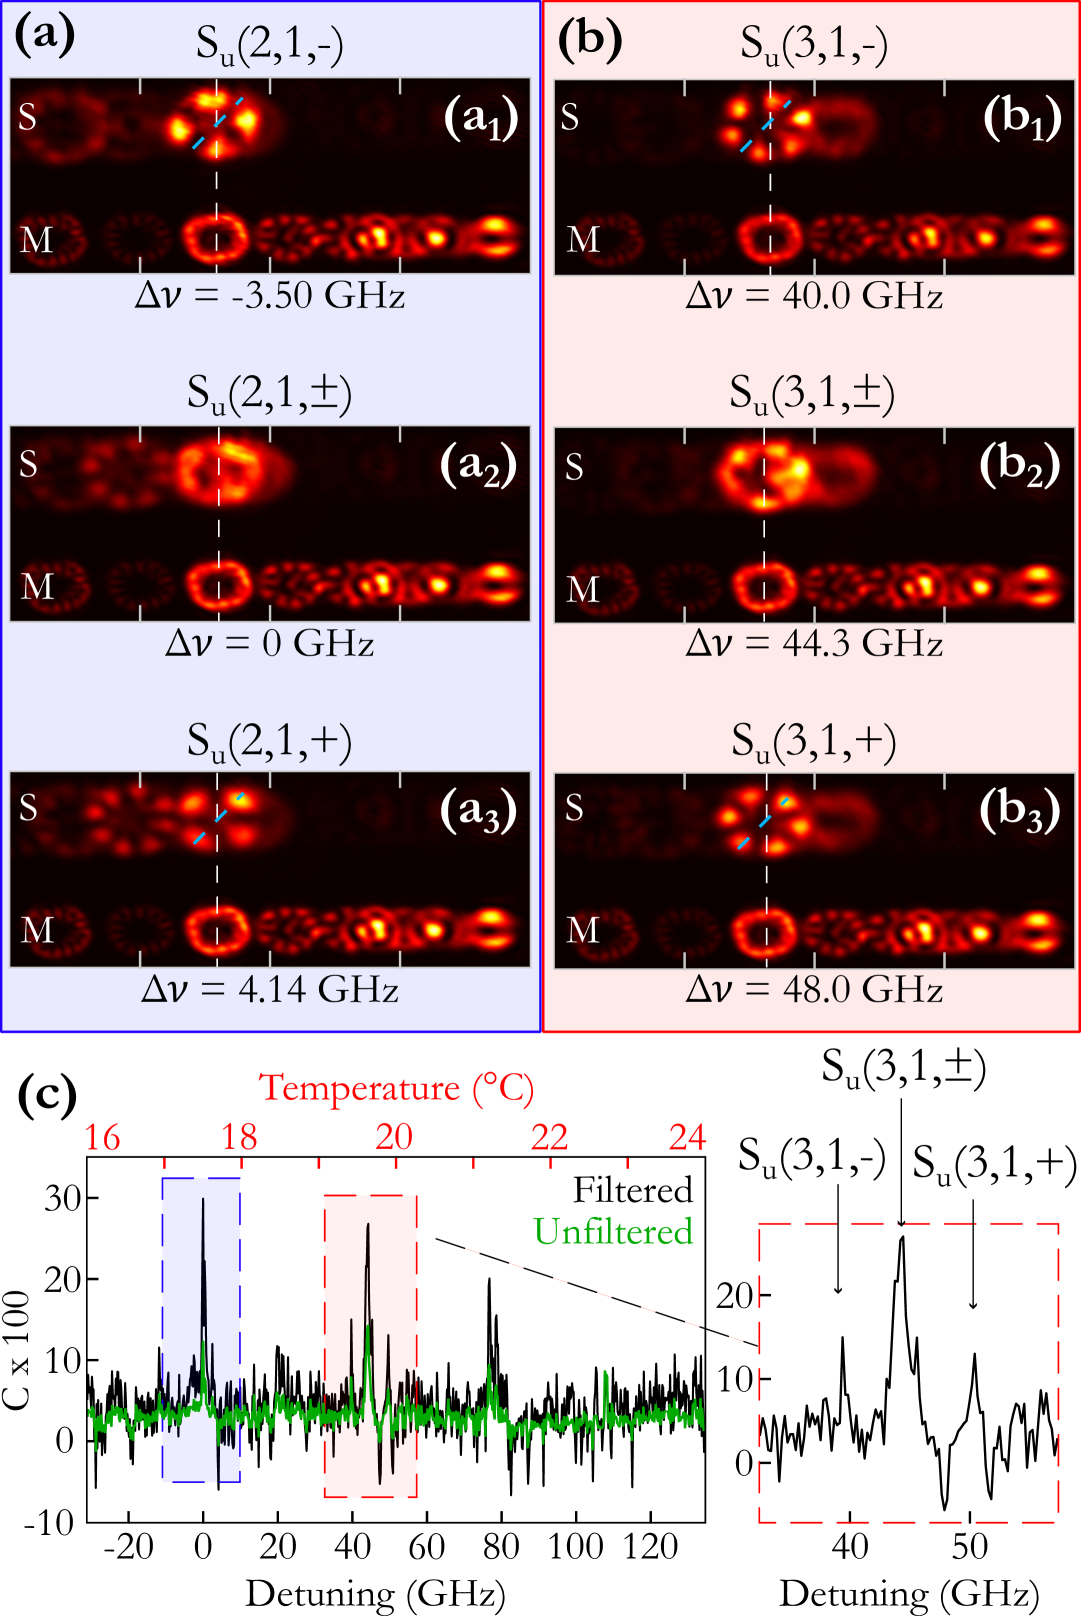
For the second case of injection that we study, the master laser is set to mA and C, the slave laser is operated at a fixed current of mA, and the detuning is varied via the temperature of the slave. As before, the master laser emits predominantly along the -polarization, and parallel injection of the -polarization is performed. These experimental parameters lead to three differences to the first case. First, the injection ratio is higher though it remains relatively weak (see Appendix A). Second, while the master laser has higher power, it is distributed over a larger number of transverse modes [see Fig. 3(a)]. Third, the master laser operates in a chaotic state with high frequency components (see Fig. 1(c) and Ref. [39]) without polarization-hopping. In the following we discuss how these changes affect the synchronization.
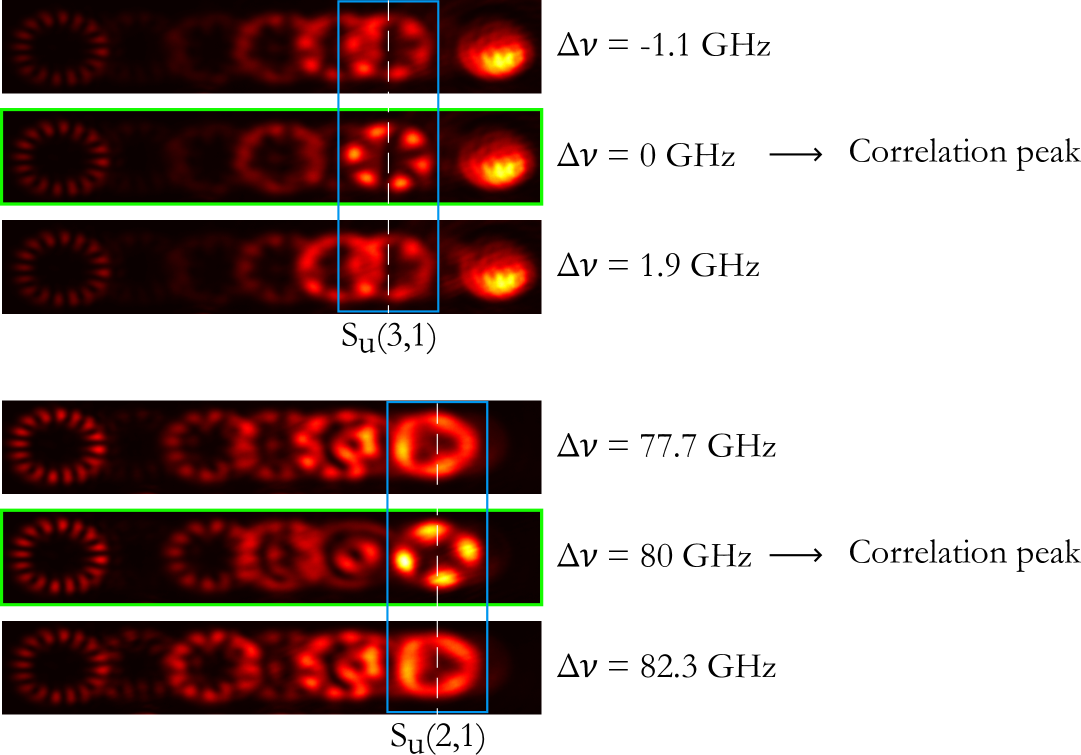
The detuning is controlled by the temperature of the slave laser, with a measured tuning coefficient of . We define here that GHz when the mode is aligned with the mode , which is the dominant mode of the master and plays an important role in the following. The spatio-spectral images in Fig. 3 reveal that this mode lases in both orientations, and , at the same time, and with a negligible splitting . This property of the master strongly influences the synchronization behavior.
Figure 3(c) shows several regions of positive correlation. The region around GHz stems from synchronization of the modes with the modes, which are very weak in free-running operation but can be strongly excited by the injection. A closer look shows that there are actually three successive correlation peaks: is excited at GHz, both and are excited at GHz, and is excited at GHz as shown in Fig. 3(a). We attribute this behavior to the splitting between the and modes, which seems to be about GHz (see also Appendix A.4): these two modes are excited alone when the modes aligns spectrally with them, and their superposition is created when is in between the two orientations of . The same behavior is found when the modes come close to the modes [see Fig. 3(b) and the magnification in Fig. 3(c)]. We associate this scenario to the modes lasing simultaneously, which creates an azimuthally uniform intensity distribution that is able to excite both orientations of the slave laser modes equally well.
However, spectral alignment alone does not guarantee strong synchronization. For instance, around GHz only a low correlation around is observed despite the spectral matching between the modes and the mode. The third region of positive correlation shows a somewhat different scenario: at GHz, the mode of the master, which lases only in a single orientation, excites a superposition of the and modes. However, the correlation is low, probably because the has less power than the modes.
This second injection experiment confirms our earlier observation that spectral alignment between a strong mode of the master and a transverse mode of the slave laser is an important prerequisite for synchronization. While the transverse modes of the master and slave lasers that are coupled can be different, the spatial structure of the master laser mode can also play an important role: simultaneous lasing of the master laser mode in both orientations favors the emergence of three correlation peaks, in which different orientations of the same transverse mode of the slave laser are excited. Furthermore we find that a higher injection ratio does not necessarily lead to higher correlations, which may be due to the master power being spread across more modes, while power concentration in a single mode seems to play a key role.
Applying a low-pass filter improves the correlations to some extent, typically reaching peak values between 20% and 30% with cutoff frequencies around to GHz [see Fig. 3(c)], but these values are below those found for the first case [see Fig. 2]. We believe this is related to the type the master laser dynamics, which is chaotic with high frequency components up to GHz [see Fig. 1(c)], in contrast to the slower polarization-hopping dynamics in the first case. Whereas the slow polarization-hopping dynamics creates strong synchronization which is revealed by low-pass filtering, the chaotic dynamics in the second case relies on high-frequency components, so filtering does not help much. It seems that fast chaotic dynamics is harder to synchronize. The absence of inverse synchronization in the second case is explained by the absence of polarization-hopping dynamics to which we attribute the inverse synchronization in the first case. In summary, the second injection experiment confirms the importance of spectral alignment for synchronization [see also Appendix Fig. A12]. However, we also find significant differences between the two cases, demonstrating the diversity of synchronization scenarios and their dependency on the dynamical and spatial properties of the master laser.
III Discussion
Our experiment constitutes the first demonstration of chaos synchronization between two diode lasers which are intrinsically chaotic without optical feedback or external perturbations. Furthermore, it also elucidates the question of synchronization between coupled lasers with complex spatio-temporal dynamics.
Owing to the multimode nature and intrinsic complexity of the VCSELs, the dynamics of the coupled system is very rich, and we observe different scenarios including synchronization of ultrafast chaos, of polarization-hopping dynamics, and inverse synchronization. The measured correlations are generally low of the order of , which could be due to the very low transmission through the top mirror of the VCSELs, mismatch in the device structures and the natural strong mode competition. However, correlations up to are observed for low-pass filtered polarization-hopping dynamics. Synchronization is typically observed when one of the dominant modes of the master laser is spectrally aligned with a mode of the slave laser, but does not require a careful matching of their spatial profiles. This flexibility and the multitude of possible synchronization scenarios gives hope that further improvements of the synchronization quality are possible.
Our work opens new perspectives concerning the synchronization of complex lasers. We show that synchronization of the temporal dynamics does not require or imply that other system properties like the spectrum and the spatial profiles become identical as well. Hence a more precise exploration and classification of synchronization scenarios for coupled spatio-temporal systems will be needed. And while we concentrate on the temporal dynamics, further investigations of the spatial dimension appear promising, for example by using different cavity shapes [51, 52, 53] or shaping the injected beam. Tuning the birefringence or introducing controlled anisotropies could help to isolate polarization states and their associated spatial modes. By systematically varying the number and nature of the excited modes, one could assess how the modal complexity influences the robustness, speed, or nature of synchronization. Such control would allow for a more precise exploration of the transition from low-dimensional to high-dimensional chaotic synchronization in spatially extended laser systems.
Finally, there are also perspectives for future applications. The high correlation of the low-pass filtered polarization-hopping dynamics is promising for applications such as private key sharing [54, 55] that typically require both high-dimensional chaos and good synchronization quality, but not very high speeds. Furthermore, broad-area lasers offer the possibility of spatial multiplexing to further increase the processing speed.
Acknowledgements
The Chair in Photonics is supported by Region Grand Est, GDI Simulation, Departement de la Moselle, European Regional Development Fund, CentraleSupélec, Fondation CentraleSupélec, and Eurometropole de Metz.
Author contributions
The experimental setup was jointly conceived by J.M., M.S. and S.B., and built and implemented by J.M., who also carried out the measurements and data analysis. S.B. and M.S. supervised the project. All authors discussed the results, and contributed to the writing of the manuscript.
Competing interests
The authors declare no conflicts of interest.
Appendix 1 Experimental setup
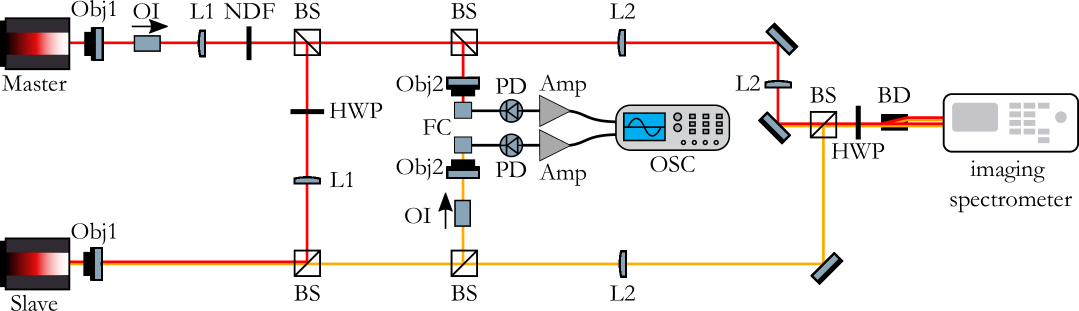
The experimental setup is presented in Fig. A4 in more detail. The lasers under study are broad-area VCSELs (Frankfurt Laser Company FL85-F1-P1N-AC) with a circular output aperture of m diameter, electrically pumped through a ring contact. The output beam of the master laser is collimated by a 40× microscope objective (Obj1, NA = 0.6). An optical isolator (OI) is placed immediately after the master laser to prevent any undesirable optical feedback that could influence its intrinsic dynamics. A beam splitter (reflexion: 70 / transmission: 30) directs part of the master laser signal to the detection arm (30%), and part of the signal (70%) is injected into the slave laser. In the same way, part of the slave laser signal is collimated and sent to the detection arm.
The detection arm allows to measure the temporal dynamics, the optical spectra, and spatio-spectral images of the two lasers. Two fiber couplers with 20× objectives (Obj2, NA = 0.5) are employed to couple the beams into multimode fibers (Thorlabs M116L02, 50 core diameter) connected to high-speed photodetectors (Newport 1484-A-50, 22 GHz bandwidth). The RF-signals from the photodetectors are amplified by RF-amplifiers (SHF S126A) yielding a gain of 29 dB over a frequency range spanning from 80 kHz to 25 GHz, and measured by an oscilloscope (Tektronix DPO72340SX, 23 GHz bandwidth). Alternatively, the multimode fibers can be connected to an optical spectrum analyzer (OSA, Anritsu MS9740A, pm resolution) to examine the spectral composition of the laser emission. Optical isolators are used to prevent reflections from the fiber facets, and the entrance polarizers of the isolators are aligned to transmit only the -polarization of the lasers (unless otherwise noted).
By means of several lenses (L2, 100 mm focal length) and beam splitters, the output facets of the two BA-VCSELs are imaged onto the entrance slit of an imaging spectrometer (Princeton Instruments SpectraPro HRS-500), with a spectral resolution of 30 pm and 1800 g/mm grating. Due to the different beam paths and lens configurations used, the magnification is different for each laser. The slit of the spectrometer is fully open so that the camera in the focal plane of the spectrometer measures the spectrally-resolved near-field intensity distributions of the two VCSELs, that is, the intensity patterns of the different transverse modes are dispersed horizontally as function of their wavelength. The images of the two VCSELs are offset vertically, and a beam displacer (Thorlabs BD27, 2.7 mm beam separation) preceded by a half-wave plate is used to vertically separate the - and -polarizations of the slave laser as well. Thus the two polarizations of the slave laser and the -polarization of the master laser are measured in parallel.
The signal of the master laser passes through the collimation objective (Obj1, NA = 0.6), a lens (L1, 200 mm focal length), another lens of the same type and finally the objective (Obj1) in front of the slaver laser. The lenses are aligned such that the output facet of the master laser is imaged onto the output facet of the slave laser with 1x magnification. Furthermore, additional cameras in the far-field planes of the lasers (not shown in Fig. A4) are used to ensure that the injected beam is parallel to the output beam of the slave laser. The optical isolator after the master laser is used to select only its -polarization for transmission to the slave laser, and a half-wave plate is used to align the polarization of the master signal with the -polarization axis of the slave laser for parallel optical injection. A variable neutral density filter allows to change the power of the injected signal. The results presented in this article were obtained for minimal attenuation (maximal injection power).
As previously discussed, although the injection ratio is difficult to estimate precisely in practice, it remains very low and does not appear to directly affect the observed correlation levels. Another crucial factor is the optical alignment, which is essential to ensure optimal coupling between the two lasers. In addition to aligning the -polarizations to allow for parallel injection, the angle at which the master beam enters the slave laser cavity had to be finely adjusted. To verify and optimize this alignment, both near-field and far-field profiles of the master and slave lasers were compared and carefully overlapped. This alignment proved to be crucial and technically challenging to implement.
Appendix 2 Analysis of times series
A Correlation measurement
The synchronization quality between the master and the slave lasers is calculated using the well-known correlation coefficient
| (A1) |
where and are the output powers (i.e., time traces) of the master and slave lasers, respectively, that are measured with the high-speed photodetectors. The time average is denoted by , and is a time shift. The correlation is computed as function of for each detuning . Figs. 2(b) and 3(c), however, only show the correlation at the for which it is maximal. This time shift of ns corresponds to the path length difference between the signals of master and slave laser as expected, meaning that zero-lag synchronization is achieved. For detunings where the master and slave lasers are not synchronized, the correlation is theoretically expected to vanish. However, a persistent residual correlation remains observable in our system, fluctuating around for the unfiltered data. This non-vanishing baseline arises from the reflection of the master laser from the top mirror of the slave laser. We verified that even with the slave laser switched off, a small fraction of the master signal is reflected back, producing a weak but measurable correlation. This weak correlation also appears at a time lag corresponding to the propagation delay along the signal pathways.
B Filtering of time traces
In addition to analyzing the correlation of the original measured time traces, we also investigated the effect of spectral filtering on the correlation. A Butterworth low-pass filter was chosen due to its simplicity of implementation and its flat frequency response in the passband, which ensures that the preserved frequency components are not distorted by filtering artifacts. Different cutoff frequencies were tested, ranging from the full bandwidth of the measured signal (23 GHz) down to 10 MHz, allowing us to investigate how the correlation evolves across different frequency ranges.
The transfer function of an th-order Butterworth filter as function of RF-frequency is given by
| (A2) |
where is the cutoff frequency. It corresponds to the point where the transfer function drops to -3 dB, marking the boundary between the passband and the stopband. In our case, a filter of order was used, providing a suitable trade-off between high-frequency attenuation and filter stability.
Appendix 3 Properties of free-running lasers
A Polarization and spectrum
A.1 LI-curves and polarization-switching points
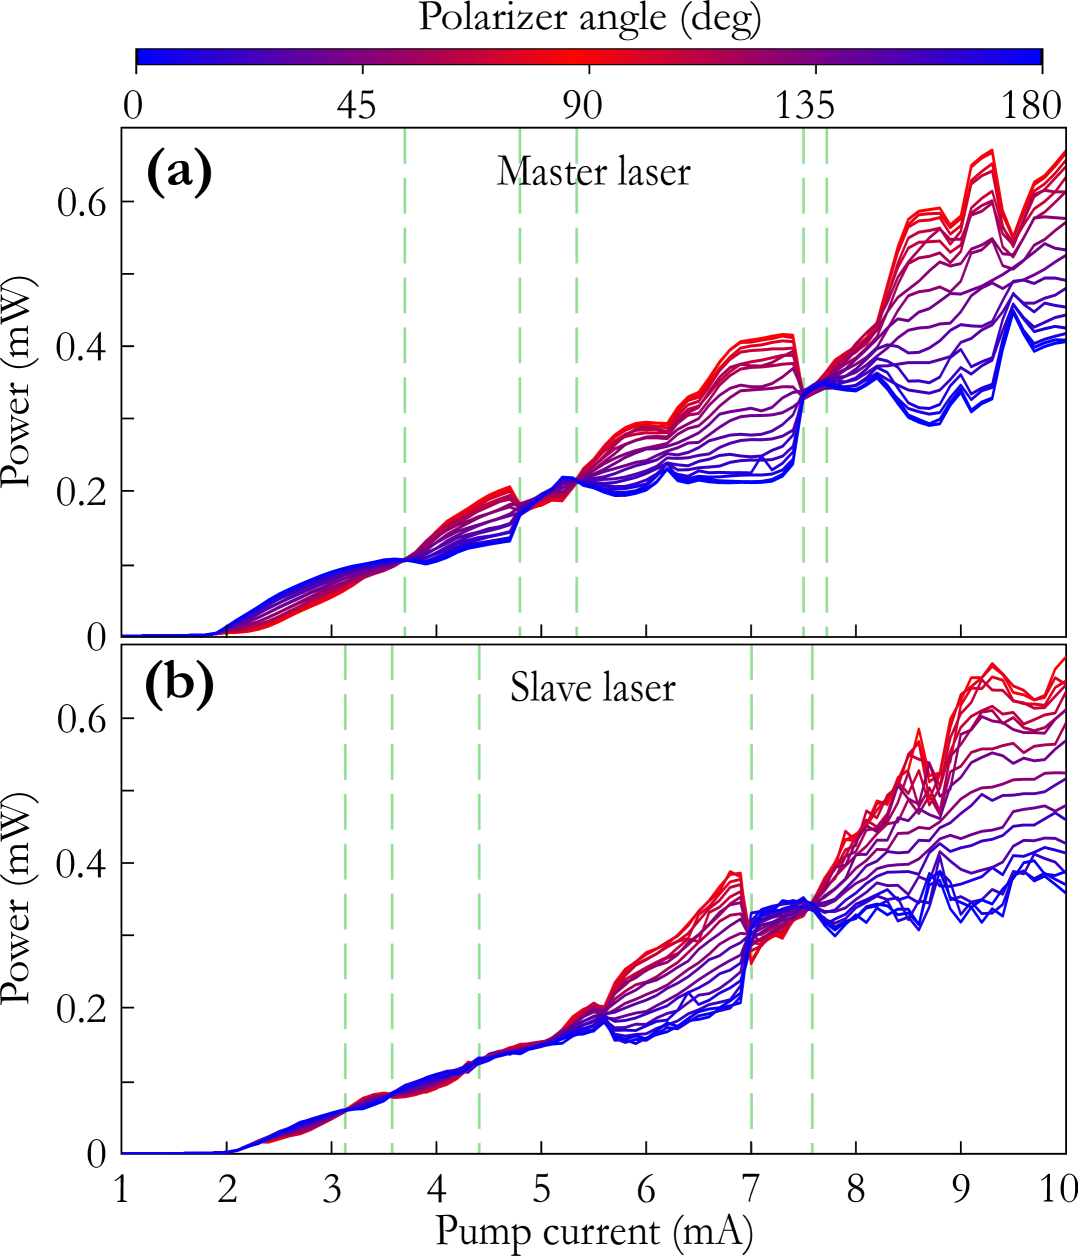
To identify the principal polarization axes of the BA-VCSELs used in this work, a polarizer in a motorized rotation stage was employed to measure the optical power transmitted through the polarizer as function of its orientation for both lasers. Using a power meter, measurements were taken every 10∘ over the full current range of 2 to 10 mA as shown in Fig. A5. The resulting profiles exhibit two distinct extrema in emitted power at 0∘ (or equivalently 180∘) and 90∘, revealing the two orthogonal polarization axes. Depending on the pump current and the temperature of the laser, the dominant polarization switches between these two orientations at specific polarization switching points (PSPs), while the - and -polarization axes themselves remain fixed. In most cases, the 90∘ axis (referred to as -polarization) dominates, while the 0∘ / 180∘ axis is referred to as -polarization. See Ref. [38] for more details. It should be noted that we define the polarizer angle with respect to the polarization axes of the VCSELs as a convenient reference frame to facilitate visualization and comparison. These axes generally do not coincide with the horizontal and vertical axes of the laboratory frame.
A.2 Optical spectrum and birefringence
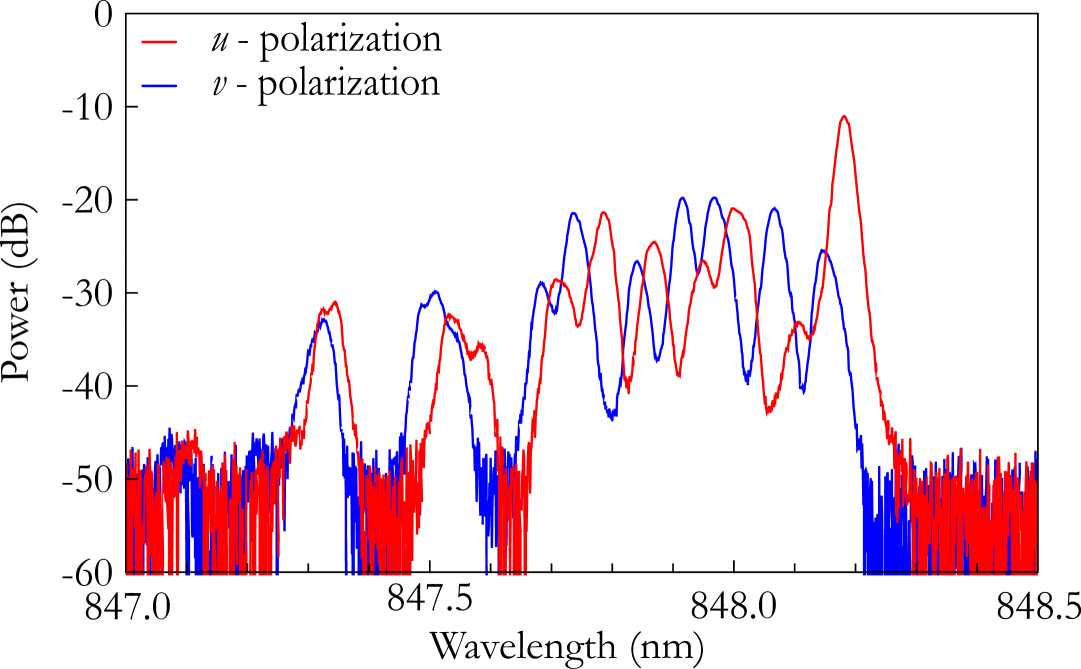
Measurements of the optical spectra provide important information on the properties of the lasers under study. First, the wavelengths of the individual modes are clearly identified, with the fundamental mode appearing at the longest wavelength (right side of the spectrum), and higher-order transverse modes at shorter wavelengths (as discussed in more detail in Ref. [38]). Figure A6 shows the optical spectra of the master laser measured along the two dominant polarization axes, and , for a fixed pump current of mA. This measurement reveals that the optical power is distributed differently among the transverse modes depending on the polarization, and also highlights a spectral shift between the two polarization components. We assign the label ”red” (”blue”) to the - (-) polarization whose spectrum is at longer (shorter) wavelengths.
This spectral separation is due to the intrinsic birefringence of the VCSEL which plays a critical role in polarization dynamics. We experimentally measured the birefringence frequency from the spectral separation between the same transverse modes in the two orthogonal polarizations. Although the birefringence may vary slightly depending on the mode, this analysis allowed us to estimate GHz for the master laser and GHz for the slave laser. We explicitly chose two VCSELs with very similar birefringence and close central wavelength value.
A.3 Polarization-hopping dynamics
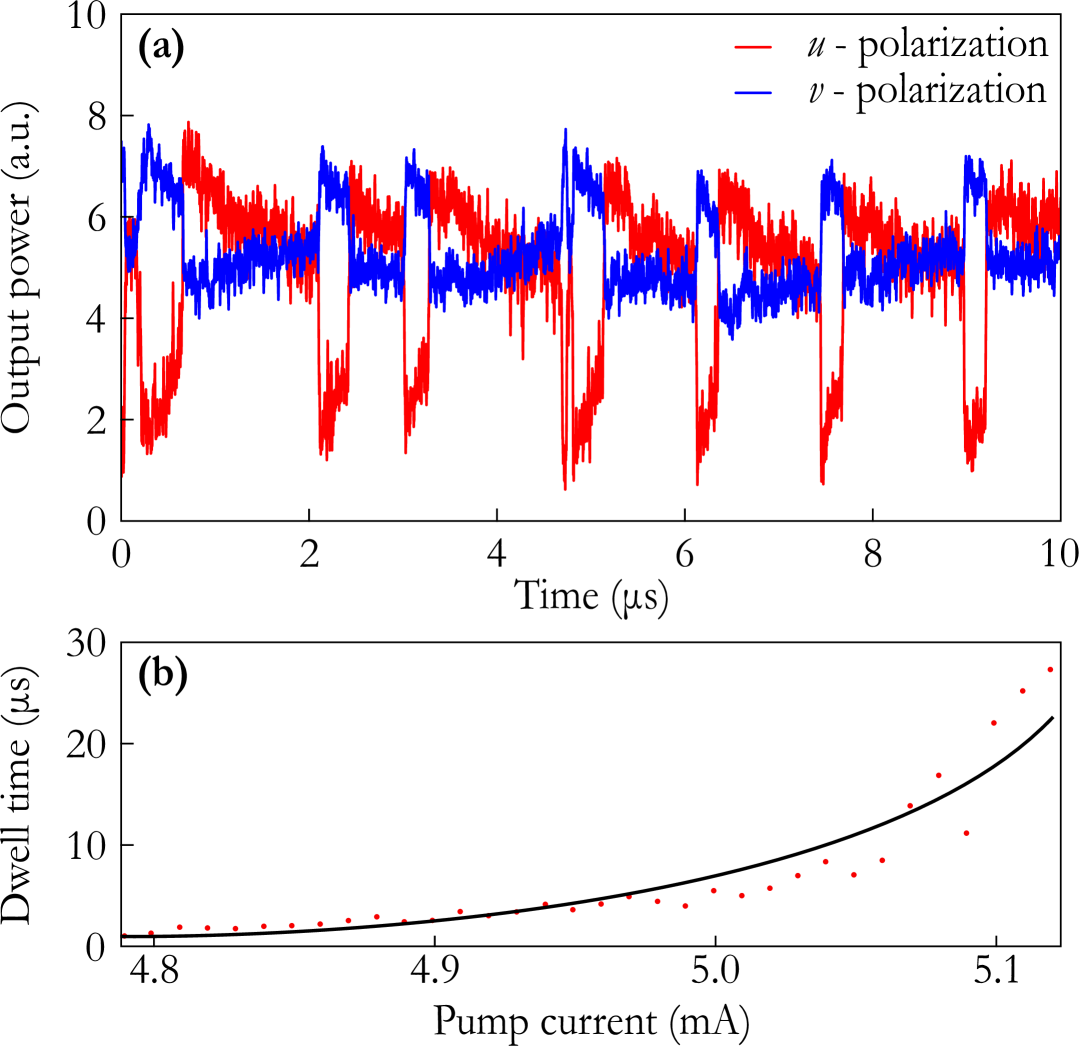
The VCSELs under study exhibit several polarization switching points (PSPs) at which the dominant polarization changes (see Fig. A5), such as in the case of the master laser at 3.6 mA, as well as points at which the power in the two polarization states becomes almost equal without switching, such as the master laser at 6.2 mA. These points are sometimes accompanied by a dynamical regime known as polarization hopping [47]. As illustrated in Fig. A7(a), this regime is characterized by intensity fluctuations in one polarization (), with an anti-correlated response in the orthogonal polarization (). Due to the relatively long timescales of this dynamics, the associated intensity fluctuations contribute significantly to the low-frequency components of the RF spectrum, predominantly below MHz.
This behavior has been reported in various VCSEL systems [44, 45, 46, 47], and the spontaneous polarization switching can be driven by noise or by deterministic nonlinear dynamics. The temporal behavior within this regime is characterized by the dwell time, defined as the average duration the system remains in one polarization state before switching. Figure A7(b) presents the measured dwell time as a function of pump current, showing an exponential increase with increasing current. This trend is characteristic of deterministic polarization chaos [46].
A.4 Orientation of transverse modes
Due to the circular geometry of the VCSEL cavity, all transverse modes with exist in two different orientations, designated by () if they are (anti-) symmetric with respect to a chosen axis. In an ideally symmetric cavity, the modes with and orientations are degenerate.
Figure 1(b2) presents polarization-resolved spatio-spectral measurements of the master laser under free-running conditions for = 6.5 mA. Several key observation can be made: first, we typically observe modes with the same transverse pattern in both polarization states, however, there is a clear spectral shift between them due to the birefringence as discussed above. Second, the intensities in the two polarizations are generally not the same (see Fig. A6). Third, for a given , the - and -polarizations usually exhibit different transverse orientations, with a symmetry in -polarization corresponding to a symmetry in -polarization, which is attributed to gain competition [41, 42, 43]. In short, usually each transverse mode lases in both polarizations but with different spatial orientations and different intensities. However, in some cases, such as mode in Fig. 3, the measured spatial pattern shows that both orientations lase in the same polarization state (under free-running conditions).
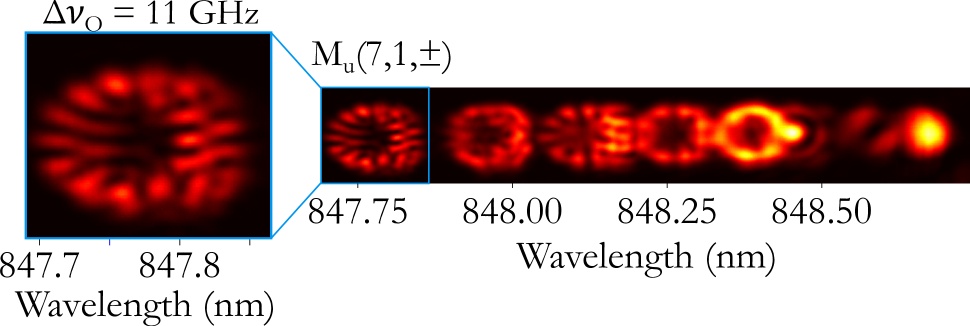
Figure A8 shows the spatio-spectral image of the master laser at 9.8 mA. In this example, the mode lases in both orientations in -polarization, however, we see that the and the mode are not degenerate as expected for a perfectly symmetric system, but spectrally shifted. We designate this frequency separation between the and orientations of a given transverse mode within the same polarization as . This splitting is usually below the resolution of standard optical spectrum analyzers or imaging spectrometers, making it difficult to measure directly. In the case of Fig. A8, it is quite large with GHz. In other instances, like the mode in Fig. 3, it is close to .
Moreover, the progressive excitation of different orientations under optical injection, such as the modes and previously presented in Fig. 3, enables an indirect estimation of around 7.64 GHz and 8 GHz, respectively, by considering the secondary correlation peaks observed near the principal one. Overall, the degeneracy splitting is strongly mode-dependent and may range from nearly 0 up to at least 11 GHz, highlighting the complexity of polarization and orientation resolved transverse mode spectra in BA-VCSELs.
B Comparison of master and slave laser
Among a batch of five nominally identical BA-VCSELs from the same manufacturer, a detailed characterization was performed on each device to identify the most suitable pair for the injection experiment. The selection was guided by two key criteria: similarity in birefringence frequency and in wavelength of the lasing modes. As the laser dynamics are strongly influenced by birefringence, we selected two devices exhibiting closely matched values, GHz for the master laser and GHz for the slave. Spectral alignment was also critical, since frequency detuning strongly affects the injection dynamics. Both lasers exhibited comparable emission wavelengths over the considered current range (– mA), ranging from to nm at a common temperature of 20°C.
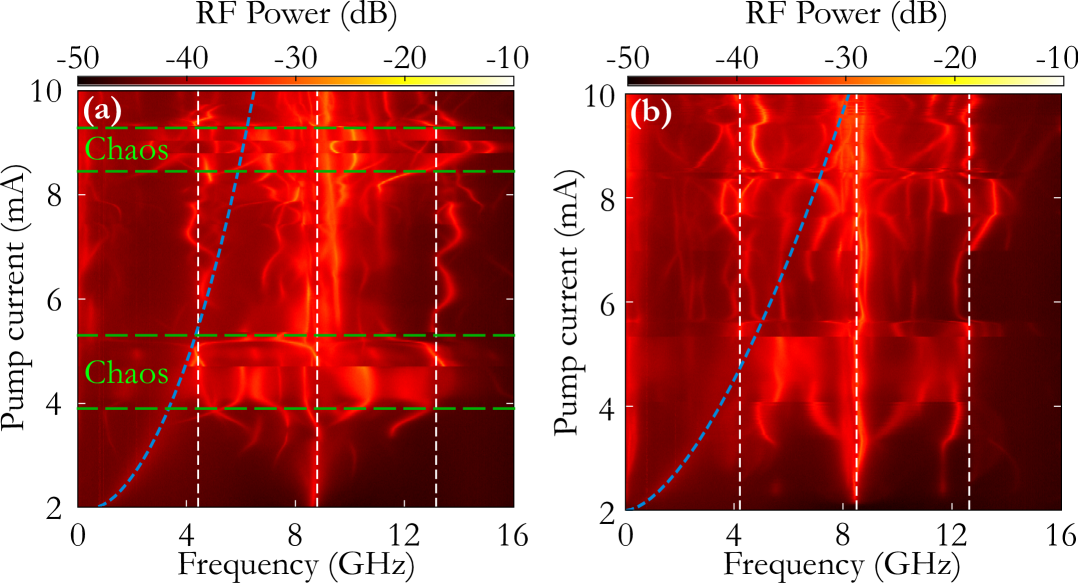
Prior to the injection experiment, the intrinsic free-running behavior of each laser was analyzed. Figure A5 presents polarization-resolved LI curves for both devices. While both exhibit well-defined orthogonal polarization axes, their PSPs differs significantly, even though the -polarization (red) generally dominates, which is the polarization axis we chose for injection. Further insights were obtained from the analysis of the RF-spectra shown in Fig. A9, which displays the evolution of RF-spectra as function of the pump current measured along the 45° polarization axis, that is, - and -polarization are measured with equal efficiency on the photodetector. Consistent with previous studies [39], the dominant frequency components appear around the birefringence frequency , as well as its subharmonic and harmonic (0.5 and 1.5, white dashed lines). Relaxation oscillations are also visible (blue dashed lines). The bifurcations, often coinciding with PSPs, are clearly reflected in changes of the spectral content. Some bifurcations mark the begin of a regime of high-frequency chaos, delimited by the green dashed lines in Fig. A9(a) for the master laser. The chaotic regions were identified using the noise titration method as well as the Grassberger-Procaccia algorithm [39].
These analyses show that although the two selected VCSELs share key parameters such as birefringence and emission wavelength, their intrinsic dynamics are far from being stationary and furthermore differ significantly. This makes polarization-resolved injection experiments between them a challenging task. Once the pair of VCSELs was identified, polarization alignment in the injection path was ensured using a half-wave plate (see Fig. A4). Due to intrinsic birefringence and structural anisotropies, the - and -polarization axes of each VCSEL differ: for the master, and ; for the slave, and (note that these angles are given with respect to the horizontal axis of the laboratory frame, in contrast to the convention established in section A). Combined with the 45° rotation introduced by the optical isolator and further rotations from subsequent reflections, proper alignment of the injected field was achieved by tuning the HWP to ensure that the -polarization of the master was injected into the -axis of the slave to achieve polarization matching.
C Dependency on laser parameters
The emission properties of the BA-VCSELs exhibit a strong dependency on both pump current and temperature. As expected for semiconductor lasers, increasing the pump current induces a red-shift of the emission wavelength due to Joule heating. In addition, the transverse mode structure evolves with the current, often accompanied by polarization-dependent redistribution of intensity among the modes. For instance, higher-order modes emerge at increased current levels, with distinct spectral positions and polarization preferences. Thermal effects further shift the emission spectrum. A linear red-shift is observed as a function of temperature and pump current, with typical tuning coefficients of approximately 0.05 nm/°C and 0.136 nm/mA. These shifts impact the spatial overlap and the spectral alignment between the two VCSELs. Accurate current and temperature control is therefore critical to maintain spectral alignment, especially in weak injection regimes.
Appendix 4 Injection experiments
A Injection ratio
The injection ratio is a fundamental parameter for coupling two laser systems. In this study, it is quantified as the injection strength , calculated as the power from the master laser in the -polarization at the input of the slave laser divided by the total output power of the slave laser ,
| (A3) |
The measured injection power accounts for optical losses due to the isolator, beam splitter, and other optical elements. Furthermore, the injection strength can be reduced via a variable neutral density filter (see Fig. A4), but it was set to minimal attenuation in the experiments presented here. is the free-running total output power of the slave laser, measured directly at the output, and includes both polarization components.
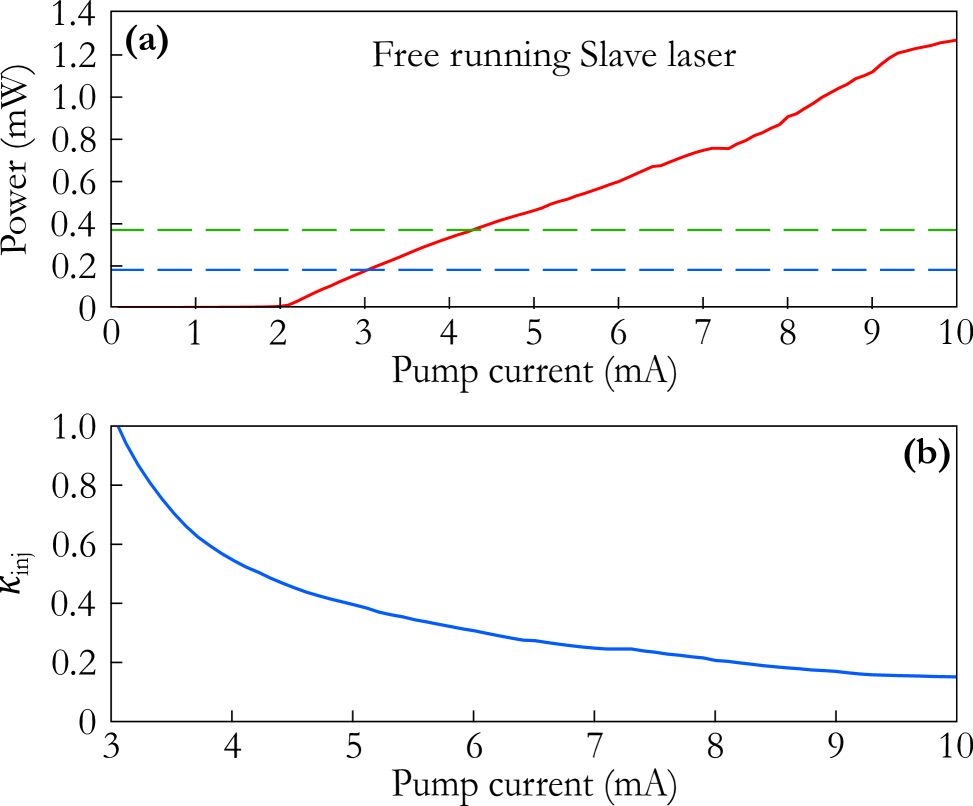
In the first case of injection studied in the paper, the master laser operates at fixed parameters () and delivers an input power of approximately mW at the entrance of the slave laser, indicated by the blue dashed line in Fig. A10(a). The output power of the slave varies nearly linearly with pump current as shown in Fig. A10, and this variation determines the resulting injection strength , plotted in Fig. A10(b). It is important to note that these values does not take into account reflections at the slave input facet or other factors affecting the coupling efficiency; they only reflect the available optical power at that point.
As the slave pump current increases, its output power increases, leading to a decrease in . For example, for the correlation peaks labeled , , , and the final peak shown in Fig. 2, corresponding to slave currents of approximately , , , and mA, respectively, the injection strengths are estimated around 0.30, 0.22, 0.17, and 0.14. This represents a reduction by a factor of almost two of the injection strength between the first and last peak. However, the correlation values are roughly the same in all four cases, suggesting that moderate variation in injection strength does not significantly impact correlations in this regime.
In the second case of injection we study, at mA and mA, the injected power reaching the slave is approximately mW [green dashed line in Fig. A10(a)], while the total output power of the slave laser is mW, corresponding to an injection strength of .
However, it is important to note that the values of presented here should be interpreted with caution. The measured master laser power corresponds to the value at the front of the slave laser. It is not possible to directly determine the portion that actually couples into the slave cavity. A rough estimate can nevertheless be made. In fact, assuming a typical front-facet reflectivity of , only a fraction of less than of the master power effectively enters the cavity. Similarly, the total output power of the slave laser used here does not reflect the real intracavity power, and is therefore underestimated. So while the injection strength is rather weak in our experiment, it allows us to rule out trivial synchronization effects driven purely by high-power injection.
B Inverse synchronization
The inverse synchronization phenomenon observed in the first injection case has been attributed to polarization-related dynamics. Figure A11 considers the first synchronization region and shows in panel (a) the case of , where the mode is spectrally aligned with the mode. As a result, its intensity increases significantly, while neighboring modes are suppressed. This spectral alignment illustrates the strong mode interaction when their frequencies coincide. Figure A11(b) shows a similar effect, but in the orthogonal polarization of the slave laser (-axis) at GHz: the mode aligns with the mode, leading to an intensity increase of at the expense of adjacent modes. This alignment coincides with the occurrence of the negative correlation peak, suggesting anti-correlation between the -polarized emission of the master and slave laser appears because the -polarized emission of the slave is correlated with the master signal. This example illustrates that the excitation of a slave laser mode in the -polarization systematically coincides with the occurrence of the inverse synchronization peaks.
C Injection with variation of slave current and temperature
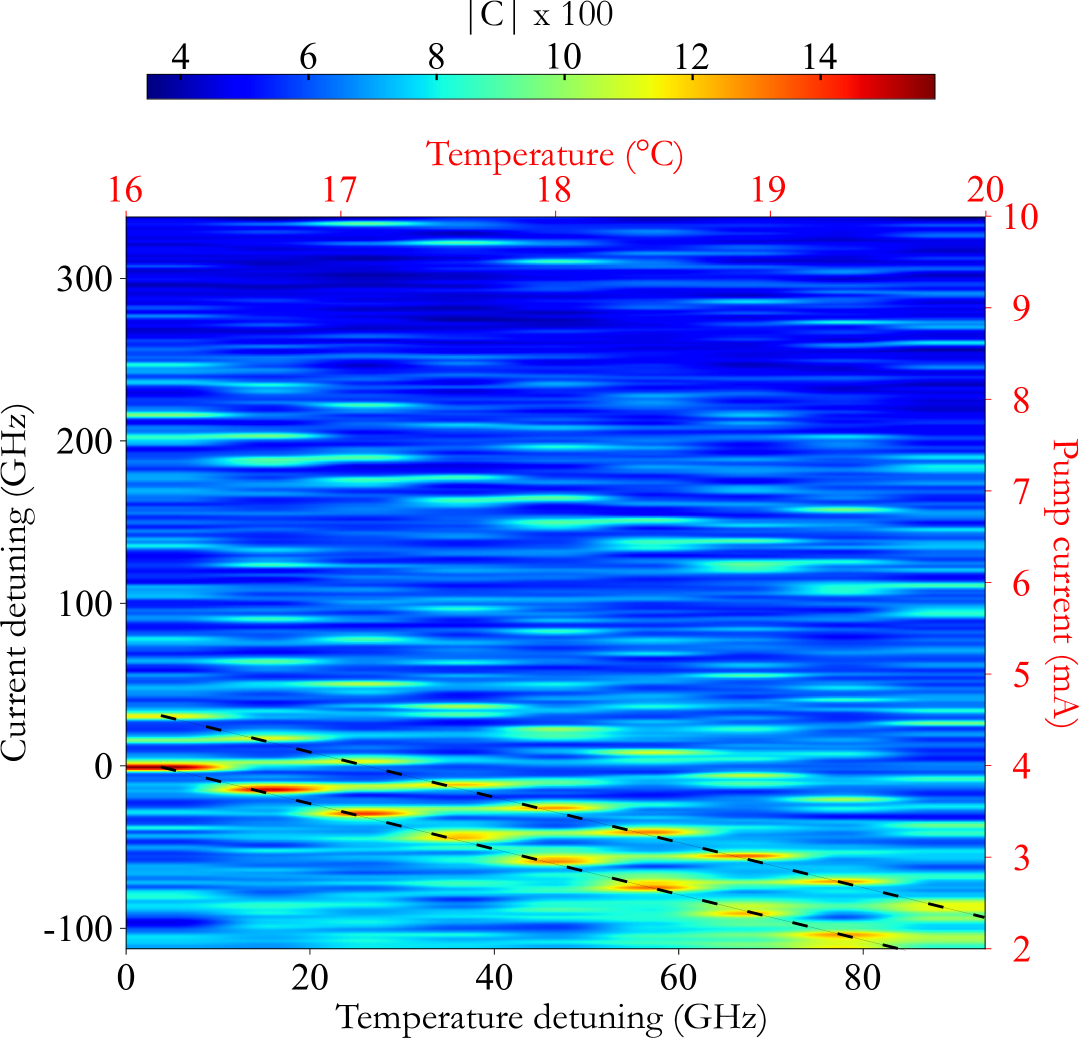
Here, we present the evolution of the correlation between the master and slave lasers as a function of several experimentally scanned parameters. The master laser is held fixed at mA and C, while the slave laser is scanned in both temperature ( step) and injection current ( mA step). The time traces are measured as function of the pump current, following the same procedure used in the first injection case discussed earlier, while keeping the slave temperature fixed. Then the slave temperature is increased followed by another sweep of the current, covering a range of 16∘C to 20∘C.
Figure A12 displays the absolute value of the correlation of the unfiltered time traces as function of slave temperature and current. The temperature and current shifts are converted to the corresponding detuning, and the total detuning is the sum of the current and temperature detunings. The map reveals several series of correlation peaks, with the first and strongest one emerging at GHz. These correlation peak series appear as diagonals, reflecting conditions of spectral alignment between specific transverse modes of the master and slave lasers. The key implication of these diagonal series is that spectral alignment is a necessary condition for correlation, and can be achieved with both current and temperature variation. However, we also observe that the correlation varies along these diagonals, suggesting that other experimental parameters also influence the quality of synchronization.
D Enhancement of Slave laser mode
The synchronization regions observed in the first injection case () are closely associated with spectral alignment between a dominant transverse mode of the master laser and a transverse mode of the slave laser, depending on the frequency detuning . Several distinct correlation peaks were identified, notably at and , each corresponding to specific mode alignments. As shown in Fig. A13, at , the slave mode becomes spectrally aligned with the master mode . Under injection, this mode becomes more distinctly identifiable in the spatio-spectral image, indicating that it is effectively excited by the injected signal. This excitation is accompanied by a clear correlation peak, confirming the onset of synchronization. In contrast, for slightly detuned values such as or , the alignment is lost and the mode becomes less distinguishable, which corresponds to a decrease in correlation.
A similar behavior is observed near , where spectral alignment occurs between the slave mode and the master mode . The slave mode again becomes more clearly visible and identified, indicating its excitation through injection, and this results in a secondary synchronization peak. These observations confirm that the emergence of a well-defined transverse mode in the slave laser, driven by spectral alignment with a dominant mode of the master, plays a central role in enabling synchronization, even without matching the spatial profiles.
References
- Csaba and Porod [2020] G. Csaba and W. Porod, Coupled oscillators for computing: A review and perspective, Appl. Phy. Rev. 7, 011302 (2020).
- Parihar et al. [2014] A. Parihar, N. Shukla, S. Datta, and A. Raychowdhury, Exploiting synchronization properties of correlated electron devices in a non-boolean computing fabric for template matching, IEEE J. Emerg. Sel. Top. C 4, 450 (2014).
- Forrester [2015] D. M. Forrester, Arrays of coupled chemical oscillators, Scientific Reports 5, 16994 (2015).
- Mirollo and Strogatz [1990] R. E. Mirollo and S. H. Strogatz, Synchronization of pulse-coupled biological oscillators, SIAM J. Appl. Math. 50, 1645 (1990).
- Hui et al. [1991] R. Hui, A. D’Ottavi, A. Mecozzi, and P. Spano, Injection locking in distributed feedback semiconductor lasers, IEEE J. Quant. Electron. 27, 1688 (1991).
- Lang [1982] R. Lang, Injection locking properties of a semiconductor laser, IEEE J. Quant. Electron. 18, 976 (1982).
- Mogensen et al. [1985] F. Mogensen, H. Olesen, and G. Jacobsen, Locking conditions and stability properties for a semiconductor laser with external light injection, IEEE J. Quant. Electron. 21, 784 (1985).
- Bennett et al. [2002] M. Bennett, M. F. Schatz, H. Rockwood, and K. Wiesenfeld, Huygens’s clocks, Proc. R. Soc. Lond. A 458, 563 (2002).
- Adler [1946] R. Adler, A study of locking phenomena in oscillators, Proc. IRE 34, 351 (1946).
- Pecora and Carroll [1990] L. M. Pecora and T. L. Carroll, Synchronization in chaotic systems, Phys. Rev. Lett. 64, 821 (1990).
- Wieczorek et al. [2005] S. Wieczorek, B. Krauskopf, T. Simpson, and D. Lenstra, The dynamical complexity of optically injected semiconductor lasers, Phys. Rep. 416, 1 (2005).
- Kovanis et al. [1995] V. Kovanis, A. Gavrielides, T. B. Simpson, and J. M. Liu, Instabilities and chaos in optically injected semiconductor lasers, Appl. Phys. Lett. 67, 2780 (1995).
- Colet and Roy [1994] P. Colet and R. Roy, Digital communication with synchronized chaotic lasers, Opt. Lett. 19, 2056 (1994).
- Mercadier et al. [2024] J. Mercadier, Y. Doumbia, S. Bittner, and M. Sciamanna, Optical chaos synchronization in a cascaded injection experiment, Opt. Lett. 49, 2613 (2024).
- Mork et al. [1992] J. Mork, B. Tromborg, and J. Mark, Chaos in semiconductor lasers with optical feedback: theory and experiment, IEEE J. Quant. Electron. 28, 93 (1992).
- Ohtsubo [2002] J. Ohtsubo, Chaos synchronization and chaotic signal masking in semiconductor lasers with optical feedback, IEEE J. Quant. Electron. 38, 1141 (2002).
- Sciamanna and Shore [2015] M. Sciamanna and K. A. Shore, Physics and applications of laser diode chaos, Nature Photonics 9, 151 (2015).
- Masoller [2001] C. Masoller, Anticipation in the synchronization of chaotic semiconductor lasers with optical feedback, Phys. Rev. Lett. 86, 2782 (2001).
- Deng et al. [2011] T. Deng, G.-Q. Xia, Z.-M. Wu, X.-D. Lin, and J.-G. Wu, Chaos synchronization in mutually coupled semiconductor lasers with asymmetrical bias currents, Opt. Express 19, 8762 (2011).
- Sugawara et al. [1994] T. Sugawara, M. Tachikawa, T. Tsukamoto, and T. Shimizu, Observation of synchronization in laser chaos, Phys. Rev. Lett. 72, 3502 (1994).
- Hillbrand et al. [2022] J. Hillbrand, M. Bertrand, V. Wittwer, N. Opacak, F. Kapsalidis, M. Gianella, L. Emmenegger, B. Schwarz, T. Südmeyer, M. Beck, and J. Faist, Synchronization of frequency combs by optical injection, Opt. Express 30, 36087 (2022).
- VanWiggeren and Roy [1998] G. D. VanWiggeren and R. Roy, Communication with Chaotic Lasers, Science 279, 1198 (1998).
- Argyris et al. [2005] A. Argyris, D. Syvridis, L. Larger, V. Annovazzi-Lodi, P. Colet, I. Fischer, J. Garcia-Ojalvo, C. Mirasso, L. Pesquera, and A. Shore, Chaos-based communications at high bit rates using commercial fibre-optic links, Nature 438, 343 (2005).
- Babaeian et al. [2019] M. Babaeian, D. T. Nguyen, V. Demir, M. Akbulut, P.-A. Blanche, Y. Kaneda, S. Guha, M. A. Neifeld, and N. Peyghambarian, A single shot coherent ising machine based on a network of injection-locked multicore fiber lasers, Nature Communications 10, 3516 (2019).
- Adachihara et al. [1993] H. Adachihara, P. Ru, J. V. Moloney, O. Hess, and E. Abraham, Spatiotemporal chaos in broad-area semiconductor lasers, J. Opt. Soc. Am. B 10, 658 (1993).
- Fischer et al. [1996] I. Fischer, O. Hess, W. Elsäßer, and E. Göbel, Complex spatio-temporal dynamics in the near-field of a broad-area semiconductor laser, Europhys. Lett. 35, 579 (1996).
- Becker et al. [2004] K. Becker, I. Fischer, and W. Elsäßer, Spatio-temporal emission dynamics of vcsels: modal competition in the turn-on behavior, Proc. SPIE 5452, 452 (2004).
- Buldu et al. [2004] J. Buldu, J. Garcia-Ojalvo, and M. Torrent, Multimode synchronization and communication using unidirectionally coupled semiconductor lasers, IEEE J. Quant. Electron. 40, 640 (2004).
- García-Ojalvo and Roy [2001] J. García-Ojalvo and R. Roy, Spatiotemporal Communication with Synchronized Optical Chaos, Phys. Rev. Lett. 86, 5204 (2001).
- White and Moloney [1999] J. K. White and J. V. Moloney, Multichannel communication using an infinite dimensional spatiotemporal chaotic system, Phys. Rev. A 59, 2422 (1999).
- Banerjee et al. [2011] S. Banerjee, L. Rondoni, S. Mukhopadhyay, and A. P. Misra, Synchronization of spatiotemporal semiconductor lasers and its application in color image encryption, Optics Comm. 284, 2278 (2011).
- Havermann et al. [2008] K. Havermann, B. Gütlich, and C. Denz, Synchronisation of spatiotemporal complex states by incoherent coupling, JEOS 3, 08001 (2008).
- Valle et al. [1995] A. Valle, J. Sarma, and K. A. Shore, Dynamics of transverse mode competition in vertical cavity surface emitting laser diodes, Opt. Comm. 115, 297 (1995).
- Barchanski et al. [2003] A. Barchanski, T. Gensty, C. Degen, I. Fischer, and W. Elsäßer, Picosecond emission dynamics of vertical-cavity surface-emitting lasers: spatial, spectral, and polarization-resolved characterization, IEEE J. Quant. Electron. 39, 850 (2003).
- Giudici et al. [1998] M. Giudici, J. Tredicce, G. Vaschenko, J. Rocca, and C. Menoni, Spatio-temporal dynamics in vertical cavity surface emitting lasers excited by fast electrical pulses, Opt. Comm. 158, 313 (1998).
- Buccafusca et al. [1996] O. Buccafusca, J. L. A. Chilla, J. J. Rocca, S. Feld, C. Wilmsen, V. Morozov, and R. Leibenguth, Transverse mode dynamics in vertical cavity surface emitting lasers excited by fast electrical pulses, Appl. Phys. Lett. 68, 590 (1996).
- Buccafusca et al. [1999] O. Buccafusca, J. Chilla, J. Rocca, P. Brusenbach, and J. Martin-Regalado, Transient response of vertical-cavity surface-emitting lasers of different active-region diameters, IEEE J. Quant. Electron. 35, 608 (1999).
- Bittner and Sciamanna [2022] S. Bittner and M. Sciamanna, Complex nonlinear dynamics of polarization and transverse modes in a broad-area vcsel, APL Photonics 7, 126108 (2022).
- Mercadier et al. [2025] J. Mercadier, S. Bittner, D. Rontani, and M. Sciamanna, Chaos from a free-running broad-area VCSEL, Opt. Lett. 50, 796 (2025).
- Lin et al. [2017] H. Lin, S. Ourari, T. Huang, A. Jha, A. Briggs, and N. Bigagli, Photonic microwave generation in multimode vcsels subject to orthogonal optical injection, J. Opt. Soc. Am. B 34, 2381 (2017).
- Debernardi et al. [2002] P. Debernardi, G. P. Bava, C. Degen, I. Fischer, and W. Elsäßer, Influence of anisotropies on transverse modes in oxide-confined vcsels, IEEE J. Quant. Electron. 38, 73 (2002).
- Martín-Regalado et al. [1997] J. Martín-Regalado, S. Balle, M. S. Miguel, A. Valle, and L. Pesquera, Polarization and transverse-mode selection in quantum-well vertical-cavity surface-emitting lasers: index- and gain-guided devices, Quant. Scl. Opt. 9, 713 (1997).
- Martín-Regalado et al. [1997] J. Martín-Regalado, S. Balle, and M. S. Miguel, Polarization and transverse-mode dynamics of gain-guided vertical-cavity surface-emitting lasers, Opt. Lett. 22, 460 (1997).
- Martin-Regalado et al. [1997] J. Martin-Regalado, F. Prati, M. S. Miguel, and N. B. Abraham, Polarization properties of vertical-cavity surface-emitting lasers, IEEE J. Quant. Electron. 33 (1997).
- Willemsen et al. [1999] M. B. Willemsen, M. U. F. Khalid, M. P. van Exter, and J. P. Woerdman, Polarization Switching of a Vertical-Cavity Semiconductor Laser as a Kramers Hopping Problem, Phys. Rev. Lett. 82, 4815 (1999).
- Virte et al. [2013] M. Virte, K. Panajotov, H. Thienpont, and M. Sciamanna, Deterministic polarization chaos in a laser diode, Nature Photonics 7, 60 (2013).
- Olejniczak et al. [2011] L. Olejniczak, K. Panajotov, H. Thienpont, M. Sciamanna, A. Mutig, F. Hopfer, and D. Bimberg, Polarization switching and polarization mode hopping in quantum dot vertical-cavity surface-emitting lasers, Opt. Express 19, 2476 (2011).
- Sivaprakasam et al. [2001] S. Sivaprakasam, I. Pierce, P. Rees, P. S. Spencer, K. A. Shore, and A. Valle, Inverse synchronization in semiconductor laser diodes, Phys. Rev. A 64, 013805 (2001).
- Hong et al. [2004] Y. Hong, M. W. Lee, P. S. Spencer, and K. A. Shore, Synchronization of chaos in unidirectionally coupled vertical-cavity surface-emitting semiconductor lasers, Opt. Lett. 29, 1215 (2004).
- Wedekind and Parlitz [2002] I. Wedekind and U. Parlitz, Synchronization and antisynchronization of chaotic power drop-outs and jump-ups of coupled semiconductor lasers, Phys. Rev. E 66, 026218 (2002).
- Brejnak et al. [2021] A. Brejnak, M. Gebski, A. K. Sokol, M. Marciniak, M. Wasiak, J. Muszalski, J. A. Lott, I. Fischer, and T. Czyszanowski, Boosting the output power of large-aperture lasers by breaking their circular symmetry, Optica 8, 1167 (2021).
- Kim et al. [2023] K. Kim, S. Bittner, Y. Jin, Y. Zeng, Q. J. Wang, and H. Cao, Impact of cavity geometry on microlaser dynamics, Phys. Rev. Lett. 131, 153801 (2023).
- Alkhazragi et al. [2023] O. Alkhazragi, M. Dong, L. Chen, D. Liang, T. K. Ng, J. Zhang, H. Bagci, and B. S. Ooi, Modifying the coherence of vertical-cavity surface-emitting lasers using chaotic cavities, Optica 10, 191 (2023).
- Annovazzi-Lodi et al. [2010] V. Annovazzi-Lodi, G. Aromataris, M. Benedetti, and S. Merlo, Private Message Transmission by Common Driving of Two Chaotic Lasers, IEEE J. Quant. Electron. 46, 258 (2010).
- Jiang et al. [2017] N. Jiang, C. Xue, D. Liu, Y. Lv, and K. Qiu, Secure key distribution based on chaos synchronization of VCSELs subject to symmetric random-polarization optical injection, Opt. Lett. 46, 1055 (2017).