NAM: A Normalization Attention Model for Personalized Product Search In Fliggy
Abstract.
Personalized product search provides significant benefits to e-commerce platforms by extracting more accurate user preferences from historical behaviors. Previous studies largely focused on the user factors when personalizing the search query, while ignoring the item perspective, which leads to the following two challenges that we summarize in this paper: First, previous approaches relying only on co-occurrence frequency tend to overestimate the conversion rates for popular items and underestimate those for long-tail items, resulting in inaccurate item similarities; Second, user purchasing propensity is highly heterogeneous according to the popularity of the target item: it is less correlated with the user’s historical behavior for a popular item and more correlated for a long-tail item. To address these challenges, in this paper we propose NAM, a Normalization Attention Model, which optimizes ”when to personalize” by utilizing Inverse Item Frequency (IIF) and employing a gating mechanism, as well as optimizes ”how to personalize” by normalizing the attention mechanism from a global perspective. Through comprehensive experiments, we demonstrate that our proposed NAM model significantly outperforms state-of-the-art baseline models. Furthermore, we conducted an online A/B test at Fliggy, and obtained a significant improvement of 0.8% over the latest production system in conversion rate.
1. Introduction
Personalized product search addresses the critical problem of information overload in industrial practices (Sondhi et al., 2018; Su et al., 2018). It operates by allowing different individuals to receive personalized results for the same query according to their historical behaviors. This significantly enhances the relevance of search results to user preferences and greatly improves product retrieval performance. Despite its great potential, personalization might not always be beneficial (Teevan et al., 2008; Dumais, 2016; Bennett et al., 2012), since customers’ purchase decisions are affected by both the relevance of target items and the customer preferences. Therefore, it is crucial to understand both ”when to personalize” and ”how to personalize” when developing the search model. To that end, a series of deep-learning models have been proposed to extract user preferences from behavior sequences based on the current search context, such as (Zhou et al., 2018, 2019; Ai et al., 2019; Guo et al., 2019), where attention mechanism plays a crucial role in all these models. Specifically, attention variant models that focus on the relationship between queries and user behavior sequences have been proposed(Ai et al., 2019; Bassani et al., 2024; Bi et al., 2020), allowing the weight of personalization to be as large as 1 when personalization is dominant and as small as 0 when it is not needed at all.
However, the research gap lies in the fact that, to the best of our knowledge, previous models are all built upon query-dependent attention and tend to ignore the characteristics of items as a result. We argue that exploring personalization from the item perspective is particularly important due to the following reasons: (1) To answer the question of ”when to personalize”, the popularity of the items needs to be taken into account, since customers’ purchase decision is also affected by the bandwagon effect (Abdollahpouri et al., 2019; Perc, 2014) brought by the item’s popularity. (2) Relying only on co-occurrence item frequency will lead to the overestimation of conversion rates for popular items and the underestimation for long-tail items, resulting in a Matthew effect(Celma and Cano, 2008), as well as the suboptimal item similarities or attention weights. Considering these challenges, we propose three intuitions, which motivate us to conduct preliminary data analysis to validate them on our industry dataset. Based on the data analysis, we propose the Normalization Attention Model (NAM), which consists of a gating mechanism with IIF of target item to model when to personalize, as well as a global normalized attention mechanism with IIF of items in user historical behaviors to model how to personalize.
2. Intuition & Data Analysis
In this section, we present three intuitions and demonstrate them through data analysis, which inspired the methods for enhancing the ranking model.
Intuition 1: Popular items are overestimated, while long-tail items are underestimated. Due to the fact that the search model is trained based on historical data, popular items dominate the model, resulting in the model overestimating the click-through rate for popular items while underestimating the click-through rate for long-tail items. To demonstrate this intuition, we collect consumer logs from the product search system on Fliggy111http://www.fliggy.com/. Based on the logs, we sort items in descending order based on the number of users who interacted with them and divide them into five levels, then compare the predicted click-though rate & post-click conversion rate (pCTCVR), the actual click-though rate & post-click conversion rate (CTCVR), and predicted Conversion rate Over Conversion rate (PCOC) corresponding to each level. PCOC is calculated as: . The result is presented in Table 1, which clearly indicates that popular items are overestimated, while long-tail items are underestimated.
| Level | ExposurePercentage | pCTCVR | CTCVR | PCOC |
|---|---|---|---|---|
| [0,1%] | 57.08% | 0.74% | 0.63% | 1.1715 |
| (1%,5%] | 21.29% | 0.79% | 0.79% | 0.9957 |
| (5%,20%] | 16.26% | 0.71% | 0.79% | 0.9076 |
| (20%,100%] | 5.37% | 0.18% | 0.22% | 0.8174 |
Intuition 2: Globally-normalized item similarity leads to better recommendation results. Proper suppression of popular items improves the performance of the recommender system. For example, adjusting the weight of item frequency in the similarity formula is often used to alleviate the Harry Potter problem(Zhao et al., 2013) in recommendation system(CarlKadie, 1998). Based on consumer logs collected from our product search system, we investigate the hit rate with different similarity formulas. The hit rate metric is calculated as: , where u represents a user, i represents an item. is the item set that interacted with u. is the collection of items that have interactions occurring later than item i. is the collection of top k similar items of item i. ”” represents the number of elements in a set. Co-occurrence similarity is calculated as: , where is the users that interacted with item . Jaccard similarity is calculated as: , and Cosine similarity is calculated as: . It’s evident from Table 2 that the hit rate of Jaccard and Cosine similarity performs much better than Co-occurrence Frequency similarity, since Jaccard and Cosine similarity involves the item’s frequency as global normalization.
| Method | HitRate@10 | HitRate@20 | HitRate@30 |
|---|---|---|---|
| Co-occurrence Frequency | 10.04% | 17.27% | 22.61% |
| Jaccard | 11.75% | 20.90% | 28.24% |
| Cosine | 12.23% | 22.3% | 30.33% |
Intuition 3: Compared to popular items, the conversion rate of long-tail items is more correlated with the user’s historical behaviors. The data in Table 3 shows that for long-tail items with a popularity level in the range of , the conversion rate of items that users interacted with (IsRetarget=1) is 19.72 times higher than that of items they did not interact with (IsRetarget=0). In contrast, for the top 1% of popular items, the conversion rate of items that users interacted with is 11.5 times higher than that of items they did not interact with, which is significantly lower than the ratio observed for long-tail items. Therefore, we can conclude that whether an item converts is more heavily influenced by similar items in user historical behaviors when the item is a long-tail item. In other words, if the target item is a long-tail item, user historical behavior should be paid more attention.
| Level | IsRetarget | ExposureRate | CTCVR | Retarget/NonRetarget |
|---|---|---|---|---|
| (0,1%] | 0 | 33.95% | 0.50% | 10.50 |
| 1 | 22.45% | 5.20% | ||
| (1%,5%] | 0 | 12.86% | 0.58% | 11.58 |
| 1 | 9.57% | 6.77% | ||
| (5%,20%] | 0 | 9.51% | 0.57% | 11.27 |
| 1 | 7.86% | 6.46% | ||
| (20%,100%] | 0 | 3.15% | 0.17% | 19.72 |
| 1 | 0.65% | 3.36% |
3. Proposed Model
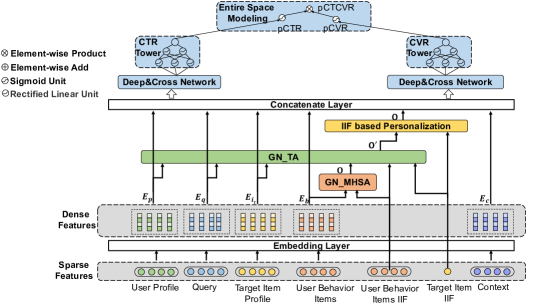
3.1. Global Normalized Multi-Head Self-Attention(GN_MHSA)
To alleviate the Matthew Effect caused by popular items being overestimated and long-tail items being underestimated, we propose the global normalized mechanism, which incorporates the square root of the product of the IIF of item and item when calculating the attention weight between item and item , as Illustrated in Eq.(5). Such square root is the denominator part of the cosine similarity formula, as mentioned in Intuition 1. Each head of GN_MHSA is calculated as follows:
| (1) |
| (2) |
| (3) |
| (4) |
| (5) |
| (6) |
| (7) |
where is one of the items in the user’s historical behaviors, is the length of the user’s behavior sequence, and is the feature embedding of item . is the embedding of the user behavior sequence. are learnable model parameter matrices, indicates dimension. of item is calculated as : , where is the number of users that interacted with item . (Elfwing et al., 2018) is the swish activation function, we use instead of or here to ensure that the values of are within the range of 0 to 1 since the values of IIF are always positive. We denote as the output of GN_MHSA module, where is the number of heads.
3.2. Global Normalized Target Attention(GN_TA)
We also applied global normalization to the target attention module. The target attention in GN_TA module takes embedding of context features as Q part of the attention mechanism, and takes (the output of GN_MHSA) as K/V part of the attention mechanism. Context features consist of user features, target item features, and query features. , denoted as the output of , is calculated as follows:
| (8) |
| (9) |
| (10) |
| (11) |
| (12) |
| (13) |
where is embedding of user features , is embedding of query features, and is embeddings of target item features. represents the embedding of context features. are learnable model parameter matrices.
3.3. IIF-based Personalization
Regarding the question of when to personalize, we propose a gating layer based on IIF to automatically balance the influence of personalization: when an item is very popular, we reduce the dependence on users’ historical preferences, thereby decreasing the influence of personalization. Conversely, for long-tail items, the influence of personalization will be increased. The gating layer formula is described as follows:
| (14) |
where is a learnable model parameter.
4. Experiments
4.1. Dataset and Experimental Settings
Dataset Descriptions. We collect consumer logs from the product search system in Fliggy as the offline dataset. The statistics of the dataset are presented in Table 4. The dataset contains about 374 million training samples and 9 million test samples, which are divided by date.
| # User | # Item | # Impression | # Click | # Conversion |
| 6,267,425 | 975,170 | 383,224,804 | 34,106,927 | 2,766,688 |
Baseline Models: (1) QEM (Ai et al., 2017), which computes query embeddings by encoding query words with a nonlinear projection function. (2) HEM (Ai et al., 2017), which takes into account both the query and user preferences, where user preferences are represented by the text embeddings of items that the user has interacted with. In this paper, we use the clicked item’s titles as the text associated with each user. (3) AEM (Ai et al., 2019), which models the relationship between the query and user behavior sequence with the classical attention mechanism. The NAM is equivalent to the AEM when the Global Normalized Attention module and IIF-based personalization module are removed. (4) ZAM (Ai et al., 2019), which introduces a zero vector to AEM to conduct differentiated personalization for product search based on both the query characteristics and user purchase histories. (5) TEM (Bi et al., 2020), which encodes the sequence of the query and users’ purchase history with a transformer architecture, allowing the effect of personalization to vary from none to domination. (6) DAM (Bassani et al., 2024), which uses cosine similarity instead of scaled-dot product, along with ReLU(Nair and Hinton, 2010), while adding a similarity threshold hyper-parameter to the attention weight, to remove the influence of the irrelevant items.
Experimental Settings. To ensure a fair comparison, our proposed model and all baseline models share the same network structure and hyperparameters, where we i) share the same features; ii) use a three-layer fully connected network with sizes of 512, 256, and 128 to implement the CTR/CVR towers, and apply batch normalization to each layer for convergence; iii) employ as the number of self-attention heads and as the dimension of item embedding; iv) adopt ADAM optimizer to train all models, with a fixed learning rate of 0.001 and a batch size of 1024.
4.2. Offline Comparison Results
Table 5 shows offline evaluation results of different models on our industrial dataset, where our proposed NAM model significantly outperforms all baselines on both CTCVR AUC and CTCVR GAUC. Compared to the second-best baseline, NAM achieved a 0.001 improvement on CTCVR AUC and 0.002 improvement in CTCVR GAUC. In comparison to AEM, the baseline model in our online environment, NAM achieved a 0.0027 improvement in CTCVR AUC and 0.004 improvement in CTCVR GAUC. To validate the effectiveness of different components of NAM, we remove global normalization and IIF based personalization of NAM and make a comparison with our NAM model. As shown in Table 5, global normalization and IIF-based personalization are both useful for performance improvements.
| Models | AUC | GAUC | ||
| CTR | CTCVR | CTR | CTCVR | |
| QEM | 0.7621 | 0.9032 | 0.7126 | 0.8181 |
| HEM | 0.7626 | 0.9034 | 0.7121 | 0.8179 |
| AEM (Base) | 0.7615 | 0.9041 | 0.7148 | 0.8205 |
| ZAM | 0.7647 | 0.9055 | 0.7175 | 0.8225 |
| TEM | 0.7651 | 0.9058 | 0.7166 | 0.8217 |
| DAM | 0.7644 | 0.9049 | 0.7158 | 0.8201 |
| NAM w/o IIF based P13n | 0.7633 | 0.9054 | 0.7184 | 0.8232 |
| NAM w/o GlobalNorm | 0.7621 | 0.9057 | 0.7177 | 0.8218 |
| NAM | 0.7665 | 0.9068 | 0.7192 | 0.8245 |
| Improvement | +0.0014 | +0.001 | +0.0017 | +0.002 |
4.3. PCOC Analysis
Table 6 shows the comparison of PCOC between NAM and AEM on different item popularity level. Compared to AEM, the PCOC of NAM decreases by 3.87% for popular items in the popularity level range of (0, 1%] and increases by 2.69% for long-tail items in the popularity level range of (20%, 100%]. This indicates that our model has made some progress in alleviating the issue of popular items being overestimated and long-tail items being underestimated.
| Level | Model | PCOC | PCOC Diff |
|---|---|---|---|
| (0,1%] | AEM | 1.1715 | |
| NAM | 1.1262 | -3.87% | |
| (1%,5%] | AEM | 0.9957 | |
| NAM | 0.9863 | -0.94% | |
| (5%,20%] | AEM | 0.9076 | |
| NAM | 0.9019 | -0.63% | |
| (20%,100%] | AEM | 0.8174 | |
| NAM | 0.8394 | +2.69% |
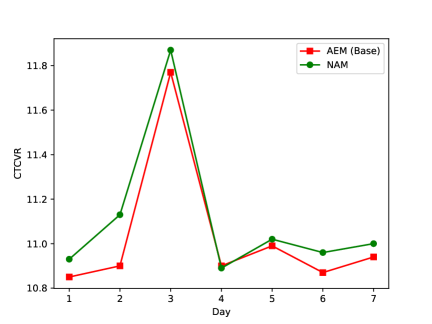
4.4. Online A/B Test
We conduct online A/B test in the product search system in Fliggy within 7 days of November 2024. Figure 2 illustrates the online performance of NAM compared to AEM (Base). The mean CTCVR has increased by 0.8% (Given the substantial daily sales volume of Fliggy and hotel prices in the hundreds of yuan range, a 0.8% increase in sales volume indicates nearly one million yuan increase in revenue.).
5. Conclusion
In this paper, we present three intuitions that are relevant to the personalized product search practices, and investigate these intuitions through data analysis. Based on these observations, we propose a universally applicable personalized and normalized attention model, which optimizes ”when to personalize” by employing an Inverse Item Frequency (IIF) based gating mechanism, as well as optimizes ”how to personalize” by normalizing the attention mechanism from a global perspective. We further conduct comprehensive experimental analyses on an industrial dataset, where the results demonstrate the significant performance improvements of our proposed method over state-of-the-art baselines and multiple variants of attention mechanisms. Finally, this approach also achieved significant benefits in the online environment of product search in Fliggy.
References
- (1)
- Abdollahpouri et al. (2019) Himan Abdollahpouri, Masoud Mansoury, Robin Burke, and Bamshad Mobasher. 2019. The unfairness of popularity bias in recommendation. arXiv preprint arXiv:1907.13286 (2019).
- Ai et al. (2019) Qingyao Ai, Daniel N Hill, SVN Vishwanathan, and W Bruce Croft. 2019. A zero attention model for personalized product search. In Proceedings of the 28th ACM International Conference on Information and Knowledge Management. 379–388.
- Ai et al. (2017) Qingyao Ai, Yongfeng Zhang, Keping Bi, Xu Chen, and W Bruce Croft. 2017. Learning a hierarchical embedding model for personalized product search. In Proceedings of the 40th International ACM SIGIR Conference on Research and Development in Information Retrieval. 645–654.
- Bassani et al. (2024) Elias Bassani, Pranav Kasela, and Gabriella Pasi. 2024. Denoising Attention for Query-aware User Modeling. In Findings of the Association for Computational Linguistics: NAACL 2024. 2368–2380.
- Bennett et al. (2012) Paul N Bennett, Ryen W White, Wei Chu, Susan T Dumais, Peter Bailey, Fedor Borisyuk, and Xiaoyuan Cui. 2012. Modeling the impact of short-and long-term behavior on search personalization. In Proceedings of the 35th international ACM SIGIR conference on Research and development in information retrieval. 185–194.
- Bi et al. (2020) Keping Bi, Qingyao Ai, and W Bruce Croft. 2020. A transformer-based embedding model for personalized product search. In Proceedings of the 43rd International ACM SIGIR Conference on Research and Development in Information Retrieval. 1521–1524.
- CarlKadie (1998) JohnS Breese DavidHeckerman CarlKadie. 1998. Empirical analysis of predictive algorithms for collaborative filtering. Microsoft Research Microsoft Corporation One Microsoft Way Redmond, WA 98052 (1998).
- Celma and Cano (2008) Òscar Celma and Pedro Cano. 2008. From hits to niches? or how popular artists can bias music recommendation and discovery. In Proceedings of the 2nd KDD workshop on large-scale recommender systems and the netflix prize competition. 1–8.
- Dumais (2016) Susan T Dumais. 2016. Personalized Search: Potential and Pitfalls.. In CIKM. 689.
- Elfwing et al. (2018) Stefan Elfwing, Eiji Uchibe, and Kenji Doya. 2018. Sigmoid-weighted linear units for neural network function approximation in reinforcement learning. Neural networks 107 (2018), 3–11.
- Guo et al. (2019) Yangyang Guo, Zhiyong Cheng, Liqiang Nie, Yinglong Wang, Jun Ma, and Mohan Kankanhalli. 2019. Attentive long short-term preference modeling for personalized product search. ACM Transactions on Information Systems (TOIS) 37, 2 (2019), 1–27.
- Ma et al. (2018b) Jiaqi Ma, Zhe Zhao, Xinyang Yi, Jilin Chen, Lichan Hong, and Ed H Chi. 2018b. Modeling task relationships in multi-task learning with multi-gate mixture-of-experts. In Proceedings of the 24th ACM SIGKDD international conference on knowledge discovery & data mining. 1930–1939.
- Ma et al. (2018a) Xiao Ma, Liqin Zhao, Guan Huang, Zhi Wang, Zelin Hu, Xiaoqiang Zhu, and Kun Gai. 2018a. Entire space multi-task model: An effective approach for estimating post-click conversion rate. In The 41st International ACM SIGIR Conference on Research & Development in Information Retrieval. 1137–1140.
- Myerson et al. (2001) Joel Myerson, Leonard Green, and Missaka Warusawitharana. 2001. Area under the curve as a measure of discounting. Journal of the experimental analysis of behavior 76, 2 (2001), 235–243.
- Nair and Hinton (2010) Vinod Nair and Geoffrey E Hinton. 2010. Rectified linear units improve restricted boltzmann machines. In Proceedings of the 27th international conference on machine learning (ICML-10). 807–814.
- Perc (2014) Matjaž Perc. 2014. The Matthew effect in empirical data. Journal of The Royal Society Interface 11, 98 (2014), 20140378.
- Sondhi et al. (2018) Parikshit Sondhi, Mohit Sharma, Pranam Kolari, and ChengXiang Zhai. 2018. A taxonomy of queries for e-commerce search. In The 41st International ACM SIGIR Conference on Research & Development in Information Retrieval. 1245–1248.
- Su et al. (2018) Ning Su, Jiyin He, Yiqun Liu, Min Zhang, and Shaoping Ma. 2018. User intent, behaviour, and perceived satisfaction in product search. In Proceedings of the Eleventh ACM International Conference on Web Search and Data Mining. 547–555.
- Tang et al. (2020) Hongyan Tang, Junning Liu, Ming Zhao, and Xudong Gong. 2020. Progressive layered extraction (ple): A novel multi-task learning (mtl) model for personalized recommendations. In Proceedings of the 14th ACM Conference on Recommender Systems. 269–278.
- Teevan et al. (2008) Jaime Teevan, Susan T Dumais, and Daniel J Liebling. 2008. To personalize or not to personalize: modeling queries with variation in user intent. In Proceedings of the 31st annual international ACM SIGIR conference on Research and development in information retrieval. 163–170.
- Wen et al. (2020) Hong Wen, Jing Zhang, Yuan Wang, Fuyu Lv, Wentian Bao, Quan Lin, and Keping Yang. 2020. Entire space multi-task modeling via post-click behavior decomposition for conversion rate prediction. In Proceedings of the 43rd International ACM SIGIR conference on research and development in Information Retrieval. 2377–2386.
- Zhao et al. (2013) Xiangyu Zhao, Zhendong Niu, and Wei Chen. 2013. Opinion-based collaborative filtering to solve popularity bias in recommender systems. In Database and Expert Systems Applications: 24th International Conference, DEXA 2013, Prague, Czech Republic, August 26-29, 2013. Proceedings, Part II 24. Springer, 426–433.
- Zhou et al. (2019) Guorui Zhou, Na Mou, Ying Fan, Qi Pi, Weijie Bian, Chang Zhou, Xiaoqiang Zhu, and Kun Gai. 2019. Deep interest evolution network for click-through rate prediction. In Proceedings of the AAAI conference on artificial intelligence, Vol. 33. 5941–5948.
- Zhou et al. (2018) Guorui Zhou, Xiaoqiang Zhu, Chenru Song, Ying Fan, Han Zhu, Xiao Ma, Yanghui Yan, Junqi Jin, Han Li, and Kun Gai. 2018. Deep interest network for click-through rate prediction. In Proceedings of the 24th ACM SIGKDD international conference on knowledge discovery & data mining. 1059–1068.
- Zhu et al. (2017) Han Zhu, Junqi Jin, Chang Tan, Fei Pan, Yifan Zeng, Han Li, and Kun Gai. 2017. Optimized cost per click in taobao display advertising. In Proceedings of the 23rd ACM SIGKDD international conference on knowledge discovery and data mining. 2191–2200.