[table]capposition=top
Pinching-Antenna Systems For Indoor Immersive Communications: A 3D-Modeling Based Performance Analysis
Abstract
The emerging pinching antenna (PA) technology has high flexibility to reconfigure wireless channels and combat line-of-sight blockage, thus holding transformative potential for indoor immersive applications in 6G. This paper investigates Pinching-antenna systems (PASS) for indoor immersive communications. Our contributions are threefold: (1) we construct a 3D model to characterize the distribution of users, waveguides, and PAs in the PASS; (2) we develop a general theoretical model on downlink performance of PASS by capturing PA-user relationships and system parameters’ impacts; and (3) we conduct comprehensive numerical results of the theoretical model and provide implementation guidelines for PASS deployments.
Index Terms:
Pinching-antenna systems (PASS), indoor immersive communication, successful transmission probability.I Introduction
The upcoming 6G networks unlock a new era of immersive communications by seamlessly integrating physical infrastructures and virtual worlds, facilitating the widespread adoption of extended reality, metaverse, and digital twin [1, 2]. As shown in Fig. 1, benefited by immersive communications, a variety of indoor applications are emerging, such as holographic displays, virtual tourism, online gaming, and intelligent manufacturing. These indoor immersive applications will fundamentally revolutionize the way people work, entertain, and communicate through lifelike interactions and immersive experiences. However, the devices used for these indoor applications need to operate at high-frequency bands to achieve high-speed data rates and real-time transmissions, making them inherently vulnerable to significant path loss and line-of-sight (LoS) from indoor obstacles. Consequently, these applications impose stringent requirements for network capacity and reliability while facing substantial communication vulnerabilities from fixed deployments of conventional wireless systems.
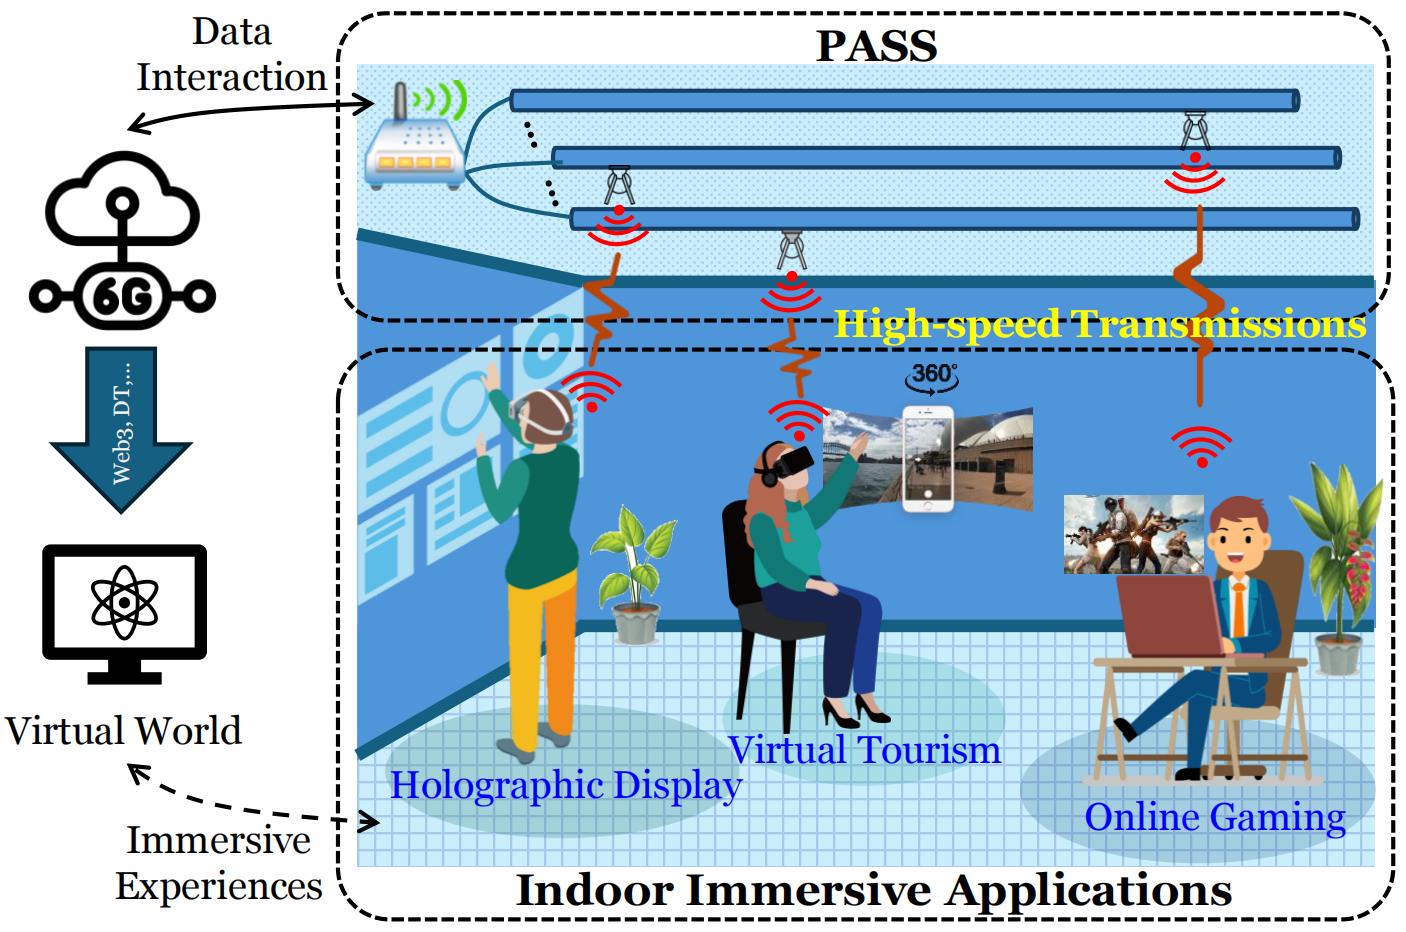
To address the above vulnerabilities, more flexible wireless technologies are required to improve network performance for indoor immersive applications. Pinching antennas (PAs), first demonstrated by NTT DOCOMO in 2021 [3], represent a groundbreaking technology that is capable of reconfiguring wireless channels and establishing LoS connections flexibly [4, 5]. This remarkable flexibility positions the pinching-antenna system (PASS) as a promising solution for indoor immersive applications. An indoor PASS deployment is illustrated in Fig. 1. With high flexibility, PAs are along line-shaped waveguides, adaptively controlled and positioned to serve users for overcoming the transmission vulnerabilities from indoor obstacles. Although prior work has explored various applications of PA, such as PA-assisted integrated sensing and communications (ISAC) [6, 7], non-orthogonal multiple access integration (NOMA) [8], and PA-assisted simultaneous wireless information and power transfer (SWIPT) [9], the critical domain of PA-assisted indoor immersive communications remains unexplored. This gap, coupled with the absence of an accurate and generalizable performance analysis model for indoor immersive applications, motivates our work.
This paper investigates PASS-enabled downlink transmission performance for indoor immersive communications. Our key contributions are threefold: First, we construct a 3D system model for PASS in indoor scenarios, where users (i.e., diverse devices and sensors for immersive applications) are uniformly distributed in the serving area with each waveguide on the ceiling and served by the nearest PA along the waveguide. Second, we develop a general theoretical model for analyzing the downlink performance, i.e., successful transmission probability (STP), which (i) captures the PA-user location correlations, (ii) incorporates critical system parameters (deployment settings and transmission configurations), and (iii) analyzes impacts of the PASS parameters. Third, we conduct comprehensive numerical results to investigate the proposed performance model. The results provide practical guidelines for optimizing system parameters to enhance the performance of PA-assisted indoor immersive communications.
II System Model
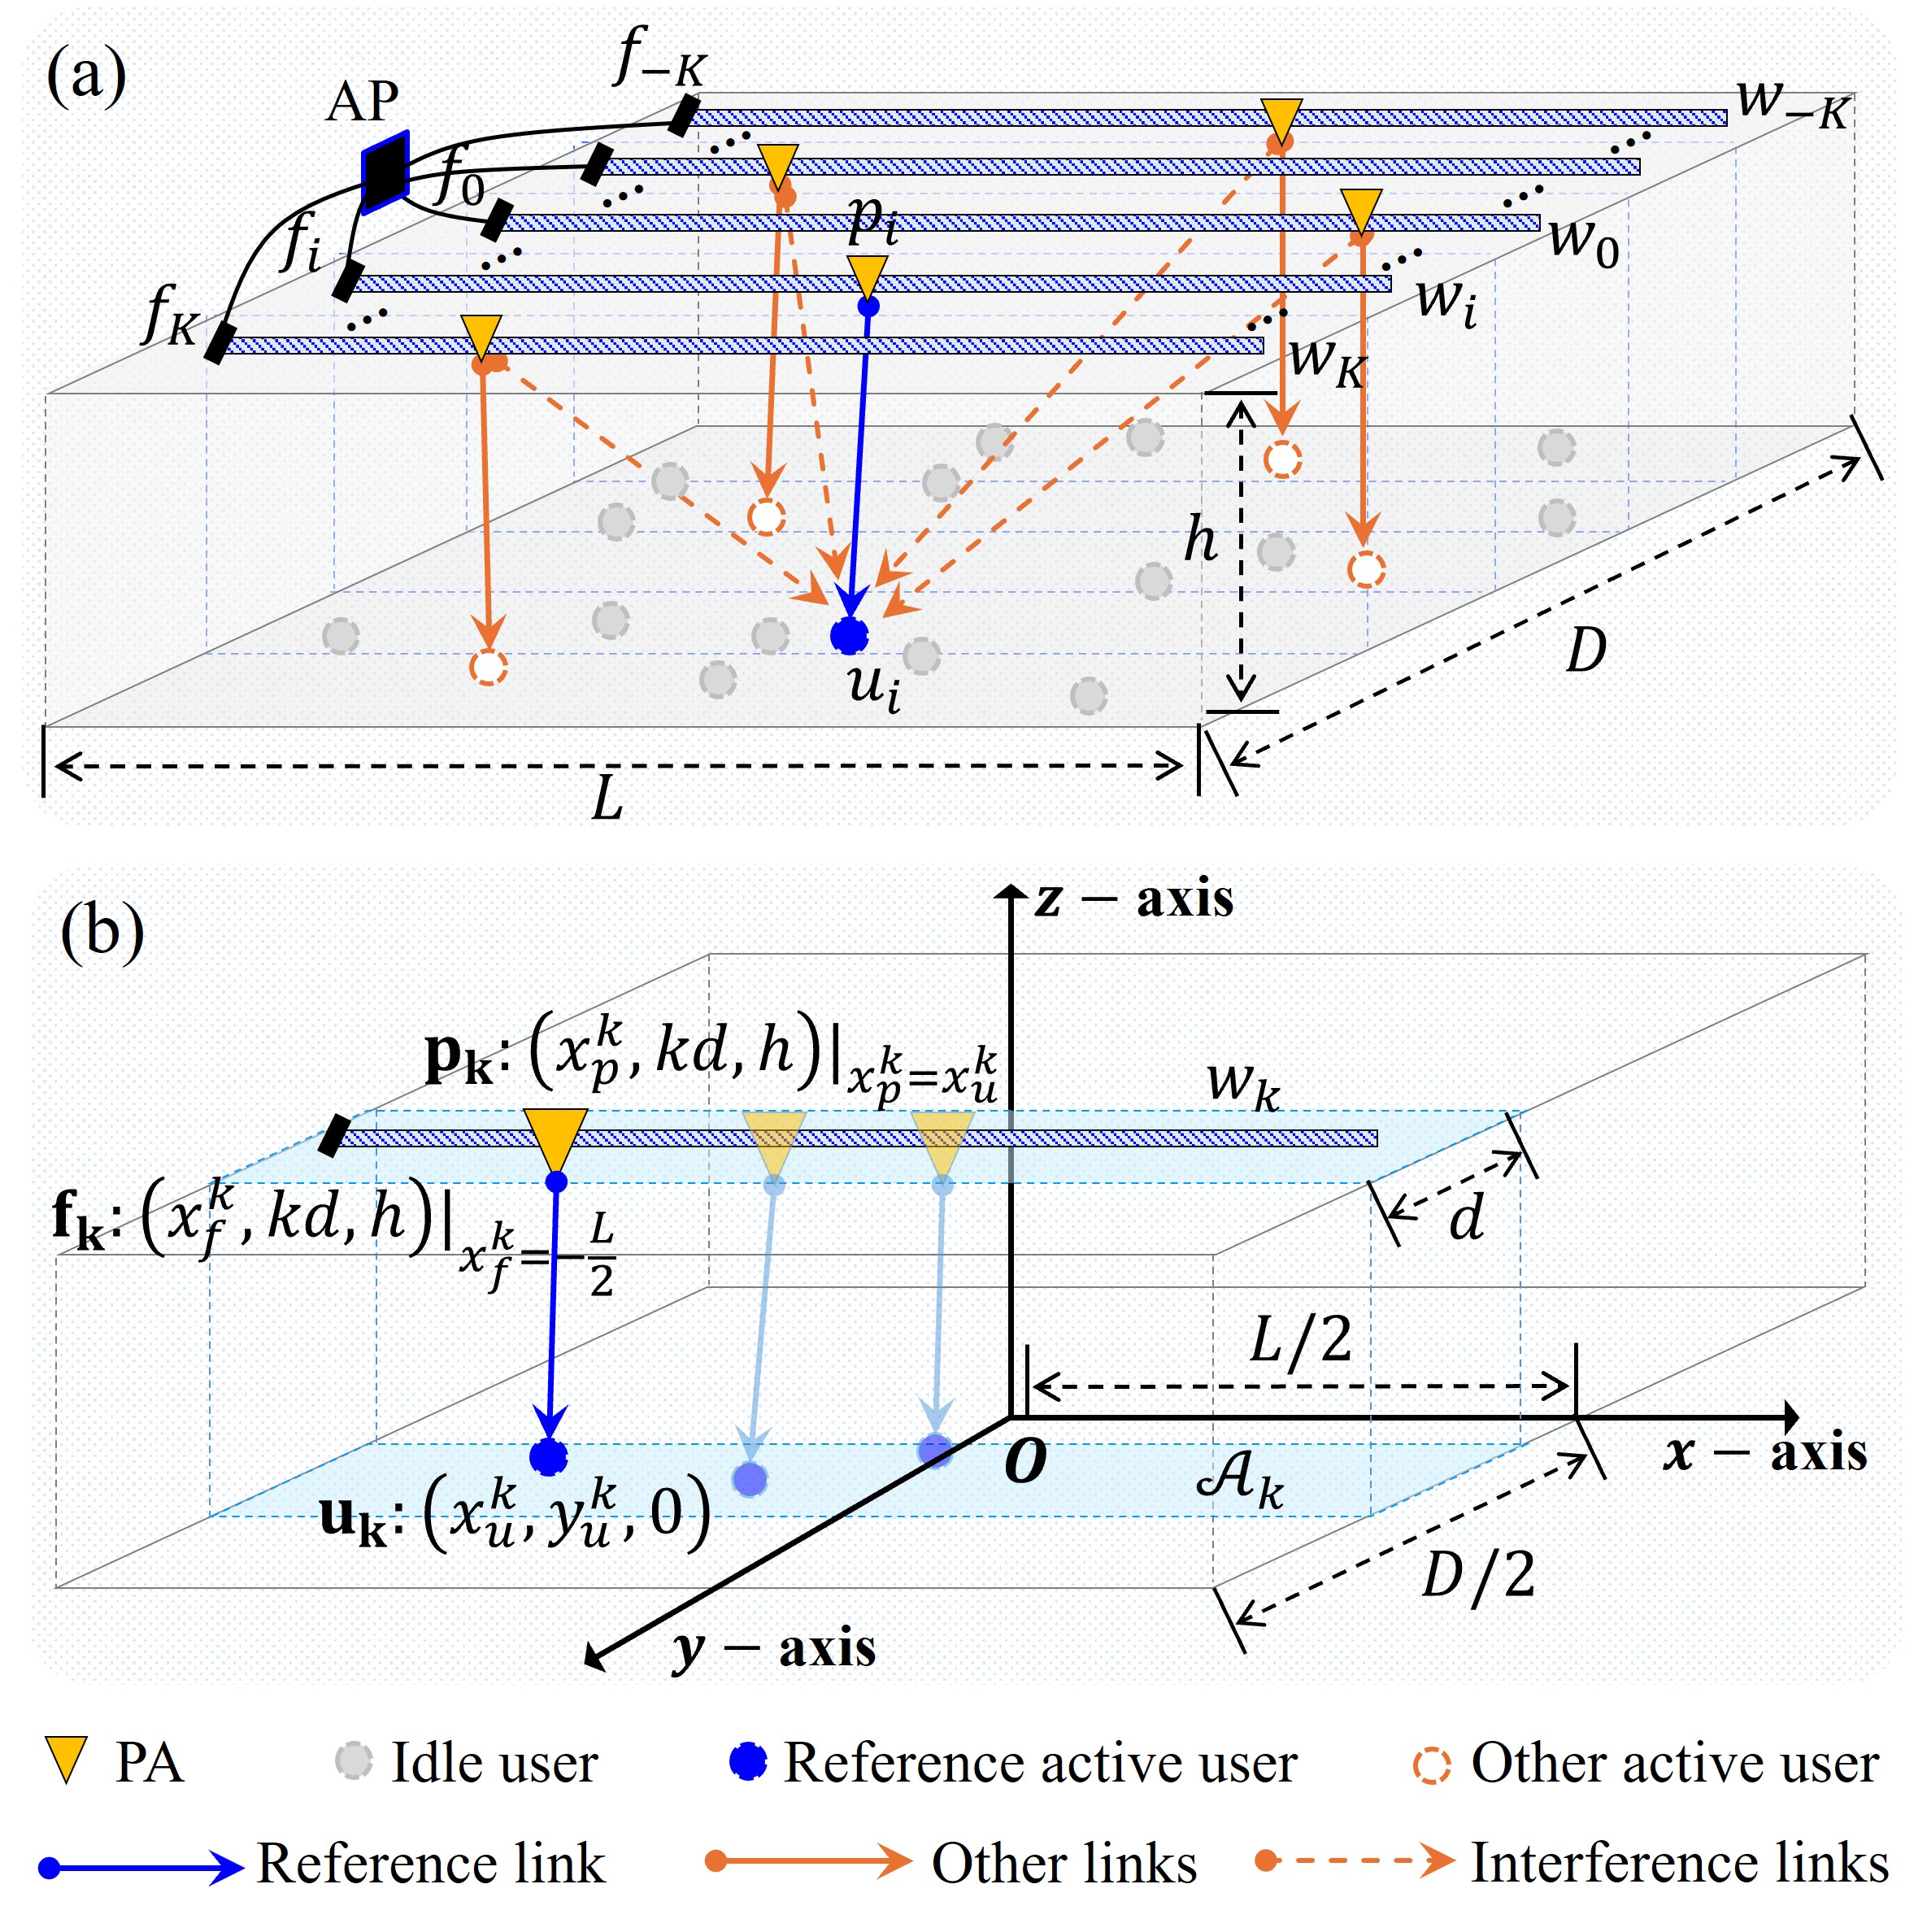
As shown in Fig. 2(a), an access point (AP) equipped with a PASS serves users uniformly distributed in a service area, e.g., a room. Multiple dielectric waveguides of PASS are evenly installed on the ceiling to cover the whole room. Each waveguide is equipped with an adjustable PA controlled by the AP. The AP facilitates downlink transmissions for users with immersive experiences.
II-A Deployment Model
The service area is approximated as a rectangular cuboid with length , width , and height . In the PASS, waveguides are installed along the wider side of the ceiling, with an inter-waveguide spacing of among each other; and each waveguide has a length equal to the room length . Let denote the set of waveguides, where . The central waveguide is positioned along the midline of the ceiling’s wide side, while the remaining waveguides are symmetrically arranged on either side of . Each waveguide is connected to the AP via a dedicated radio frequency (RF) chain, with signal injection occurring at its feed point . The users are uniformly distributed across the ground. Each user is served by its nearest waveguide. For a user served by the waveguide , the position of the PA is the nearest location of its user, i.e., the top of the user. Considering the inter-waveguide spacing , the service regions of the waveguides on the ground can be modeled as multiple rectangular areas, each with a length of and a width of , directly beneath the corresponding waveguides. It is worth noting that is required to ensure the deployment of waveguides in the room.
II-B 3D Coordinate System
We establish a 3D Cartesian coordinate system as illustrated in Fig. 2(b). The origin, denoted as , is located at the midpoint of the room’s floor. The -plane is on the ground, the -axis points toward the midpoint of the floor’s wider side, the -axis is perpendicular to the -axis and oriented in the direction opposite to the feed points of the waveguides, and the -axis extends vertically toward the midpoint of the ceiling. Therefore, the position of every node in the PASS can be represented as a 3D coordinate . For a waveguide positioned at and (i.e., on the ceiling), let , , and denote the coordinates of its feed point , its PA , and its served user , respectively. We have
where . Since is movable along the waveguide , its axis location has the value range . Let be the service region of on the ground, the points on has the axis/axis values and . Given the fixed , is adjusted to the nearest location of the served user, i.e., .
II-C Channel Model
To provide downlink services for users, the AP passes signals into multiple waveguides. Each downlink signal propagates through the waveguide from the feed point to the PA. The PA then radiates the signal to its served user. The signal propagated through the waveguide experiences a phase shift [4]. Let be the phase shift gain between the feed point and the PA , which is given by
| (1) |
where is the imaginary unit, is the guided wavelength with being the effective refractive index of the dielectric waveguide [4], is the wavelength of the signal, and is the distance between and .
Since the PA in each waveguide is usually activated to the top of its user, the link between them is assumed as the line-of-sight (LoS) path, and the free-space channel model is used to characterize the signal propagation. Let be the channel between and its serving user , which is given by
| (2) |
where is the path loss at a reference distance of 1 m, and is the distance between and . Recall that and have the same axis location for the nearest association. Then their distance only depends on the height of and their axis locations.
III Performance Modeling
This section first provides the link model involving the transmitted signal and the received signal-to-interference-plus-noise-ratio (SINR). Accordingly, we develop the theoretical model for link performance and provide some analysis.
III-A Link Model
As shown in Fig. 2(a), we consider a typical PA-assisted downlink transmission scenario, where all waveguides simultaneously work and each serves one user. The PA in each waveguide is assumed to use the identical power, i.e., , where is the total radiation power of the AP [5]. Let be the normalized signal fed into the waveguide (with the PA ), where .
The practical resources of spectrum are limited to support the increasing number of users. Thus, interference occurs when multiple PA-assisted downlink links compete and use the same spectrum band. For the reference link from the PA to the user , let be the received signal by , which is given by
| (3) |
where is the interference causing by other PAs () with is the interference intensity factor to accommodate these more complex scenario, e.g., various multiple access schemes and changing transmission requirements from users. The term denotes the additive white Gaussian noise with zero mean and variance [4].
Let be the SINR measured at , which is given by , where is the received power of the signal from and is the received power of aggregative interference signals from , which are calculated by
III-B Tranmission Performance
Given a wireless link, the signal can be successfully received and decoded only when the received SINR at the receiver exceeds a given threshold. For the reference link from the PA to the user , let be the SINR threshold at . The successful transmission probability (STP) of the reference link, denoted by , is given by . Referring to Eqs. 6, 4 and 5, can be evaluated by Proposition 1.
Proposition 1.
Given and , the STP can be evaluated by the Cumulative Distribution Function (CDF) of , i.e.,
Proof. The proof is provided in Appendix A.
Referring to Proposition 1, the calculation of needs to further find . Recall that each PA’s location is align with its served user and all users are independently distributed, and hence can be derived accordingly. Thus, we have the theoretical model of as given in Theorem 1.
Theorem 1.
The STP of the link from to is given by
Proof. The proof is provided in Appendix B.
Remark 1.
Theorem 1 leads to the following conclusions.
-
•
Theorem 1 provides a general formula of STP for any specific link from to . This formula can explore the performance distribution given different locations of and in the room, thus giving insights for practical implementations. Particularly, Fig. 3 in Section IV shows the visualized results and specific insights.
-
•
Based on Theorem 1, can be accurately calculated via two types of parameters. One is about the PASS settings (including , , , and ). Another is about the transmission configurations (including ). We give the comprehensive numerical results to analyze the impacts of these parameters in Section IV.
-
•
Theorem 1 can be easily extended to more diverse transmission scenarios, e.g., the changing values of and for different users. Accordingly, our model can be used to facilitate system optimization, e.g., dynamic power allocation of different PAs given changing transmission requirements or multiple access schemes.
IV Experimental Results
This section presents comprehensive numerical results for the proposed theoretical model of in Section III-B. In our result, the carrier frequency GHz, the waveguide’s refractive index [4], and the room width m are used. We consider the efficient coverage strategy 111Thus, the interwave spacing is determined by . and the equal power allocation strategy with and set in the particular result. Accordingly, we analyze the impacts of the following system parameters, including the reference user ’s location in the whole room, the PASS settings (i.e., , , , and ), and transmission configurations (i.e., , , and ) on . Considering the uniformly distributed users in the room, Monte Carlo simulations are implemented in MATLAB to calculate the average STP and verify theoretical results. In all figures, we adopt the labels “Theo.” and “Simu.” to differentiate the theoretical and simulation results, respectively.


In Fig. 3, we analyze the spatial distribution of based on the reference user’s location, i.e., , in the whole room. Fig. 3LABEL:sub@Fig-Ps-u0-a plots the heatmap of the theoretical result of , which exhibits two symmetric distribution patterns.
-
•
Pattern 1: Given distributed in the service area of the waveguide , ’s distribution is symmetric along (located at ). Particularly, has the minimum value along and symmetrically increases by moving away from along its two sides.
-
•
Pattern 2: Given distributed in the whole room , ’s distribution is symmetric along the center waveguide (located at ). Particularly, periodically varies with the changing under different service areas . The overall trend is similar to Pattern 1, where has the minimum value along and symmetrically increases with the changing far away from .
The above phenomena result from the systematic spatial distribution of interference across the service area of each waveguide. Undoubtedly, the user at the center of the service area (i.e., room) suffers the maximum interference by uniformly aggregating all interference signals. Meanwhile, the user served by different waveguides experiences the periodical distribution in the whole room because of the parallel distribution of waveguides. Additionally, Fig. 3LABEL:sub@Fig-Ps-u0-b and Fig. 3LABEL:sub@Fig-Ps-u0-c show the details of the distribution of under the changing along the -axis and the -axis, respectively. It can be seen that increases when either values of or far away from the center or . This is because the propagation distance of the desired signal is nearly optimized by the flexible PA’s location aligning with the user, thus, the longer propagation distance of the interference signal potentially enhances the SINR.
( m, dBm, dBm, dB).

(, m, m).
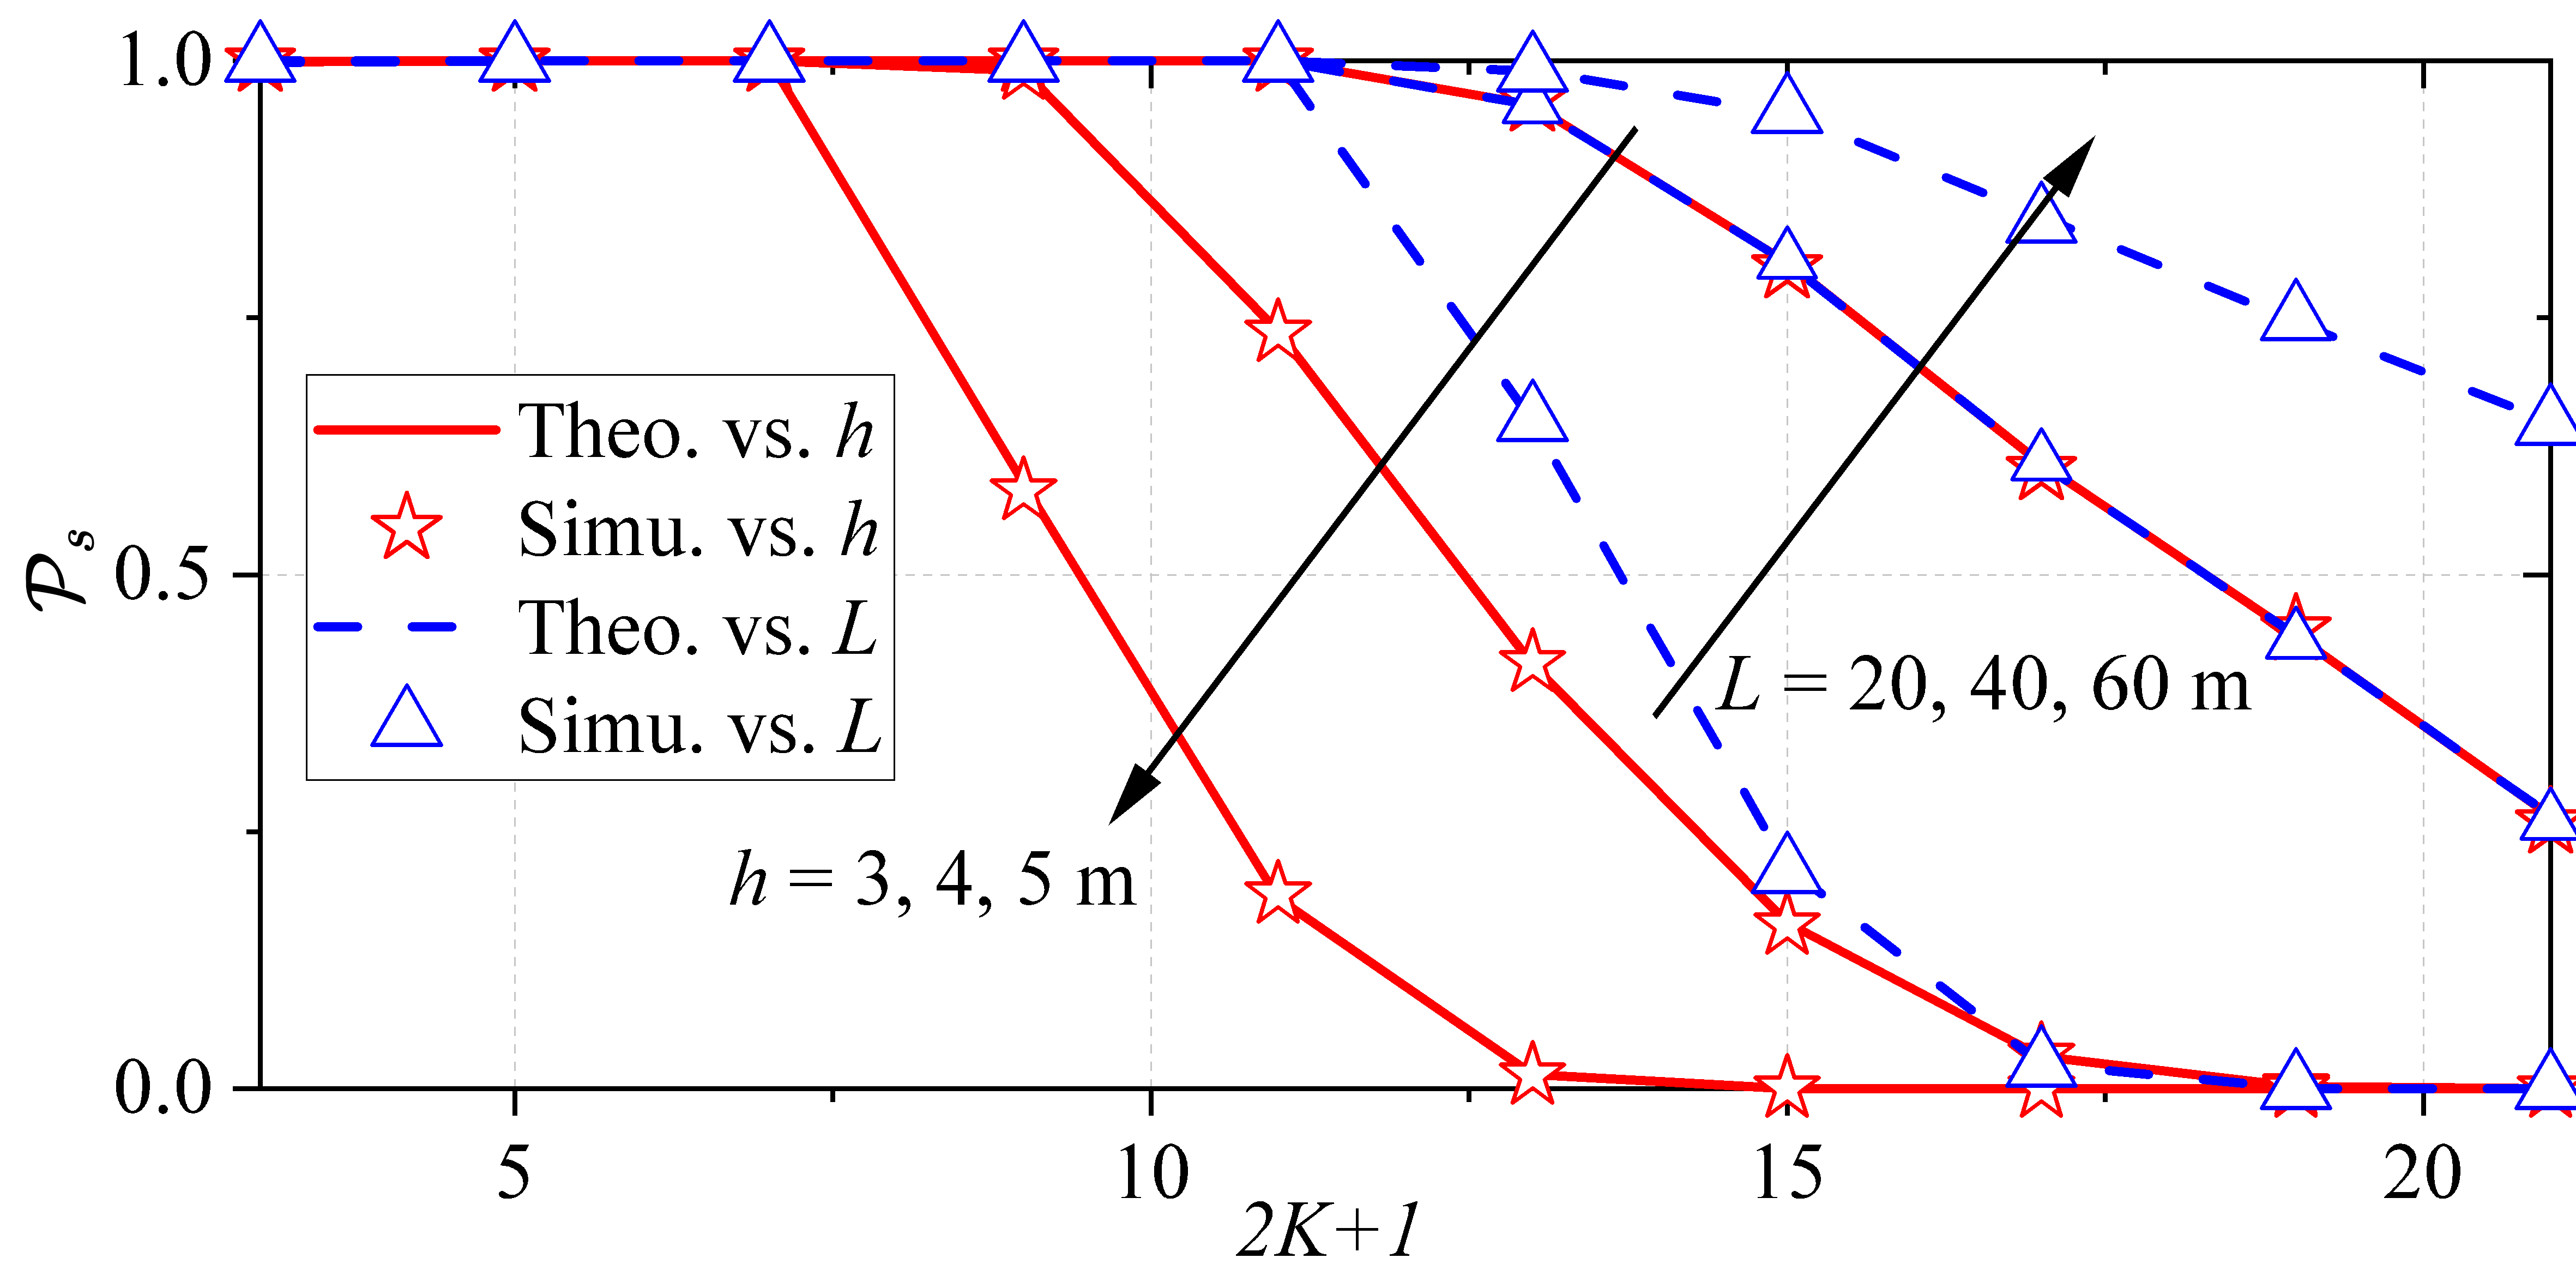
In Fig. 4, we analyze the impacts of , , , , , , and on . We have the following observations.
-
•
decreases as increases. This is because we adopt a coverage strategy where and an equal power allocation strategy where , with and being constant. As increases, both the per-waveguide power allocation and the inter-waveguide spacing decrease, while the number of interference sources grows. The latter effect reduces the SINR at the user, leading to a decrease in .
-
•
decreases as increases or increases. It occurs because a larger extends the propagation distance and lowers the received power for both desired and interference signals. Based on our setting, the power reduction of the desired signal dominates over that of the interference, leading to a final decrease in SINR and . Meanwhile, a larger disperses interfering PAs, reducing the aggregated interference and increasing .
-
•
increases with the increasing , the decreasing , or the decreaing . First, the larger or the smaller leads to the larger (Referring to the SINR model in Eq. (6)), thus enhancing the received SINR at and resulting in a higher . Then, a larger raises the decoding threshold, thereby lowering .
Summary: Overall, all simulation results match closely with the theoretical results, thus verifying the accuracy of our model. Meanwhile, the findings from our results can provide many valuable practical insights for network operators and system engineers to optimize parameter configurations in the PASS. For instance, the spatial trends observed in Fig. 3 offer guidance for user deployment strategies aimed at maximizing the downlink successful transmission probability across different waveguide coverage areas. Additionally, the variations in depicted in Fig. 4 serve as a reference for configuring the PASS under diverse environmental conditions (e.g., room size, network status), enabling power-efficient operation.
V Conclusion
We investigated downlink transmission performance in PA-assisted indoor immersive communications. Specifically, we first developed a 3D spatial model that accurately characterizes the distribution of users, waveguides, and PAs in a typical indoor scenario. We then evaluated the PA-assisted downlink link performance, i.e., STP, which captures the critical location-dependent relationships between system components while quantifying the impacts of key deployment parameters. Extensive Monte Carlo simulations were conducted to verify the accuracy of the proposed theoretical model. In our future work, we will further unlock the potential of PA-assisted indoor immersive communications in addressing practical challenges. These include the integration of multiple access mechanisms, the mitigation of random blockage effects, and the management of multipath interference. How to develop comprehensive models and solutions for these challenges also represents an important direction for our future research.
Appendix A
Appendix B
Proof of Theorem 1: Let denote the characteristic functions of , the CDF can be obtained by [11]
| (8) |
where calculates the imaginary part. Recall that each PA’s location is aligned with its served user and all users are independently distributed. Then the interfering PAs are independently and uniformly distributed. Let denote the characteristic functions of , we have
| (9) | |||
| (10) |
where Eq. 9(a) comes from the independent characteristic of . In Eq. 10, (a) comes from the variable in , (b) is resulted from the uniform distribution of in the service region of the waveguide , where probability density function (PDF) of is , and (c) is due to the identical distribution of . Substituting Eqs. 10, 9 and 8 into Eq. 7, we have
where is the independent distribution of and comes from the substitution of .
References
- [1] H. Du, J. Wang, D. Niyato, J. Kang, Z. Xiong, and D. I. Kim, “AI-generated incentive mechanism and full-duplex semantic communications for information sharing,” IEEE J. Sel. Areas Commun., vol. 41, no. 9, pp. 2981–2997, 2023.
- [2] W. Liu, Y. Fu, Z. Shi, and H. Wang, “When digital twin meets 6G: Concepts, obstacles, and research prospects,” IEEE Commun. Mag., vol. 63, no. 3, pp. 16–22, 2025.
- [3] H. O. Y. Suzuki and K. Kawai, “Pinching antenna: Using a dielectric waveguide as an antenna,” NTT DOCOMO Technical J, 2022.
- [4] Z. Ding, R. Schober, and H. V. Poor, “Flexible-antenna systems: A pinching-antenna perspective,” IEEE Transactions on Communications, 2025.
- [5] Y. Liu, Z. Wang, X. Mu, C. Ouyang, X. Xu, and Z. Ding, “Pinching antenna systems (PASS): Architecture designs, opportunities, and outlook,” arXiv preprint arXiv:2501.18409, 2025.
- [6] Y. Qin, Y. Fu, and H. Zhang, “Joint antenna position and transmit power optimization for pinching antenna-assisted ISAC systems,” arXiv preprint arXiv:2503.12872, Mar. 2025.
- [7] Z. Zhang, Y. Liu, B. He, and J. Chen, “Integrated sensing and communications for pinching-antenna systems (PASS),” arXiv preprint arXiv:2504.07709, 2025.
- [8] Y. Fu, F. He, Z. Shi, and H. Zhang, “Power minimization for NOMA-assisted pinching antenna systems with multiple waveguides,” arXiv preprint arXiv:2503.20336, 2025.
- [9] Y. Li, J. Wang, Y. Liu, and Z. Ding, “Pinching-antenna assisted simultaneous wireless information and power transfer,” 2025. [Online]. Available: https://arxiv.org/abs/2505.06240
- [10] D. Tyrovolas, S. A. Tegos, P. D. Diamantoulakis, S. Ioannidis, C. K. Liaskos, and G. K. Karagiannidis, “Performance analysis of pinching-antenna systems,” arXiv preprint arXiv:2502.06701, 2025.
- [11] G. Ghatak, S. R. Khosravirad, and A. De Domenico, “Stochastic geometry framework for ultrareliable cooperative communications with random blockages,” IEEE Internet Things J., vol. 9, no. 7, pp. 5150–5161, 2021.